


China's factories are pricing in 5.7%. Its shoppers are pricing in 0.7%.


Three numbers from China's October inflation report, released on November 9, do most of the work.
0.7% — headline CPI, year on year. Down from 0.9% in September, below the 0.8% consensus, the slowest in three months. Month on month it was flat.
5.7% — PPI, year on year. Up from 5.0% in September, above the 5.3% forecast, and the fastest since June 2022.
7.9% — PPI for purchased inputs, year on year, up 1.1% on the month.
The first two are five percentage points apart. The third is two points above the second. That ordering — inputs rising faster than factory-gate prices, which are rising faster than what consumers will pay — is not an inflation story. It is a margin story.
| Indicator (October, y/y) | Actual | Prior | Consensus |
|---|---|---|---|
| Headline CPI | +0.7% | +0.9% | +0.8% |
| Core CPI (ex food & energy) | +0.8% | +1.0% | +0.9% |
| PPI | +5.7% | +5.0% | +5.3% |
| PPI, purchased inputs | +7.9% | — | — |
The five-point gap is a margin, not a statistic
Where the producer-price impulse comes from
Start with what lifted producer prices. Energy is the first driver: oil, gas and coal extraction rose on higher international crude and winter demand. The second is policy-driven — capacity governance in over-supplied industries. The third is the one worth underlining: AI-related demand lifted non-metallic minerals, electrical machinery and electronics.
That last piece is why the PPI print is not simply an oil echo. Even as crude has since collapsed — Brent fell 5.93% to $92.49 on November 9 — China's producer prices accelerated. Some of that is timing (October captured the war premium), but some is the electronics complex running hot on data-centre demand.
Now the consumer side.
Why +22.4% gasoline didn't lift the headline
Look inside the CPI basket and the mechanics become obvious. Food fell 2.9% year on year, with fresh vegetables down 16.9% and pork down 8.6%. That single line item is heavy enough to offset almost everything else.
What did rise: gasoline +22.4%, services +0.7%, and a cluster of tech goods — data storage +45.4%, tablets +29.3%, computers +23.0%, phones +16.7%. Gold jewellery added just 4.5%, a sharp deceleration from earlier in the year.
So the picture is not "China is deflating". It is two economies moving at different speeds: a producer sector repricing on energy and AI demand, and a consumer sector where food disinflation and weak services pricing cap the headline.
For equities, the transmission is straightforward. A company that buys inputs at +7.9% and sells into a market growing at +0.7% has one lever: cut costs or cut output. Consumer-goods PPI was -0.1% year on year — the pricing power simply is not there.
Hong Kong was the only major market that sat out the peace trade
On November 9 the S&P 500 rose 2.35%, the Nasdaq 2.74%, and the Philadelphia Semiconductor Index 6.85%.
The Hang Seng closed at 24,448.95, down 0.13%. Hang Seng Tech fell 0.92%. Main-board turnover dropped 29.8% to HK$173.7 billion. Mainland indices were barely better: Shanghai added 0.32%, the CSI 300 0.1%, Shenzhen slipped 0.27%.
Why the +5.1% week did not extend
That divergence has a name, and it is not geopolitics. Hong Kong had already run +5.1% the prior week on policy support for capital markets — the move happened early. What the index could not do is extend it, because extension requires earnings, and the October inflation report is the clearest evidence yet that earnings are being squeezed from both ends.
One more input landed on November 10: the suspension of China's 24% tariff on US goods was extended by two months. That removes a near-term cliff for exporters. It does not change the margin arithmetic.
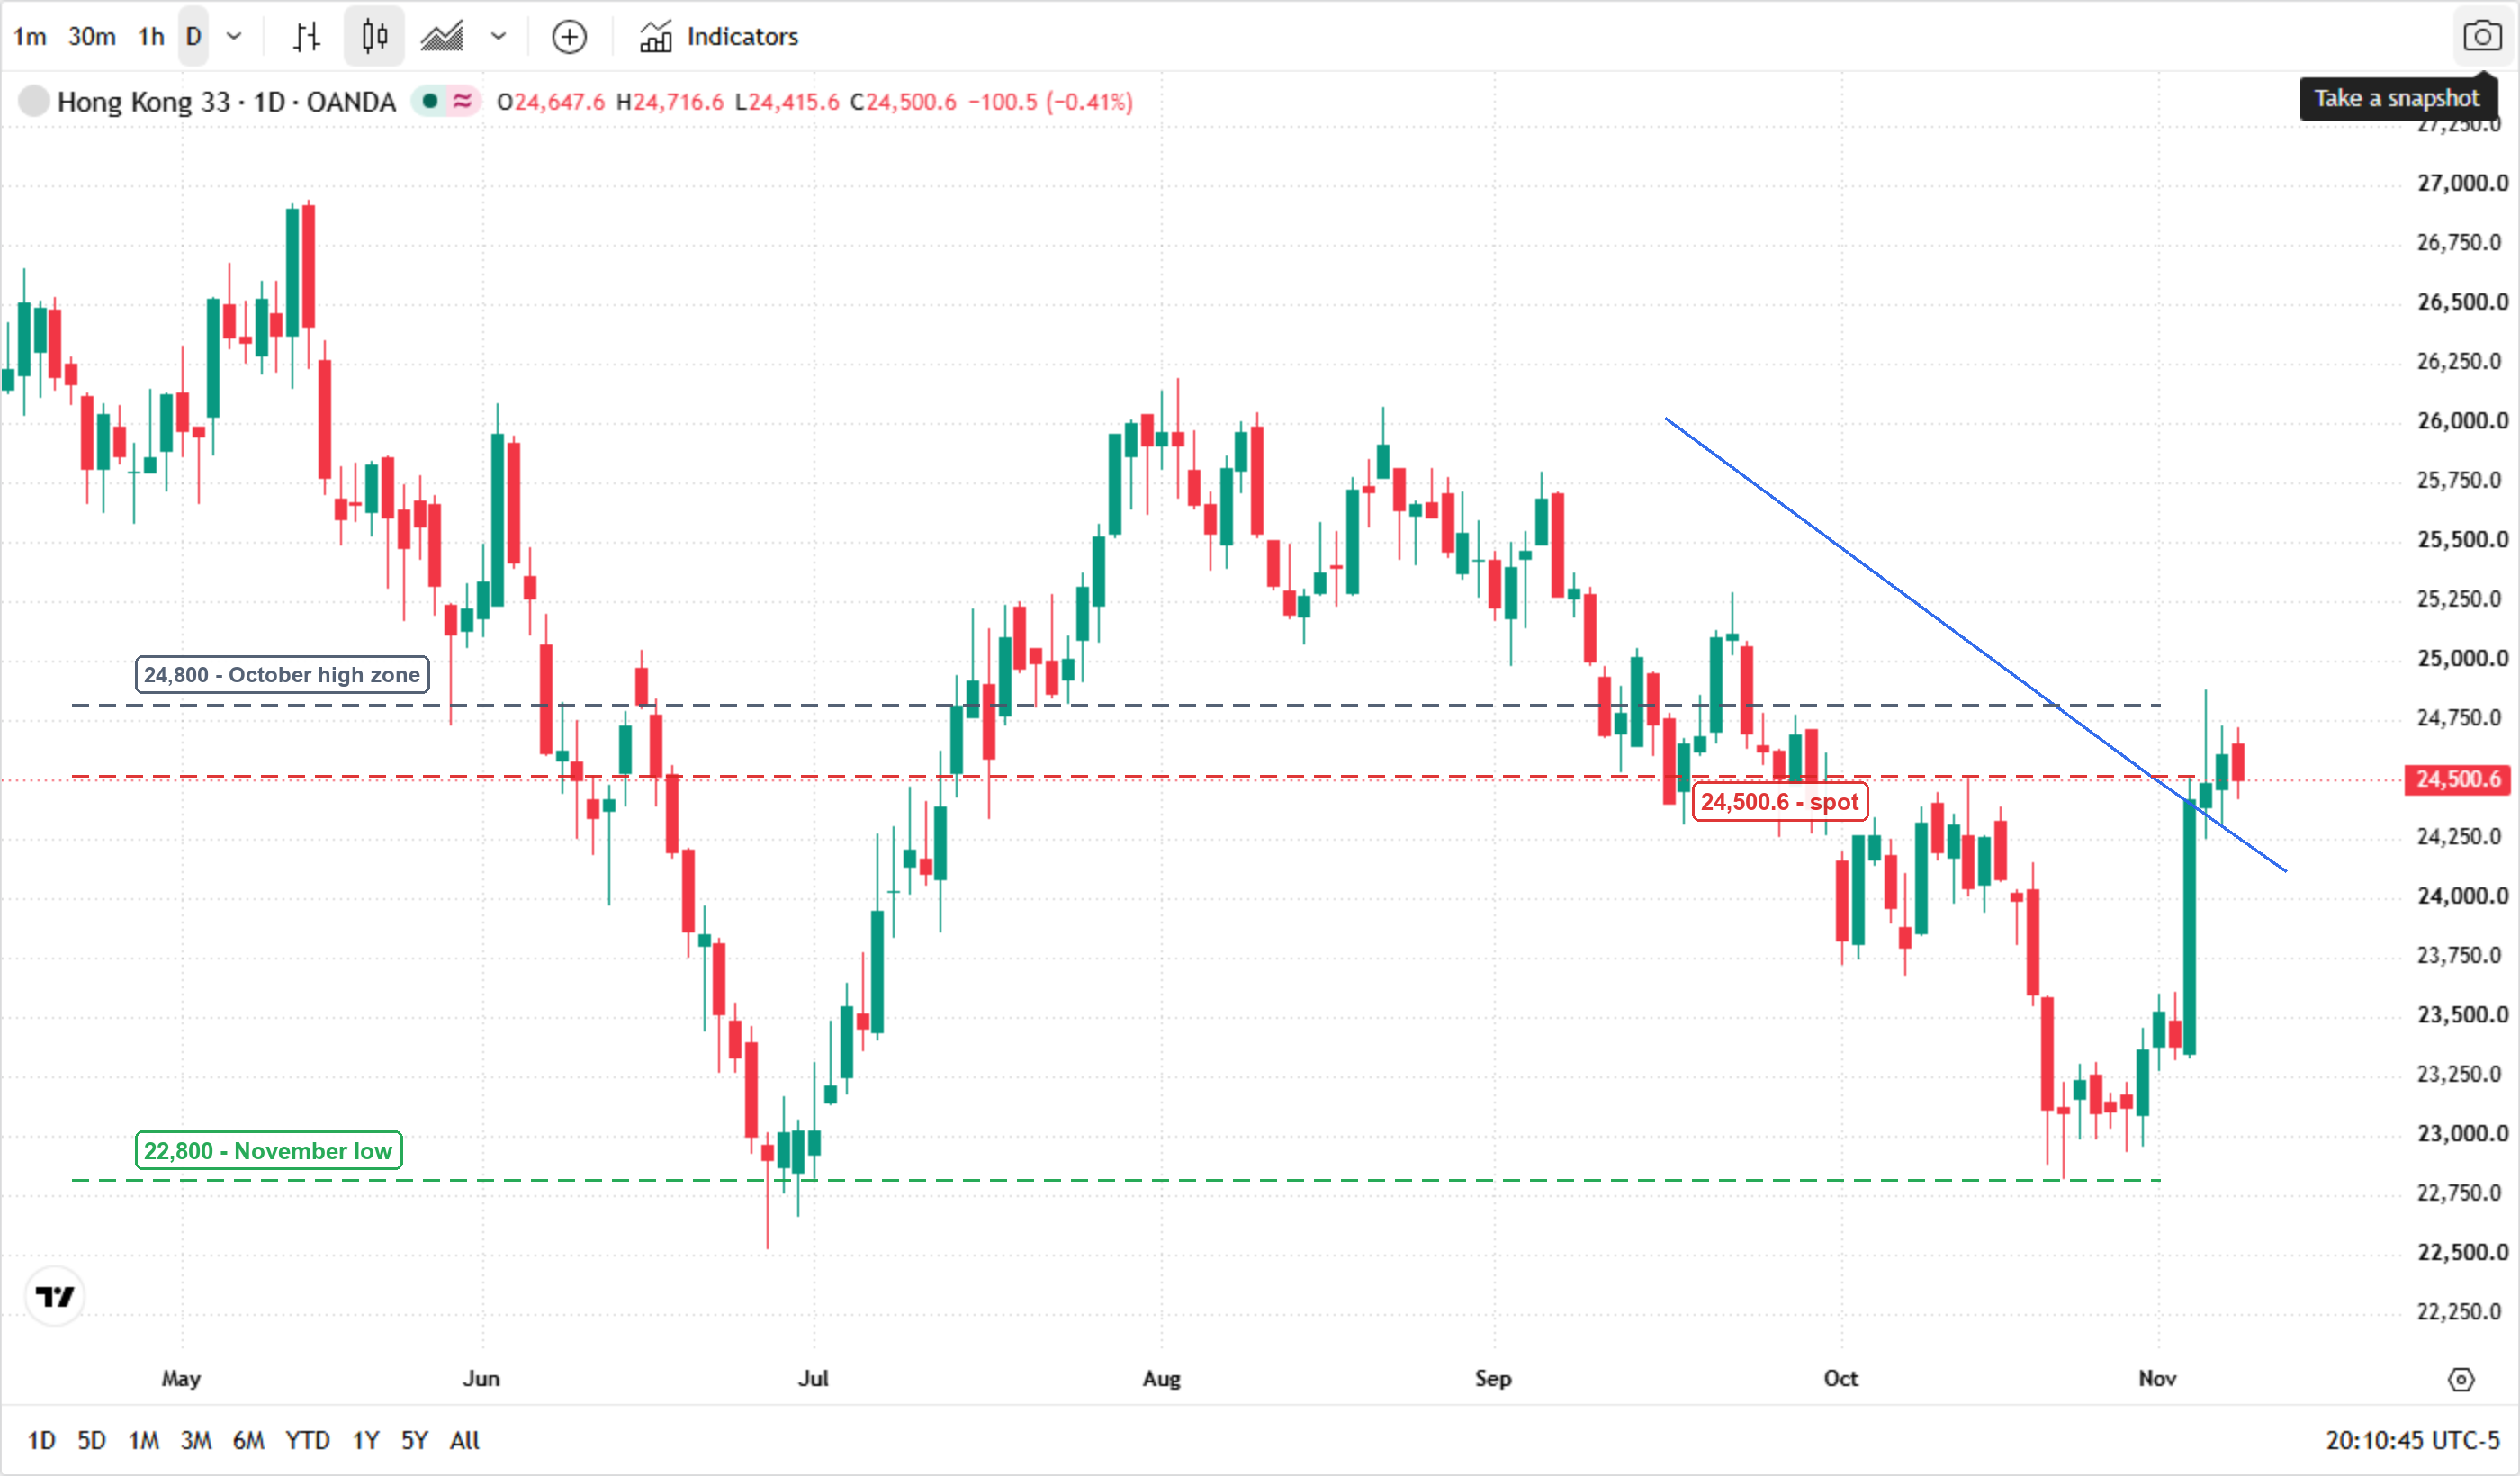
* Chart source: TradingView (OANDA:HK33HKD, daily)
Three dates between here and the next print
The margin story does not resolve on a chart. It resolves on a calendar.
| Date | Event | Why it matters for the gap |
|---|---|---|
| November 10 | US October CPI, 13:30 GMT | Sets the dollar and therefore the copper and HK50 beta |
| November 13 | US October PPI | A second read on whether the global input-price impulse is fading |
| Early December | China November CPI / PPI | The first print after crude's 21% slide — if PPI stays above 5% with oil at $92, the squeeze is structural, not energy |
The falsification condition is simple. If China's PPI rolls over toward 4% in December while CPI holds near 0.7%, the margin squeeze is temporary and the Hang Seng's stall is a pause. If PPI stays above 5% with Brent at $92 and CPI stays under 1%, then the five-point gap is the new normal — and Hong Kong equities are priced for a recovery that the inflation data says is not happening yet.
Read more
Before making any trading decisions, it is important to equip yourself with sufficient fundamental knowledge, have a comprehensive understanding of market trends, be aware of risks and hidden costs, carefully consider investment targets, level of experience, risk appetite, and seek professional advice if necessary.
Furthermore, the content of this article is solely the author's personal opinion and does not necessarily constitute investment advice. The content of this article is for reference purposes only, and readers should not use this article as a basis for any investment decisions.
Investors should not rely on this information as a substitute for independent judgment or make decisions solely based on this information. It does not constitute any trading activity and does not guarantee any profits in trading.
If you have any inquiries regarding the data, information, or content related to Mitrade in this article, please contact us via email: insights@mitrade.com. The Mitrade team will carefully review the content to continue improving the quality of the article.


