


Brent rose 3.3% and US crude stocks built 4.66 million barrels in the same week


Brent January futures settled at $95.82, up 3.3%, and WTI December at $88.74, up 2.55% — the highest closes since November 6. Both contracts are still down roughly 3% on the week, heading for a second consecutive weekly decline.
The move was not about demand. It started with a headline and ran into an inventory report.
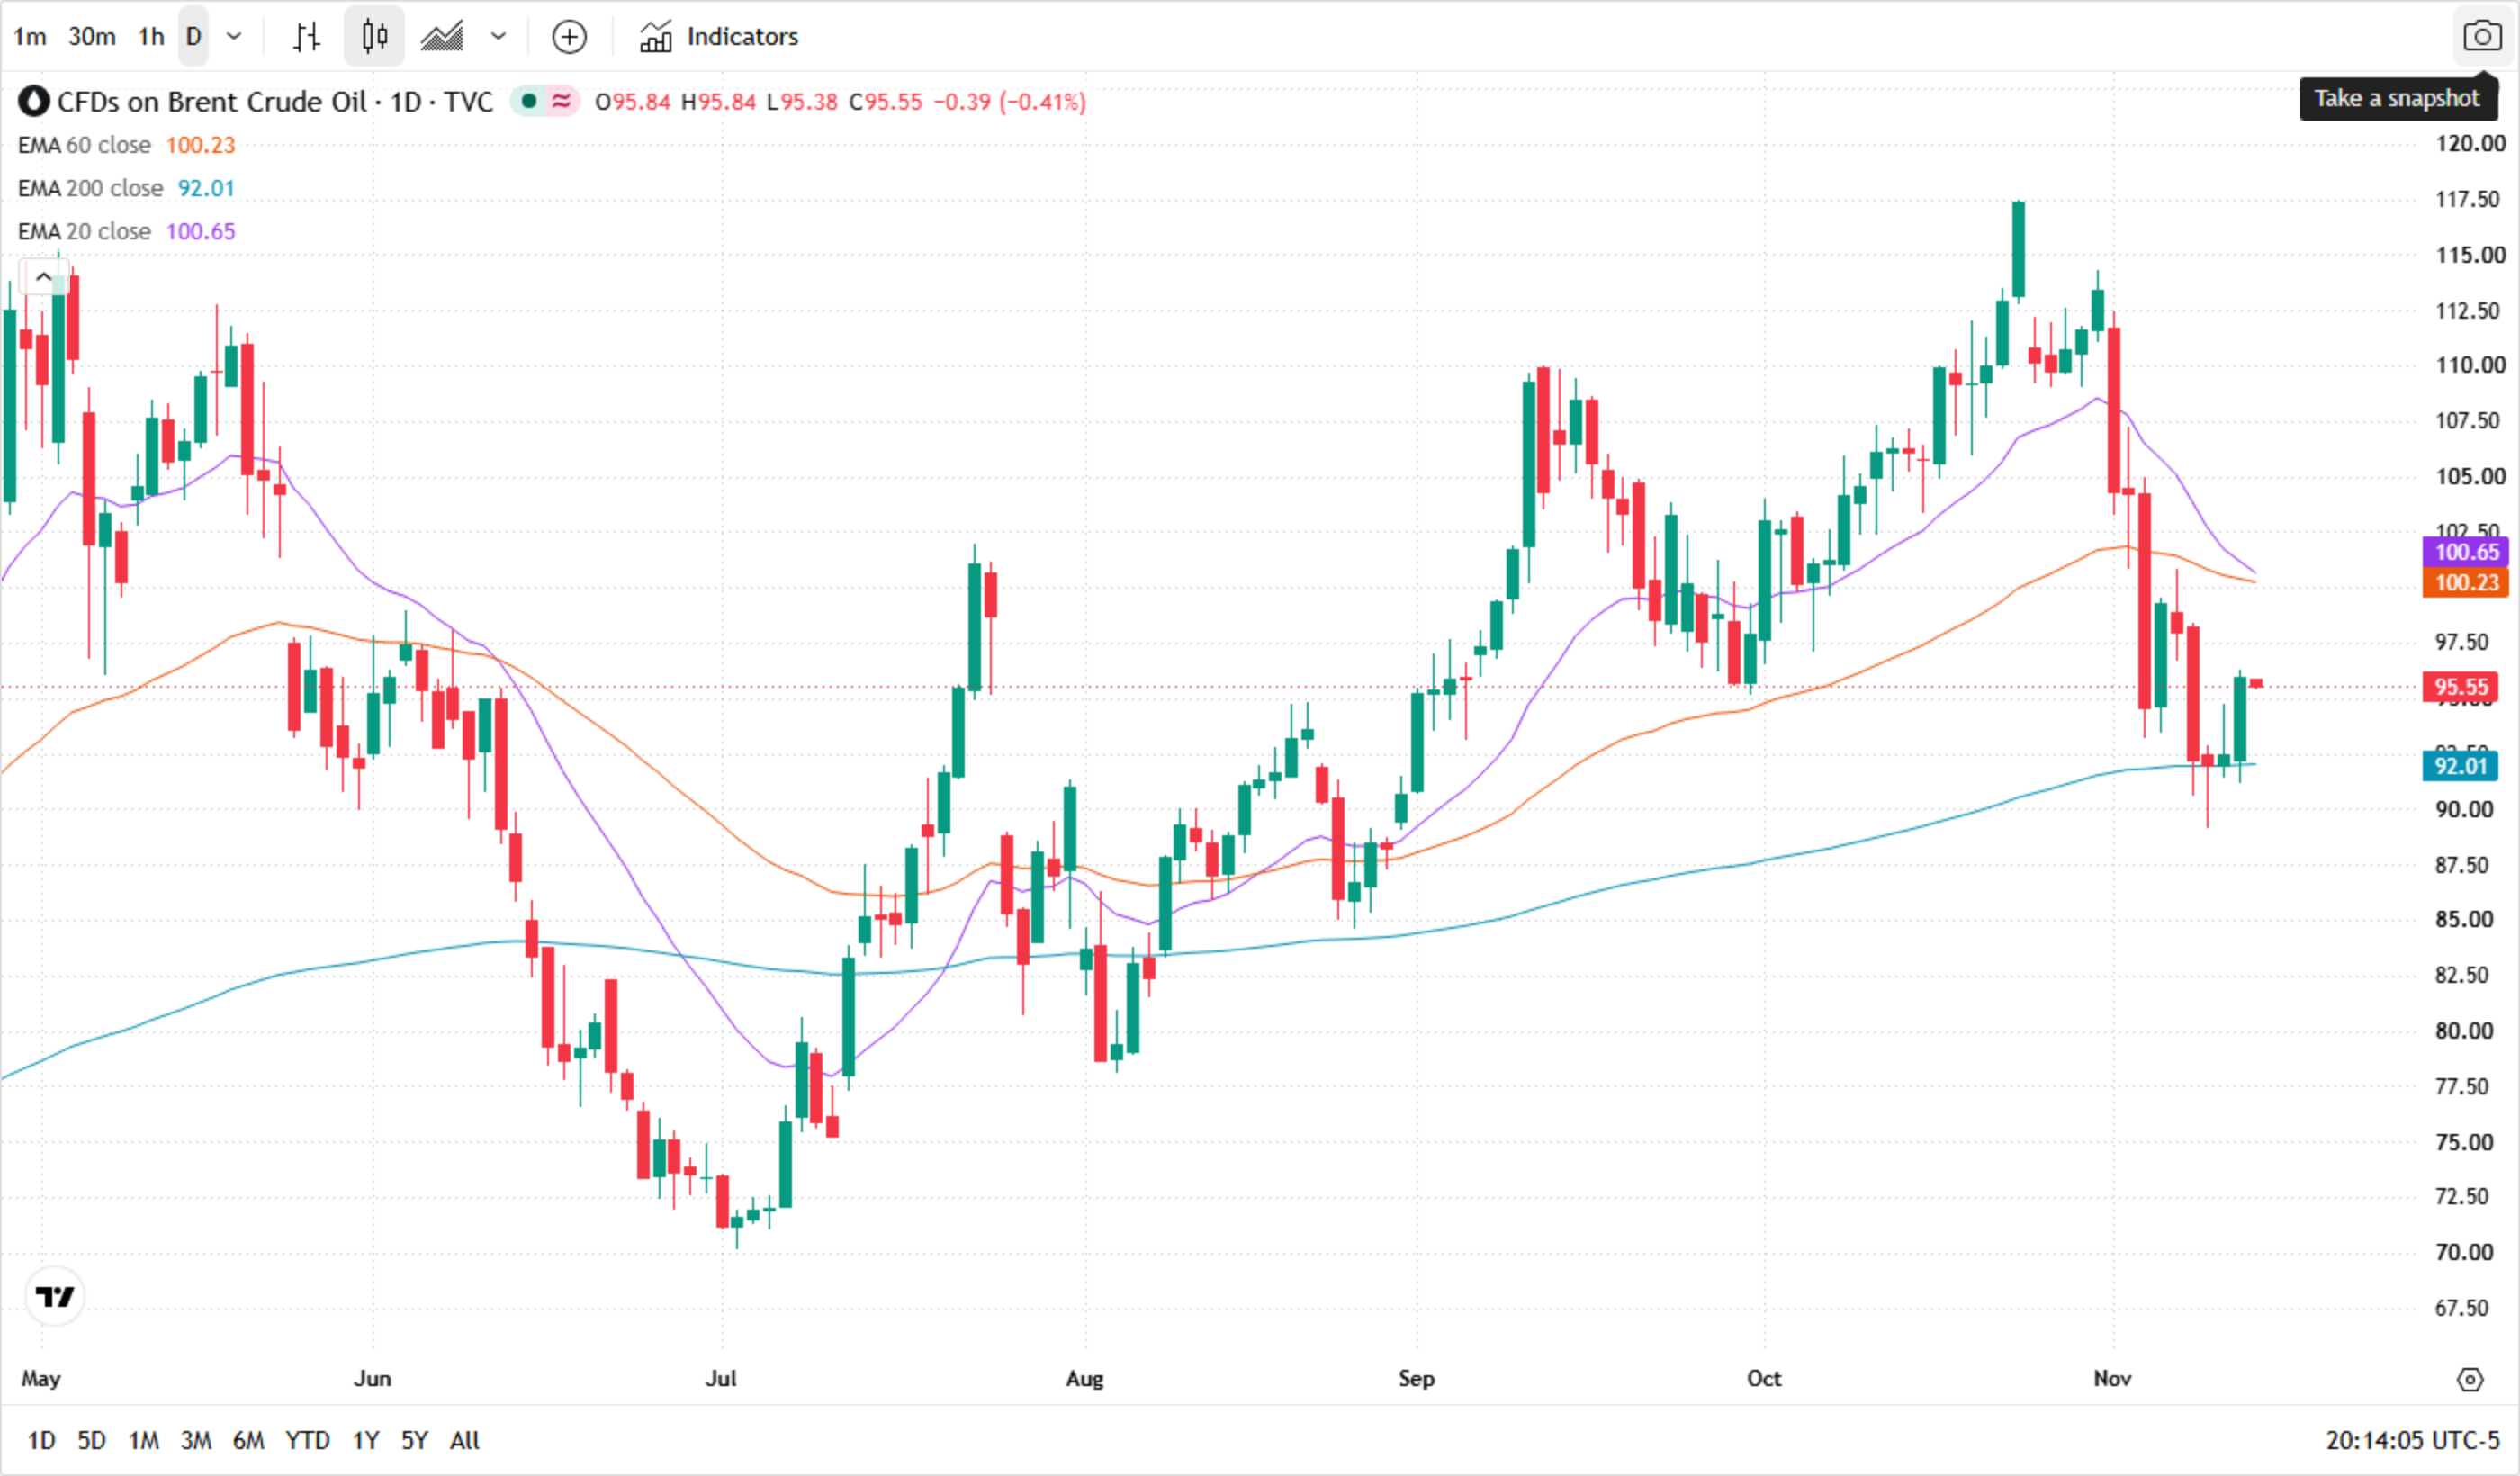
* Chart source: TradingView (CFD on Brent Crude Oil, 1D, TVC)
Read the three averages before reading the headline. Brent at 95.55 is below both the 20-day (100.65) and the 60-day (100.23), and above the 200-day (92.01). That is the geometry of a bounce inside a downtrend, not the start of a new one — the same shape the chart has held since the November 6 high near 117. The 92.01 line is the level that decides whether this week's 3.3% is a repricing or a retracement.
How 91.49 became 95.82 in three sessions
Brent bottomed at 91.49 on November 10, its lowest close since the middle of September. The bounce began with shipping. Attacks on commercial vessels in the Strait of Hormuz and the Gulf of Oman continued through the week, with Verisk Maplecroft counting 36 confirmed attacks in October, the highest monthly tally since the conflict began. Houthi strikes on Saudi Arabia's East-West pipeline and the Yanbu facilities on the Red Sea added a second, separate route to the risk map.
Then on Wednesday the diplomatic channel closed rather than opened. The US signalled it would not pursue a near-term deal with Iran and redirected the negotiating track toward domestic priorities. Oil priced that as a longer disruption window, not a wider one — the risk premium re-entered the front of the curve, not the back.
| Metric | Latest | Prior | Note |
|---|---|---|---|
| Brent (Jan) | $95.82 | $92.76 | +3.3%, highest since Nov 6 |
| WTI (Dec) | $88.74 | $86.53 | +2.55% |
| US crude inventories | +4.657m bbl | -1.1m expected | First build in six weeks |
| US gasoline inventories | +1.799m bbl | — | Build alongside crude |
| OPEC output (Oct) | 27.16m b/d | +1.96m m/m | Feb pre-war level: 28.63m |
| Saudi output (Oct) | 10.56m b/d | 8.37m (Sep) | +26% in one month |
The 4.66 million barrels nobody priced
The EIA reported a 4.657 million barrel build in commercial crude stocks against a consensus of a 1.1 million draw. Gasoline rose 1.799 million barrels in the same week. That combination matters: crude built because imports arrived, and gasoline built because the barrels that were refined did not clear at the pump.
This is the part of the move that is fragile. A pure geopolitical rally can survive a build for a week or two — the market is buying optionality, not barrels. But a rally that keeps going while inventories build and while refined product is backing up is a rally running on positioning, not on the physical balance. The two can coexist, but they cannot both be right for long.
Saudi added 2.2 million barrels a day in a month
OPEC output rebounded 1.96 million barrels a day to 27.16 million in October, according to the group's own monthly report. Saudi Arabia did most of it, going from 8.37 million in September to 10.56 million — a 26% jump in a single month, and within reach of the 28.63 million the group produced in February before the war.
Note the word "workarounds". ANZ's read is that the recovery is running through rerouted logistics and spare capacity rather than through secure shipping lanes, which means the supply is back on paper before it is back in practice. That is exactly the gap a geopolitical premium lives in.
What would confirm each side
The bull case rests on the attack count and the closed diplomatic channel. Thirty-six vessel attacks in a month is not a stable operating environment, and insurance and rerouting costs are real barrels of friction. If the disruption persists into December, the inventory builds get absorbed and the premium has a physical anchor.
The bear case rests on the arithmetic above and on the chart: price is still 1.5% below its 20-day average and only 3.9% above the 200-day at 92.01. supply up 1.96 million barrels a day, crude and gasoline both building, and a second weekly decline in price despite the headlines. Premiums that are not backed by lost barrels tend to fade once the headlines stop escalating.
The single number that separates them is not the price — it is the next two EIA prints. One more build of this size with Brent above $95 means the market is paying for risk it is not actually experiencing. A draw, and the bull case gets its missing piece.
Read more
Before making any trading decisions, it is important to equip yourself with sufficient fundamental knowledge, have a comprehensive understanding of market trends, be aware of risks and hidden costs, carefully consider investment targets, level of experience, risk appetite, and seek professional advice if necessary.
Furthermore, the content of this article is solely the author's personal opinion and does not necessarily constitute investment advice. The content of this article is for reference purposes only, and readers should not use this article as a basis for any investment decisions.
Investors should not rely on this information as a substitute for independent judgment or make decisions solely based on this information. It does not constitute any trading activity and does not guarantee any profits in trading.
If you have any inquiries regarding the data, information, or content related to Mitrade in this article, please contact us via email: insights@mitrade.com. The Mitrade team will carefully review the content to continue improving the quality of the article.


