

XRP Plunges Over 40% This Year as Price Nears $1 Mark: Is It Worth Buying Now?

Source Tradingkey

XRP 2026 Price Trend

TradingKey - In 2026, Ripple (XRP) experienced dramatic volatility in its overall price trend, characterized by an early-year surge and retreat, mid-year oscillations, and late-year blows from macroeconomic headwinds, falling more than 40% during the year and currently nearing the psychological $1 mark. From January to August, XRP initially continued the previous year's recovery, surging to an intra-year high of $2.41 early in the year before steadily weakening amid volatility, breaking below the key $1 mark in mid-August to hit a low of $0.98, setting a fresh low since November 2024.
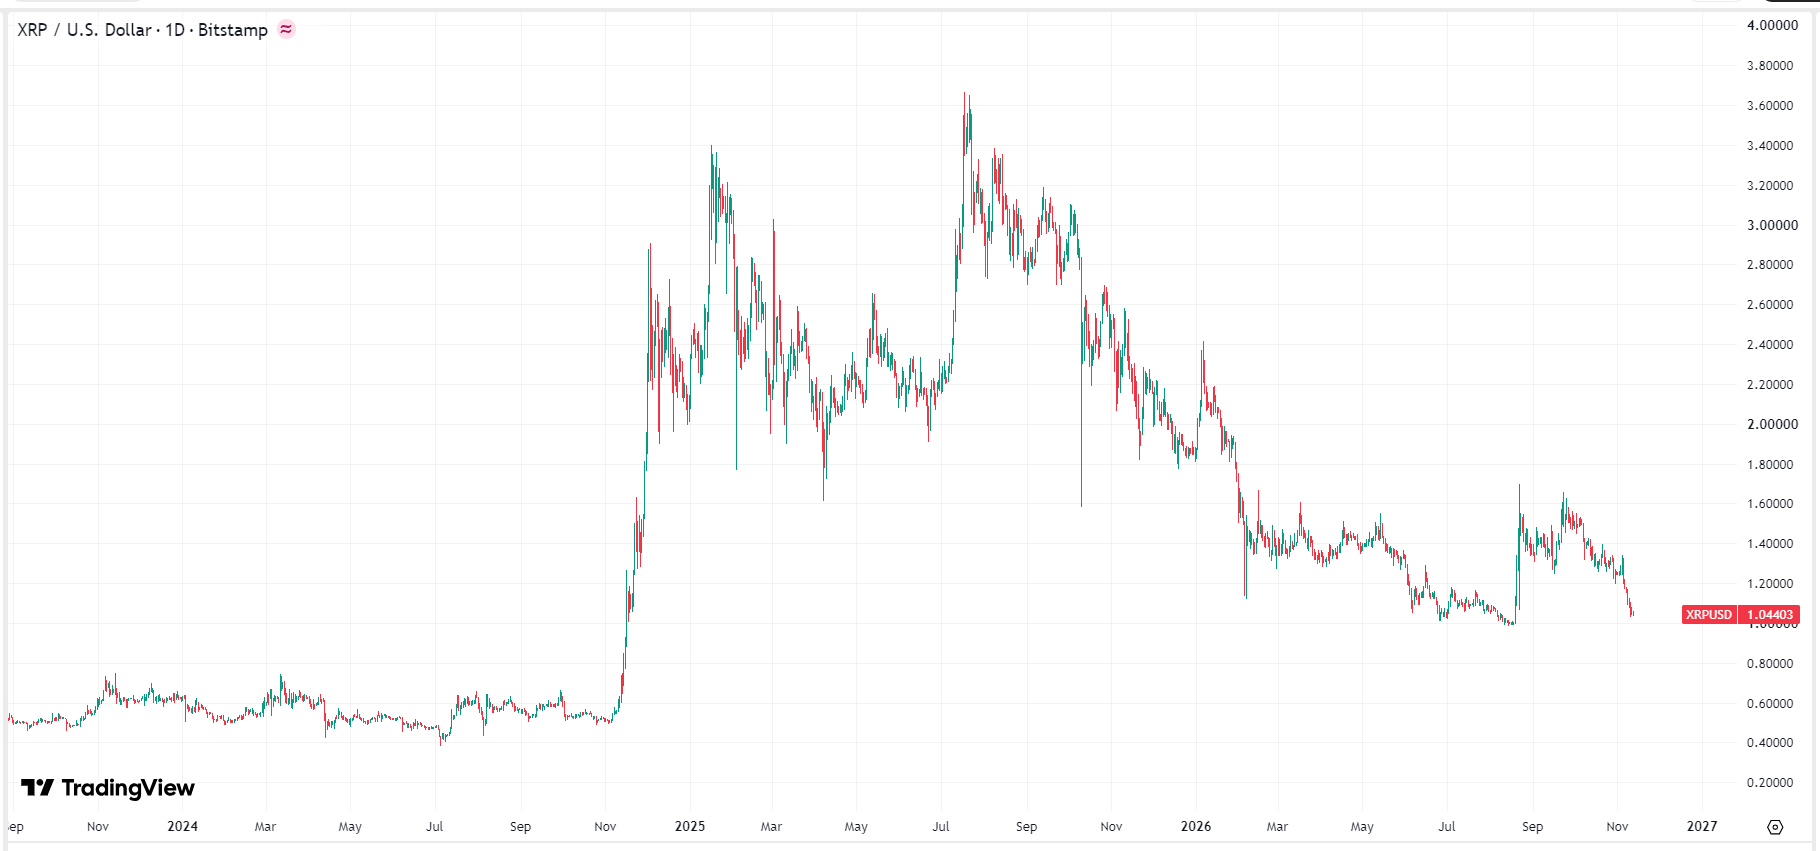
xrp-price-cace9821fcb84bca9be9272b41e851afRipple price chart, Source: TradingView

In mid-to-late August, XRP staged a bottoming rebound, surging approximately 70% in just one week to around $1.70. Following a brief downward correction, XRP mounted another rally in late September to reach $1.65, but ultimately failed to break above its previous high and subsequently drifted steadily lower. Currently, the price of XRP is hovering near $1.

Why Is XRP Price Falling?

XRP experienced a significant decline in 2026, driven not by a single factor, but rather by the combined impact of macroeconomic monetary tightening, regulatory and legislative setbacks, and XRP's own fundamentals.

Ripple Labs unlocks a fixed amount of approximately 1 billion XRP into the circulating market each month. In the absence of strong retail and institutional buying to absorb this volume, it exerts persistent supply overhang pressure on secondary market prices. In addition, the gap between enterprise partnerships and actual token demand makes it difficult for positive partnership developments to translate 100% into spot buying demand for XRP.

Although Ripple established a regulatory compliance foundation after concluding its protracted lawsuit with the SEC, the U.S. Congressional Clarity Act, on which the market had pinned high hopes, suffered setbacks in the Senate. Following the November 2026 U.S. midterm elections in which Democrats gained control of both chambers of Congress, lawmakers are set to launch rigorous investigations into the nexus of political, business, and crypto interests, exacerbating institutional investors' wait-and-see stance regarding crypto asset compliance.

The latest U.S. October CPI data broadly exceeded market expectations, highlighting strong inflation stickiness. Rising inflation prompted hawkish remarks from several Federal Reserve officials, including Christopher Waller and Lorie Logan, who even advocated resuming rate hikes in December or keeping interest rates elevated. The U.S. 2-year Treasury yield surged to around 4.69%, significantly tightening global market liquidity and directly weighing on high-beta virtual assets, including XRP.

Is XRP Worth Buying Now?

From a fundamental perspective, Ripple's core technology centers on enhancing cross-border settlement efficiency among global financial institutions. Its strategic footprint in institutional-grade digital asset settlement and central bank digital currency (CBDC) technology continues to provide a solid foundation for real-world adoption. In addition, the steady expansion of its USD stablecoin, RLUSD, within the ecosystem unlocks further growth potential for on-chain activity and transaction fee revenue.

From technical and psychological standpoints, $1 is a critical round-number threshold defended by bulls, and with the price down over 70% from its 2025 peak of $3.60, valuations have returned to historical norms. Therefore, for long-term value investors who remain constructive on the multi-year crypto cycle and build positions in tranches on the left side of the trend, the risk-reward profile here is significantly more attractive than at prior highs. However, the market may face near-term risks, such as tightening macroeconomic liquidity, a hawkish pivot by the Federal Reserve, and political and regulatory uncertainties. These factors could drive XRP to retest this year's low of $0.90 or even slide toward the major bottom of the previous bear market near $0.50.

Disclaimer: For information purposes only. Past performance is not indicative of future results.
placeholder
Gold Price Analysis Today | Forex Gold Analysis | XAU/USD Analysis - November 11, 2026Get the latest gold price analysis, forex gold insights, and XAU/USD analysis for November 11, 2026. Read on for the details.
Author  Mitrade
Nov 11, Wed
Get the latest gold price analysis, forex gold insights, and XAU/USD analysis for November 11, 2026. Read on for the details.
placeholder
Bitcoin lost its 200-day average — but the exit started three sessions before the CPIBitcoin fell 2.5% to about $73,400 on 11 November, an 11-week low, breaking its 200-day moving average near $73,100. The 24-hour liquidation tally reached $632 to $705 million, roughly 82% of it longs. But spot ETF outflows began three sessions earlier and USDT's market cap has shrunk $6.6 billion in 60 days — the leveraged length left before the inflation print did. A double top at 81,890 and 81,080 leaves a measured target of 69,366.
Author  Suzie
Nov 11, Wed
Bitcoin fell 2.5% to about $73,400 on 11 November, an 11-week low, breaking its 200-day moving average near $73,100. The 24-hour liquidation tally reached $632 to $705 million, roughly 82% of it longs. But spot ETF outflows began three sessions earlier and USDT's market cap has shrunk $6.6 billion in 60 days — the leveraged length left before the inflation print did. A double top at 81,890 and 81,080 leaves a measured target of 69,366.
placeholder
Nvidia slid 7.7% after hours while AMD and Broadcom rose — the AI trade changed hands, it didn't breakNvidia closed Wednesday at 173.73, up 2.87%, then fell as much as 8.1% to 159.44 after reports that its board was preparing for a possible leadership change. The same session, the Philadelphia Semiconductor Index rose 5.7% with all 30 components higher, CoreWeave jumped 24.7% on 168% revenue growth, and Micron added 11.9%. If AI demand were being repriced, AMD and Broadcom would not be bid. This is a governance discount on one name, and 204.54 — the 200-day average — is the level that settles it.
Author  Irene Q.
Nov 12, Thu
Nvidia closed Wednesday at 173.73, up 2.87%, then fell as much as 8.1% to 159.44 after reports that its board was preparing for a possible leadership change. The same session, the Philadelphia Semiconductor Index rose 5.7% with all 30 components higher, CoreWeave jumped 24.7% on 168% revenue growth, and Micron added 11.9%. If AI demand were being repriced, AMD and Broadcom would not be bid. This is a governance discount on one name, and 204.54 — the 200-day average — is the level that settles it.
placeholder
Gold hit a one-year low while central banks bought 321 tonnes — the sellers were never the ones you thinkSpot gold closed at 3,876 on Thursday, down 2.8% and its lowest close in more than a year, with an intraday low near 3,852. The dollar is at a 19-month high of 103.21 and the 10-year yield is at 5.10%, so the price move is easy to explain. What is harder to explain is who sold: central banks bought 321 tonnes in Q3, the PBoC added for a 24th straight month, ETF holdings are near a record 4,256 tonnes, and roughly 95% of the futures selling came from non-reportable and sovereign-type accounts rather than hedge funds. This piece separates the two books that have to balance.
Author  Irene Q.
Nov 13, Fri
Spot gold closed at 3,876 on Thursday, down 2.8% and its lowest close in more than a year, with an intraday low near 3,852. The dollar is at a 19-month high of 103.21 and the 10-year yield is at 5.10%, so the price move is easy to explain. What is harder to explain is who sold: central banks bought 321 tonnes in Q3, the PBoC added for a 24th straight month, ETF holdings are near a record 4,256 tonnes, and roughly 95% of the futures selling came from non-reportable and sovereign-type accounts rather than hedge funds. This piece separates the two books that have to balance.
placeholder
Brent rose 3.3% and US crude stocks built 4.66 million barrels in the same weekBrent January settled at 95.82, up 3.3%, and WTI at 88.74, up 2.55%, after the US signalled it would not pursue a deal with Iran and attacks on Gulf shipping continued. In the same week, EIA data showed US crude inventories rising 4.657 million barrels against expectations of a 1.1 million draw, with gasoline up another 1.799 million. OPEC output also rebounded 1.96 million barrels a day to 27.16 million in October, led by Saudi Arabia at 10.56 million. This piece separates the geopolitical premium from the physical balance and lays out where each side of the trade is anchored.
Author  Irene Q.
Nov 13, Fri
Brent January settled at 95.82, up 3.3%, and WTI at 88.74, up 2.55%, after the US signalled it would not pursue a deal with Iran and attacks on Gulf shipping continued. In the same week, EIA data showed US crude inventories rising 4.657 million barrels against expectations of a 1.1 million draw, with gasoline up another 1.799 million. OPEC output also rebounded 1.96 million barrels a day to 27.16 million in October, led by Saudi Arabia at 10.56 million. This piece separates the geopolitical premium from the physical balance and lays out where each side of the trade is anchored.
goTop
quote