


SanDisk Stock Price Forecast: Down Over 40% for Seven Straight Weeks, Bulls Focus on $1,000 Level
TradingKey - As of the close on Monday (November 2) Eastern Time, SanDisk (SNDK) shares fell 6.59% to $1,075.08, touching an intraday low of $1,067.40, before recovering slightly in after-hours trading to around $1,090. Based on its current weekly performance, SanDisk's stock price has fallen for seven consecutive weeks, with a cumulative drop of over 40%.
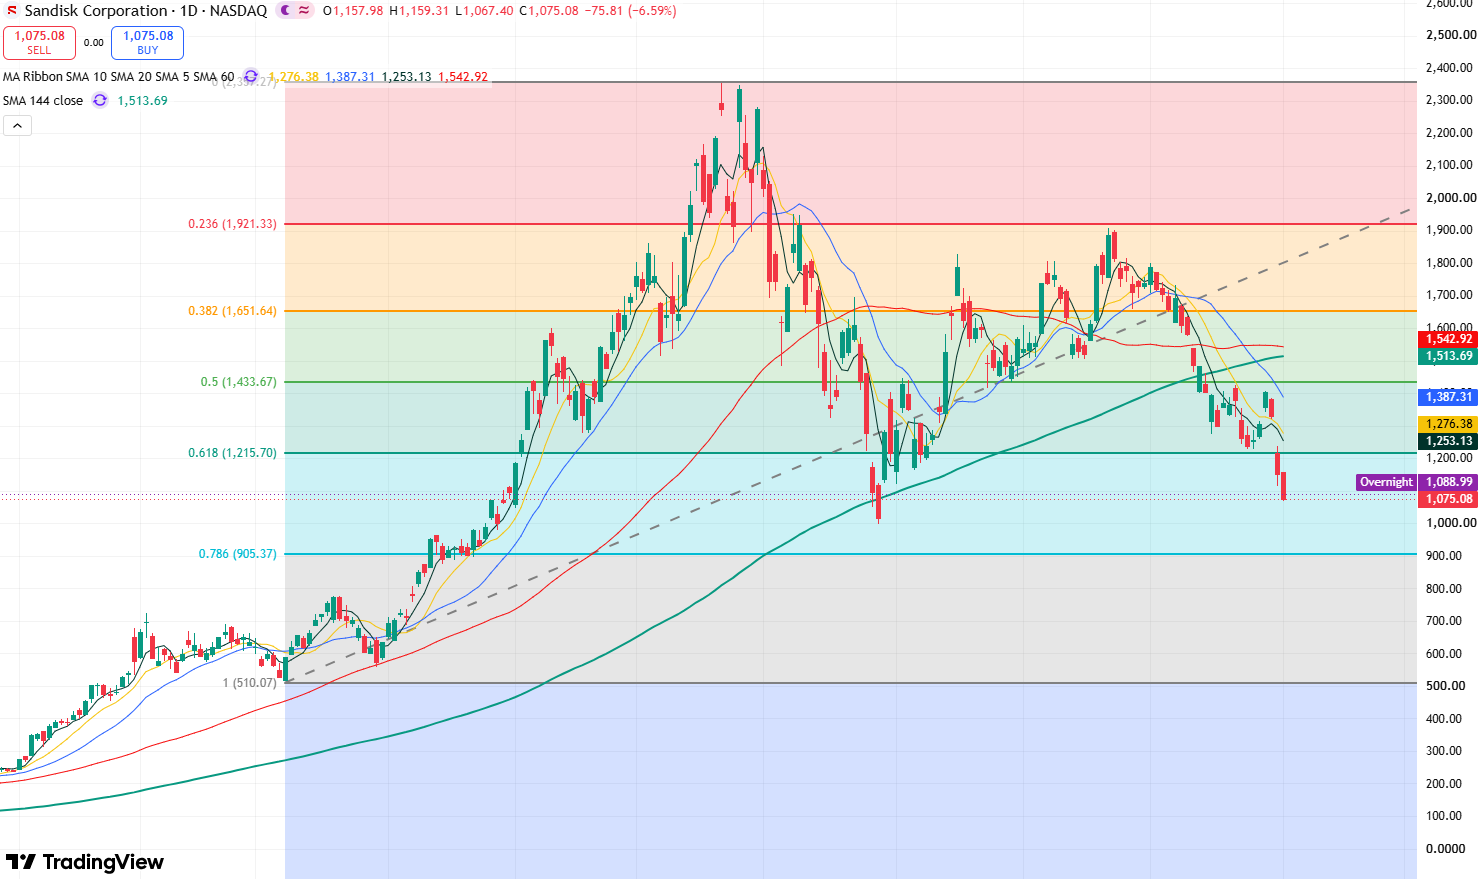
SanDisk stock daily chart, Source: TradingView
From the daily chart of SanDisk's stock price, after rebounding toward the $1,900 resistance level on September 22, the stock faced persistent selling pressure and pulled back, falling below several key moving averages, including the 5-day, 10-day, 20-day, 60-day, and 144-day lines. Furthermore, as short-term moving averages (5-day, 10-day, and 20-day) continuously crossed below the 60-day and 144-day moving averages to form a death cross pattern, bearish momentum was significantly reinforced.
In terms of technical indicators, the Relative Strength Index (RSI) is around 29.98, entering oversold territory, while the MACD remains negative. This suggests a potential demand for a short-term rebound in the stock price, though short-term downside momentum has not yet fully reversed.
Currently, the primary downside support level to watch is $1,067. If broken, the stock will further test the key support level at the $1,000 threshold, which was also the pullback low formed in July this year. If this level fails to hold, it could open the door for a deeper decline, potentially pulling back toward the $900–$750 range.
On the upside, if the stock stabilizes above the key support level at $1,000, a double-bottom structure may form on the candlestick chart. This would significantly boost short-term bullish momentum, giving the stock a chance to rebound and test the $1,200 resistance level. A successful breakout and consolidation above this level would open up further upside toward the $1,450 resistance level.
Recommended Articles


