


Gold rebounds to $3,946 off $3,870 as oil does the Fed's work — but the ETF bid is still missing

Mitrade Insights — Gold closed at $3,946/oz on Monday, up 1.84%, after Friday's 3.6% slide to a one-year low of $3,870.25. The headline explanation is safe-haven demand. The tape says something else: Brent's 7.63% one-day collapse cut December Fed hike odds from roughly 80% to 77%, pulled the 10-year Treasury yield to 4.894%, and pushed the dollar index to a one-month low of 101.784. Gold rallied because the rate trade eased, not because fear returned. The problem is that the buyers are still missing: global gold ETF holdings are shrinking, and CFTC net longs have fallen for nine consecutive weeks.
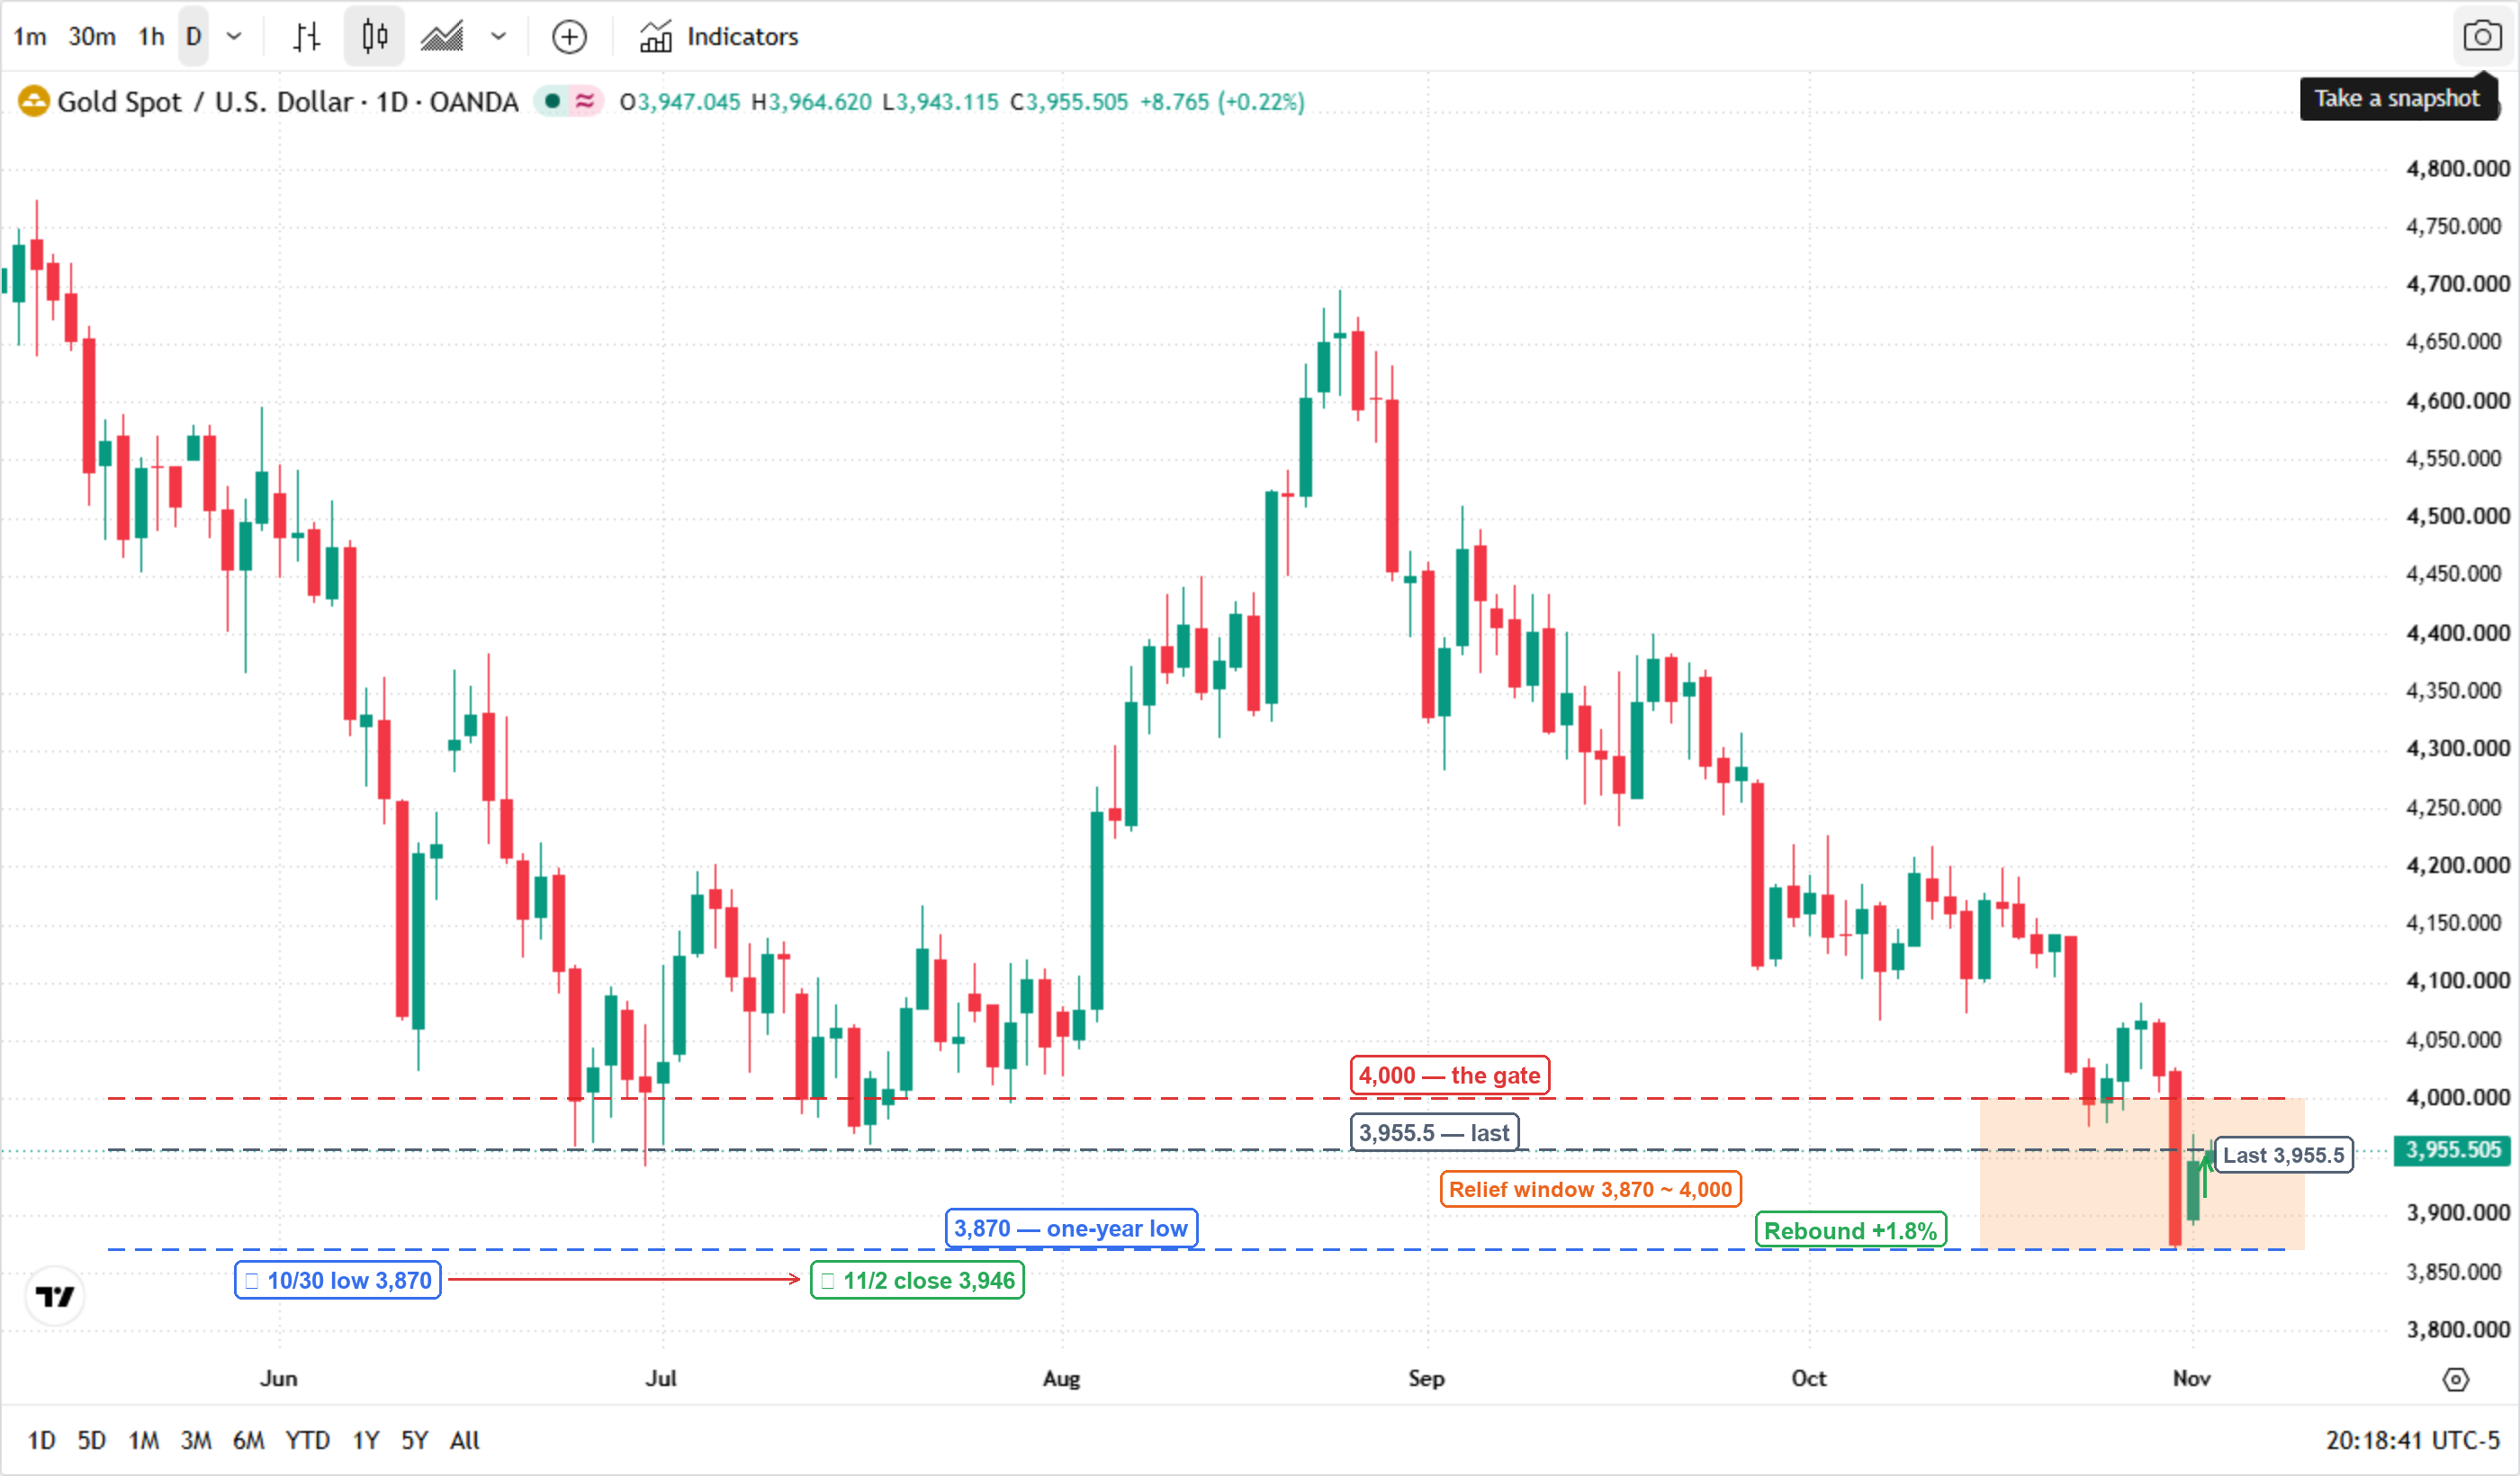
* Chart source: TradingView (XAUUSD daily), 2026-11-03.
$3,870 held because oil broke, not because fear returned
The first number is $3,870.25, Friday's low and the lowest print since October 2025. The second is $3,946, Monday's close. The third is $27, the war-risk premium that a major Wall Street desk estimates is embedded in Brent. When oil falls 7.6% in a day, that premium is the first thing sold — and the inflation impulse that justified a December hike falls with it.
The $27 premium went into reverse
When we wrote the $4,000 break on Oct 26, oil was the inflation problem. Today it is the disinflation lever — the same asset, opposite sign. Brent's move was not a demand story. OPEC+ kept its December targets unchanged, and attacks on Gulf shipping have not stopped. The selloff was triggered by signs that Washington and Tehran are open to a diplomatic end to the eight-month conflict, including an Iranian proposal to reopen the Strait of Hormuz within 48 hours if sanctions and naval-blockade conditions are met. With Brent at $104.77 and the ex-premium estimate near $86, the market has only sold part of the war premium — roughly $18.8 is still in the price.
The transmission is mechanical. Lower oil → lower near-term inflation expectations → lower odds of a December hike → lower real yields → higher gold. The 10-year nominal yield fell from 4.99% to 4.894%; the dollar index slipped to 101.784; December hike odds fell to 77%. If the talks stall and Brent snaps back above $110, the same chain runs in reverse, and gold gives back the bounce.
Who actually bought: ETF flows versus futures positioning
This is where the rally gets uncomfortable. The World Gold Council's Q3 data showed a record $31 billion of inflows into physically backed gold ETFs, with holdings at an all-time high of about 4,256 tonnes. But October marked the first outflow weeks since July: about 6.8 tonnes left in the week from Oct 19, and GLD reportedly lost $2.3 billion over five days.
The ETF hole is still open
ETF buyers are the sticky, price-insensitive bid. They are not buying this bounce. The Q3 inflow was built when gold was above $4,100; the October outflow started as price broke $4,000. A rebound that does not bring ETF flows back is a rebound built on futures, not allocation.
CFTC data for the week to Oct 27 showed managed-money net longs at 107,404 contracts, down for a ninth straight week from roughly 210,000 in early October. Gross shorts rose by 1,157 to 16,948 contracts. That combination — falling longs, rising shorts — is the signature of a market that is de-risking, not accumulating. Monday's bounce looks more like short covering than fresh conviction.
| Positioning gauge | Latest | Direction | Read-through |
|---|---|---|---|
| Global gold ETF holdings | ~4,256 t (Q3 peak) | October outflows | Sticky bid absent |
| CFTC managed-money net long | 107,404 (Oct 27) | 9th weekly decline | Deleveraging |
| CFTC gross shorts | 16,948 | +1,157 w/w | Hedges added |
| December hike odds | 77% | Down from ~80% | Rate relief |
$4,000 is the gate; $3,870 is the falsifier
The chart is clean. Gold bounced from $3,870, but it is still below the $4,000 line that flipped from support to resistance. The first resistance is $3,970 (Monday's high), then $4,000; a close above $4,000 would neutralize the short-term bear case. On the downside, $3,900 and $3,870 are the levels to watch; Goldman Sachs flags $3,850 as the next important support while keeping a long-term target of $5,400 for end-2027.
What would prove the bounce wrong
My view is that this is a short-covering bounce inside a correction, not the start of a new leg higher. The falsifier is simple: if gold closes back below $3,870 and ETF outflows resume, the bounce has failed. If instead gold reclaims $4,000 and ETF holdings turn positive for two consecutive weeks, the "no new money" thesis is wrong, and the market is rebuilding a real bid. Until one of those happens, the rally is a rate trade with a 48-hour deadline.
Read more
* The content presented above, whether from a third party or not, is considered as general advice only. This article should not be construed as containing investment advice, investment recommendations, an offer of or solicitation for any transactions in financial instruments.


