


Gold Price Analysis Today | Forex Gold Analysis | XAU/USD Analysis - November 3, 2026


Today's Gold Price
Gold price chart for today
*0% Commission and Low Spreads 0️⃣
*$50,000 in Free Virtual Funds 💰
*$100 New Customer Bonus 🎁
Gold (XAU/USD) recovered to $3,948.48 this morning (November 3, 2026), after rebounding from an annual low near $3,870 overnight. The move was supported by a 7.6% plunge in Brent crude below $105 on news of U.S.-Iran talks, which eased inflation concerns and pulled the 10-year Treasury yield down to 4.90%. However, stronger-than-expected ISM manufacturing data remain a headwind. Today, watch whether price can reclaim resistance at $3,971-$3,982.
Today's Key Points
| Key Takeaways |
|
|
|
Brent Crude Tumbles More Than 7% on Signs of U.S.-Iran Talks, Easing Inflation Concerns and Helping Gold Rebound From Its Annual Low
Gold climbed to $3,945, benefiting from a steep slide in crude prices. Brent fell 7.6% to close at $104.77, while WTI tumbled 7.4% to $96.46, after Trump and Iran signaled openness to diplomatic talks in the Strait of Hormuz. Investors sold oil contracts to reduce the war-risk premium that had built up throughout October.
The sharp decline in oil prices eased concerns over energy inflation and helped pull the 10-year Treasury yield back to 4.90%, prompting bargain buying in gold. However, markets remain wary of uncertainty because no formal agreement has been reached ahead of the U.S. midterm elections.
U.S. ISM Manufacturing Beats Expectations, With Markets Pricing in as Much as a 75% Chance of a December Fed Rate Hike
The U.S. manufacturing PMI rose to 55.5 in October, above expectations of 54.7, marking a tenth straight month of expansion. The output component reached 59.0, while the prices-paid component remained elevated at 75.2, underscoring continued U.S. economic expansion after third-quarter GDP grew a strong 3.4%.
Strong economic data have led markets to price in as much as a 75% probability of a December Fed rate hike. The prospect of higher rates for longer remains a key headwind for gold. This week, markets will watch JOLTS job-openings data and the NFP report later in the week.
Pepperstone Says Gold Is Recovering After Breaking to an Annual Low, but Warns It Must Reclaim $4,000 to Reverse the Downtrend
Dilin Wu, a strategist at Pepperstone, said gold began attracting speculative buying after reaching an annual low of $3,870 amid forced liquidation in equities. Although the price rebounded above $3,940, the technical structure has been severely damaged by breaks below support at $4,000 and $3,900.
Analysts believe gold must reclaim and hold above the psychological $4,000 level before downside pressure can ease and a genuine recovery can begin. Unless it clears that level, gold remains at risk of renewed selling from a stronger dollar and liquidation selling stemming from equity-market volatility.



Technical Analysis of Gold (XAU/USD)
On the 4-hour chart, gold has staged a clear technical rebound from support at $3,885-$3,904 after the candle wick touched a low near $3,870. Liquidity absorption then pushed the price toward $3,948, but the broader structure remains bearish below all moving averages.
The 4-hour RSI has rebounded from deeply oversold readings around 20-22 to 42-45, indicating that selling pressure has slowed and leaving room for a rebound. However, its failure to clear 50 keeps the recovery contained until a higher-low structure emerges.
The near-term pivot is a reclaim of first resistance at $3,971-$3,982. A break above could allow a test of $4,000; failure to do so would raise the risk of a bull trap pulling price back to retest the $3,885-$3,904 base.
Holding above $3,885-$3,904 and clearing $3,971-$3,982 would open the way toward $4,074-$4,083 and $4,104-$4,115. However, a break below $3,885 would risk a slide to the next support zones at $3,829-$3,849 and $3,780-$3,800, respectively.
Today's Gold Price Outlook
| Scenarios |
|
|
|
Today's Trading Strategy
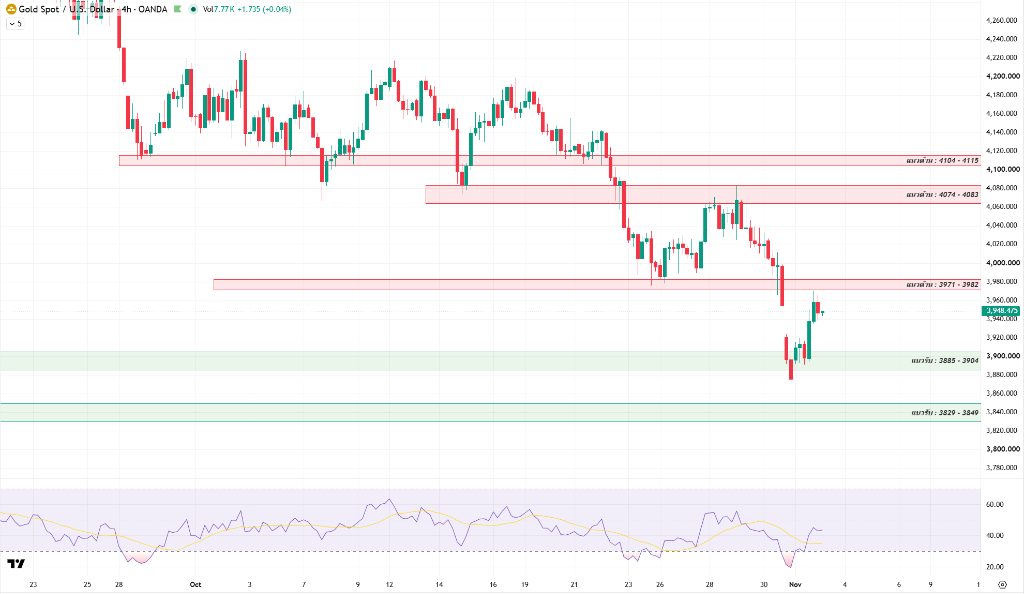
Short-term traders should trade the range cautiously, monitoring reactions around support at $3,885-$3,904 and resistance at $3,971-$3,982. Avoid chasing purchases before the first resistance is cleared, and always use a stop loss.
- Buy setup: Wait for price to pull back and test support at $3,885-$3,904 with clear buying support, or follow a breakout above $3,982. The profit target is around $4,074-$4,083, with a stop loss below $3,875.
- Sell setup: Consider opening a short position when price rebounds to test resistance at $3,971-$3,982 or $4,074-$4,083 and is rejected, or follow a break below $3,885. Target $3,829-$3,849, with a stop loss above resistance.
For long-term investors, while falling oil prices have eased pressure, volatility from the midterm elections and the interest-rate outlook remains high. Manage risk and wait for a clear price base to form before accumulating positions.
Daily Support and Resistance Levels
| Type | Price Level |
| Support #1 | $3,885-$3,904 |
| Support #2 | $3,829-$3,849 |
| Support #3 | $3,780-$3,800 |
| Resistance #1 | $3,971-$3,982 |
| Resistance #2 | $4,074-$4,083 |
| Resistance #3 | $4,104-$4,115 |
Today's Questions (FAQ)
Why did the more than 7% plunge in oil prices help support a rebound in gold?
The fall in oil prices reduced concerns about energy inflation, pulling the 10-year Treasury yield down to 4.90%. That lowered gold's opportunity cost and opened the way for speculative buying in precious metals after heavy selling the previous week.
Why do experts warn that gold must reclaim $4,000 before a genuine recovery can begin?
The $4,000 level is both psychological resistance and a key trend threshold. If price cannot regain and hold above $4,000, the rally is still only a short-term rebound that remains vulnerable to profit-taking at any time.
Read more
The above content was completed with the assistance of AI and has been reviewed by an editor.


