


Bloom Energy Trades at 140 Times Earnings. Here's the Growth Rate It Needs to Justify That.
Key Points
Prior to third-quarter 2026 earnings, Bloom Energy's trailing P/E ratio was over 350x.
After third-quarter earnings, the trailing P/E ratio dropped to around 140x.
If you annualize third-quarter earnings, the P/E would be 60.
- Motley Fool Issues Rare "Total Conviction" Buy Alert ›
The artificial intelligence (AI) spending spree among giant technology companies has changed the trajectory of Bloom Energy's (NYSE: BE) business. With sales of its hydrogen fuel cells booming, the company's earnings are starting to catch up to its lofty stock price. In fact, if the company's earnings doubled, its price-to-earnings ratio would be in line with the technology sector average of around 32x.
Given recent financial performance, doubling earnings is a very real possibility. But there's another way for Bloom Energy's P/E to fall from its current 140x, as of this writing, to 30x. Here's what you need to know.
Missed AI’s "Act 1"? Act 2 Could Be 15x Bigger. Most investors think they missed the AI boat because they didn't buy Nvidia in 2005. But according to our analysts, we’re only at the end of "Act 1"—the R&D phase. "Act 2" is the global rollout. Continue »

Image source: Getty Images.
Bloom Energy's P/E plunges after earnings
If you chart Bloom Energy's P/E ratio, it plunged in October. There were two pieces to that drop. First, the stock price declined. And then the company reported third-quarter earnings. Both played a major role in the trailing P/E going from over 350x to roughly 140x.
The most exciting part of the story, however, is earnings. In the third quarter, the company's revenues rose 138% year over year. The biggest driver was the 179% increase in revenues from the sale of fuel cells. The company's fuel cells can provide off-grid power, allowing artificial intelligence data centers to bypass the local utility and come online more quickly. The huge sales increase pushed adjusted quarterly earnings to $0.94 per share, up $0.78 from a year earlier.
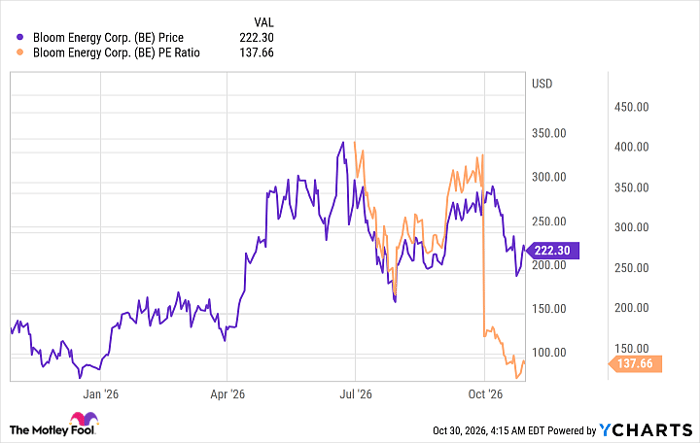
BE data by YCharts
That's a big change for trailing 12-month earnings, since a smaller adjusted profit dropped off and a much larger profit was added. But there's another important story here: the company's adjusted earnings have increased from $0.45 per share four quarters ago to $0.94 per share, more than a 100% increase over the past 12 months.
How much more growth is needed to justify Bloom's P/E?
The interesting thing is that Bloom Energy simply sustaining its third-quarter earnings would reduce the P/E ratio to 60x. That's still an expensive price tag, but far more reasonable than the 350x P/E not too long ago. And if earnings double again, the P/E would drop to 30x, which is actually a touch lower than the average technology stock. If earnings continue to grow at the current rate, Bloom Energy will justify its P/E ratio.
But there's a small wrinkle here, and it goes back to the P/E graph above. Bloom Energy's P/E ratio would also decline if the stock price dropped, as it did at the start of October. So if earnings remained the same, but the stock price was cut in half, the P/E would also fall to 30x. The P/E ratio has two components, and each one plays an important role.
Will Bloom Energy's earnings rise or will its stock fall?
The fact is, Bloom Energy has been caught up in the AI trade, which many fear has turned into a bubble. Investors are increasingly scrutinizing tech stocks and their AI spending, leading to big declines in some stocks. So the P/E falling to a more reasonable level could quite possibly result from continued strong earnings and a share price decline.
While Bloom Energy's product, which allows AI companies to bypass utilities, is likely to remain a key selling point, the stock also remains a high-risk investment. Earnings could continue to rise, perhaps even doubling over the next year or two. That would justify today's current share price. But if the enthusiasm for the AI trade wears thin, the P/E could just as easily fall in a less desirable way.
Should you buy stock in Bloom Energy right now?
Before you buy stock in Bloom Energy, consider this:
The Motley Fool Stock Advisor analyst team just identified what they believe are the 10 best stocks for investors to buy now… and Bloom Energy wasn’t one of them. The 10 stocks that made the cut could produce monster returns in the coming years.
Consider when Netflix made this list on December 17, 2004... if you invested $1,000 at the time of our recommendation, you’d have $334,793!* Or when Nvidia made this list on April 15, 2005... if you invested $1,000 at the time of our recommendation, you’d have $1,257,420!*
Now, it’s worth noting Stock Advisor’s total average return is 874% — a market-crushing outperformance compared to 209% for the S&P 500. Don't miss the latest top 10 list, available with Stock Advisor, and join an investing community built by individual investors for individual investors.
See the 10 stocks »
*Stock Advisor returns as of October 31, 2026.
Reuben Gregg Brewer has no position in any of the stocks mentioned. The Motley Fool has positions in and recommends Bloom Energy. The Motley Fool has a disclosure policy.
Recommended Articles


