


If a Recession Is Coming, History Says Utilities Aren't Safe, Just "Less Bad." Here's the Data.
Key Points
Funds like the State Street Utilities Select Sector SPDR ETF provide some recession buffering.
However, that protection is a matter of perspective -- It’s usually a case of “less bad,” not “great.”
- 10 stocks we like better than Select Sector SPDR Trust - State Street Utilities Select Sector SPDR ETF ›
Fortunately, the strict definition of a recession, or two consecutive quarters of negative GDP growth, hasn't been met this year, but smart investors prepare for the worst. Preparation against economic slumps often involves embracing defensive sectors, including utilities.
Utilities join consumer staples and healthcare as traditional defensive sectors, on the basis that no matter how bad the economy gets, people will keep the lights on, continue eating, and tend to their medical needs.
Missed Nvidia in 2009? This Rare Signal Is Flashing Again. In 2009, a "Double Down" signal flashed for a little-known chipmaker called Nvidia. For the first time in years, that same "Total Conviction" signal is flashing for a company 1/100th the size of Nvidia. Continue »
Utilities stocks don't deliver big gains during recessions. Image source: Getty Images.
Still, market participants need to maintain perspective when flocking to defensive stocks for bear-market or recession protection. That's true of utilities equities, too.
Let's use the State Street Utilities Select Sector SPDR ETF (NYSEMKT: XLU) as the measuring stick. This exchange-traded fund (ETF) is the original dedicated utilities ETF. It turns 28 years old in December, meaning it's been around for four credible recessions: the bursting of the tech bubble (2000-02), the global financial crisis (2007-09), the 2020 economic contraction brought on by the coronavirus pandemic, and the brief "technical" recession seen in 2022.
"Less bad" is the order of the day
New investors who haven't had money on the line during bear markets or recessions should remember two things. First, outside of cash, there are no risk-free assets. Second, when opting to remain engaged with stocks during deep market pullbacks or economic calamity, don't expect big upside from defensive sectors. The most reasonable expectation is "less bad."
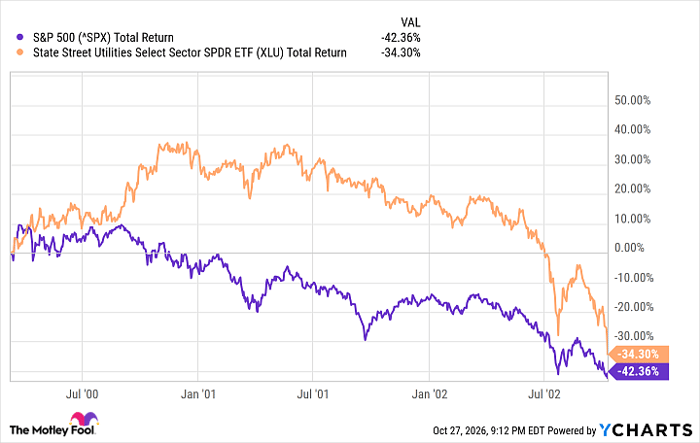
The SPDR ETF, which is home to the largest utilities companies by market value, proved as much during the tech bubble recession. The Nasdaq Composite hit a record on March 10, 2000, and then started a slide that lasted until Oct. 9, 2002. Over that time, the S&P 500 tumbled 42.4% while the bellwether utilities ETF slid 34.3%.
^SPX data by YCharts
On that basis, there's no denying that utilities stocks outperformed, but the group certainly wasn't "safe." It was merely "less bad."
The global financial crisis brought a sequel to that scenario. In 2008, the worst year of what was the worst recession in the U.S. since the Great Depression, the S&P 500 shed 36.8%, while the SPDR utilities ETF lost almost 29%. Over the duration of the crisis (Oct. 9, 2007, through March 9, 2009), the ETF lost 42.5% while the S&P 500 plunged nearly 56%. Clearly, the math is in favor of the utilities fund, but this is nothing to write home about.
More recent recessions
The COVID-19 recession was historically brief, and when stocks snapped out of their pandemic malaise, some speculative equities led the rebound and animal spirits were elevated, creating an environment in which defensive sectors lagged. As a result, the bellwether utilities ETF gained just 0.6% in 2020 while the S&P 500 rallied 18.4%.
Just two years later, it was a different ballgame. While the 2022 economic contraction was also considered brief, that brevity didn't protect the S&P 500 from an 18.2% drop. That year, the SPDR ETF held up well, gaining 1.4%. Arguably, that's a remarkable performance given utilities' status as bond proxies, making this a rate-sensitive sector. The Federal Reserve raised interest rates seven times in 2022.
So over the four recessions that have occurred since the State Street Utilities Select Sector SPDR ETF was born, the fund broadly did its job, even when giving it a "pass" on 2020 due to the nature of that equity market comeback. Investors just need to remember that if a historically bad recession comes to pass (hoping that won't happen), the likely best-case scenario for utilities stocks is performing less poorly than the broader market. That's it.
Should you buy stock in Select Sector SPDR Trust - State Street Utilities Select Sector SPDR ETF right now?
Before you buy stock in Select Sector SPDR Trust - State Street Utilities Select Sector SPDR ETF, consider this:
The Motley Fool Stock Advisor analyst team just identified what they believe are the 10 best stocks for investors to buy now… and Select Sector SPDR Trust - State Street Utilities Select Sector SPDR ETF wasn’t one of them. The 10 stocks that made the cut could produce monster returns in the coming years.
Consider when Netflix made this list on December 17, 2004... if you invested $1,000 at the time of our recommendation, you’d have $334,793!* Or when Nvidia made this list on April 15, 2005... if you invested $1,000 at the time of our recommendation, you’d have $1,257,420!*
Now, it’s worth noting Stock Advisor’s total average return is 874% — a market-crushing outperformance compared to 209% for the S&P 500. Don't miss the latest top 10 list, available with Stock Advisor, and join an investing community built by individual investors for individual investors.
See the 10 stocks »
*Stock Advisor returns as of October 31, 2026.
Todd Shriber has no position in any of the stocks mentioned. The Motley Fool has no position in any of the stocks mentioned. The Motley Fool has a disclosure policy.
Recommended Articles


