


If a Bear Market Is Coming, History Says This 1 Investing Move Can Build Life-Changing Wealth
Key Points
The S&P 500, which is meant to be representative of the U.S. economy, has a long history of growth.
Over short periods, the S&P 500 can be highly volatile.
- 10 stocks we like better than Vanguard S&P 500 ETF ›
If investing were easy, everyone would make lots of money all the time. Sadly, investing isn't easy. But history is very clear: the hardest part isn't actually picking stocks; it is controlling your own emotions. Instead of jumping in and out of the market, as far too many investors do, you should create a long-term plan and stick to it through thick and thin. Indeed, there is a bear market coming, though nobody knows when, and this one single investment move will still help you build life-changing wealth even when the bear eventually arrives.
Mercurial investors are hard to deal with
Wall Street moves from one hot investing topic to another like a grasshopper. It is mind-boggling at times how quickly an investment theme can gain traction and fall out of fashion. One of the best examples is the dot-com bubble that rose and burst at the turn of the century. It's extra important today because there's another technology bubble inflating right now with artificial intelligence (AI).
Missed AI’s "Act 1"? Act 2 Could Be 15x Bigger. Most investors think they missed the AI boat because they didn't buy Nvidia in 2005. But according to our analysts, we’re only at the end of "Act 1"—the R&D phase. "Act 2" is the global rollout. Continue »

Image source: Getty Images.
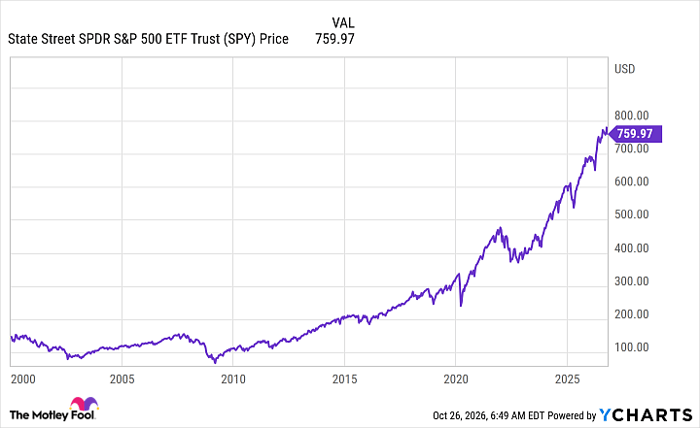
If history is any guide, AI spending will outpace the benefits the technology offers. Then investors will flee AI stocks for safer shores, even as the technology, as expected, changes the world. If you were around for the dot-com bubble, you know that the up feels great and the down can be brutal and linger for an incredibly long time. But take a look at the chart below, which starts just before the dot-com bubble finally burst.
SPY data by YCharts
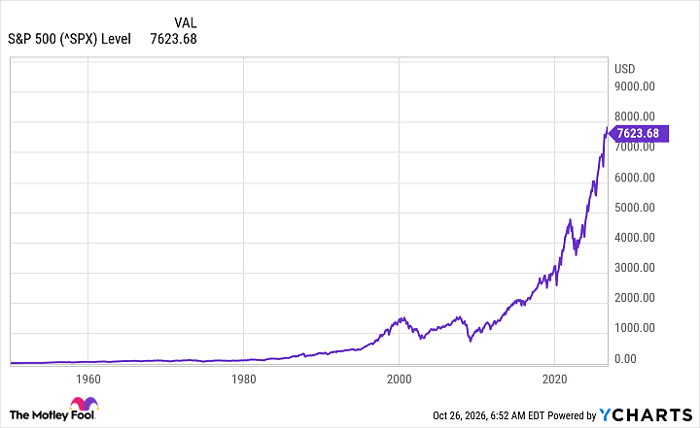
Notice that, roughly a quarter of a century later, the dot-com bear market looks like a tiny blip. The same can be said of the Great Recession, when investors were legitimately concerned that the global financial system would fail. This isn't some odd period in the market. If you go back even further, what felt like deep downturns at the time look like non-events today.
^SPX data by YCharts
If you just buy the market, using an S&P 500 index (SNPINDEX: ^GSPC) tracker such as Vanguard S&P 500 ETF (NYSEMKT: VOO) or SPDR S&P 500 Trust (NYSEMKT: SPY), you'll likely build material wealth over the long term. The S&P 500 is meant to track the U.S. economy, making it a good option for those looking to keep their investment lives simple. And, if history is any guide, you'll likely build wealth over the long term even if you start buying right before a bear market, so there's no reason to wait.
Don't stop investing, even when a bear hits
Buying and holding is a good approach, but you'll likely do even better if you add money to your S&P 500 ETF at regular intervals. That's called dollar-cost averaging, and it means you'll buy more when the market is weak (a bear) and less when it's strong (a bull). Over the long term, however, this will give you a lower cost basis, which improves your long-term return potential.
And all you need to do to achieve good long-term results is to buy an S&P 500 index and keep buying through thick and thin. Unfortunately, that's actually harder than it sounds because emotions like fear get in the way. Which is why now is the time to steel your resolve. If you do, when hard times come, you won't let fear derail you from following the vital lessons that history has taught us about investing.
Should you buy stock in Vanguard S&P 500 ETF right now?
Before you buy stock in Vanguard S&P 500 ETF, consider this:
The Motley Fool Stock Advisor analyst team just identified what they believe are the 10 best stocks for investors to buy now… and Vanguard S&P 500 ETF wasn’t one of them. The 10 stocks that made the cut could produce monster returns in the coming years.
Consider when Netflix made this list on December 17, 2004... if you invested $1,000 at the time of our recommendation, you’d have $334,631!* Or when Nvidia made this list on April 15, 2005... if you invested $1,000 at the time of our recommendation, you’d have $1,312,844!*
Now, it’s worth noting Stock Advisor’s total average return is 893% — a market-crushing outperformance compared to 213% for the S&P 500. Don't miss the latest top 10 list, available with Stock Advisor, and join an investing community built by individual investors for individual investors.
See the 10 stocks »
*Stock Advisor returns as of October 31, 2026.
Reuben Gregg Brewer has no position in any of the stocks mentioned. The Motley Fool has positions in and recommends Vanguard S&P 500 ETF. The Motley Fool has a disclosure policy.
Recommended Articles


