

Ripple and Stellar outlook: Momentum improves as bulls target further gains

Source Fxstreet
  • XRP hovers around $1.518 on Tuesday after gaining nearly 9% the previous day.
  • XLM claims $0.213 after surging over 9% on Monday.
  • Strengthening momentum indicators support further gains while mixed derivatives metrics could cap upside potential.

Ripple (XRP) and Stellar (XLM) stabilize on Tuesday after extending their gains by nearly 9% at the start of the week on Monday. Improving momentum indicators support XRP and XLM bullish price action and hint at further rally. Meanwhile, traders should remain cautious as mixed derivatives data could limit upside as both tokens try to sustain their recent upswing.

Mixed derivatives metrics

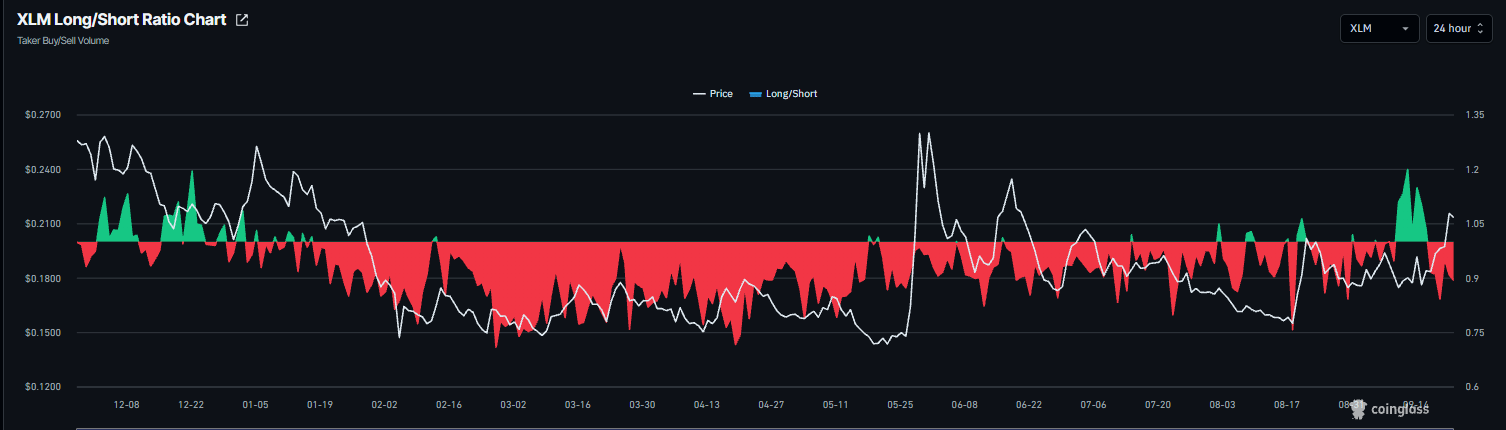
Derivatives data shows a mixed and cautious outlook among traders, despite recent gains in XRP and XLM. CoinGlass’ long-to-short ratios for Ripple and Stellar read 0.86 and 0.89, respectively, on Tuesday, nearing their lowest levels in a month. A ratio below one indicates bearish sentiment, as traders bet that asset prices will fall.
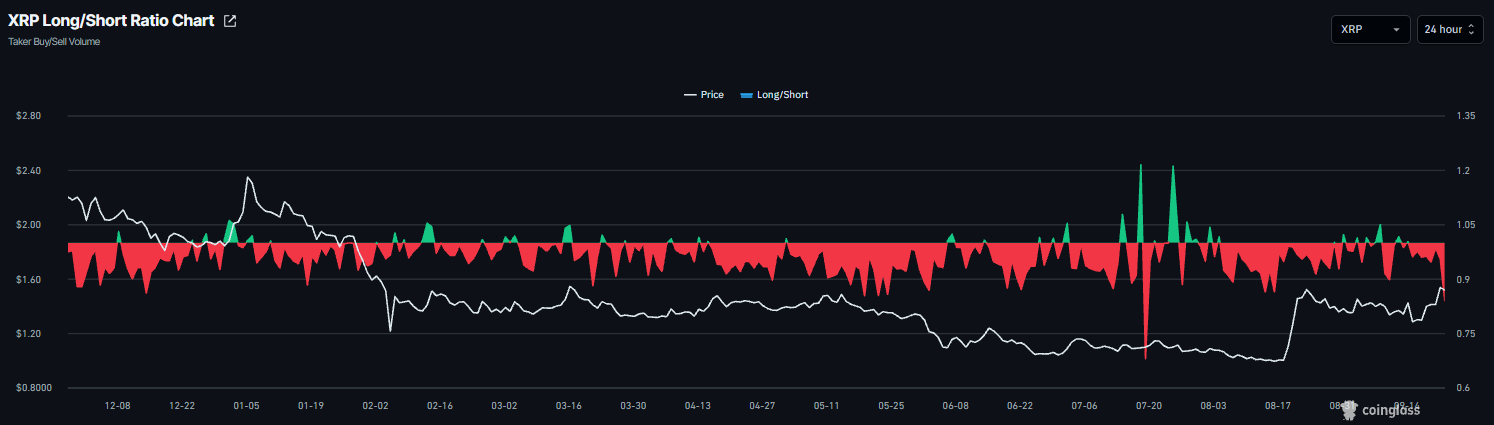
XRP long-to-short ratio chart. Source: Coinglass
XLM long-to-short ratio chart. Source: Coinglass

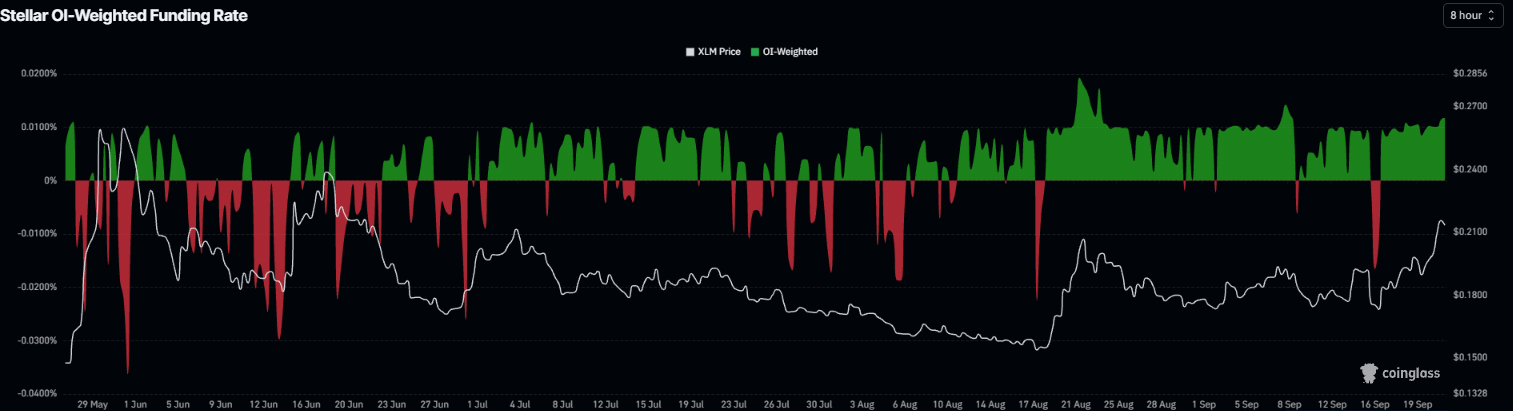
However, the funding rates for both altcoins support a bullish outlook. The XRP funding rate flipped positive on September 18 and surged to 0.010% on Tuesday. Similarly, the XLM funding rate flipped positive on September 16 and surged to 0.011% on Tuesday. These positive rates indicate longs are paying shorts, reflecting a bullish outlook for Ripple and Stellar.
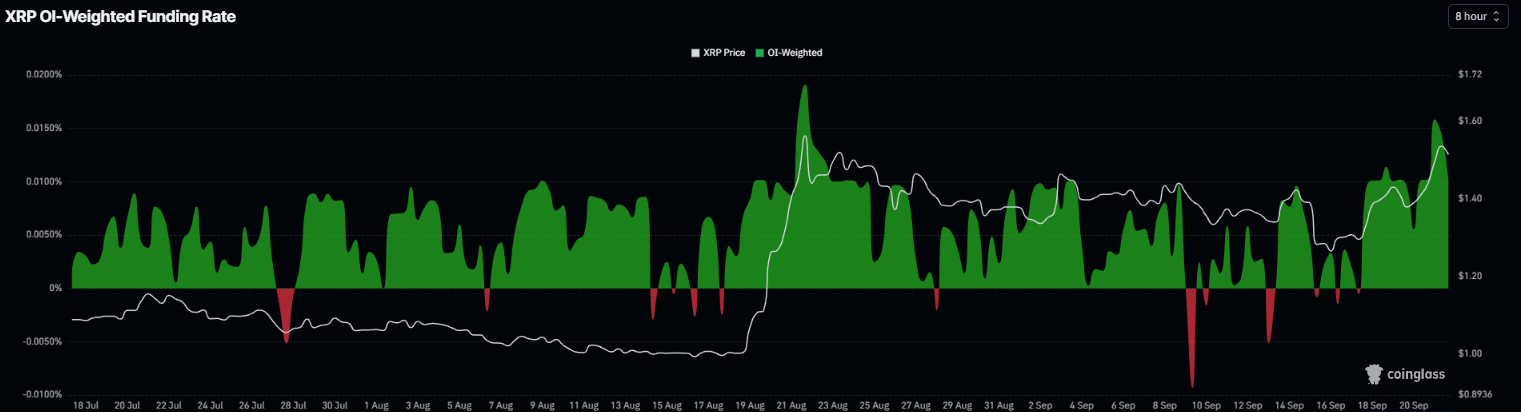
XRP funding rates chart. Source: Coinglass
XLM funding rates chart. Source: Coinglass

XRP technical outlook: Surges after holding key level

XRP price trades at $1.518 on Tuesday, extending its bullish bias as price holds well above the 50-day, 100-day, and 200-day Exponential Moving Averages (EMAs), clustered between roughly $1.274 and $1.358. 

The rebound from recent lows has pushed the Relative Strength Index (RSI) to 63, indicating firm but not yet overbought momentum. At the same time, the Moving Average Convergence Divergence (MACD) has turned positive, hinting that buyers are regaining control after a period of consolidation.

On the downside, immediate support is at the 200-day EMA at $1.358, and the 50-day EMA at $1.315, with horizontal support at $1.300 reinforcing this zone; a deeper pullback could test the 100-day EMA at $1.274 before the major structural floor at $1.000.

On the topside, the next notable resistance aligns with the horizontal barrier at $1.900, where a sustained break would open the way for further gains in the broader uptrend.
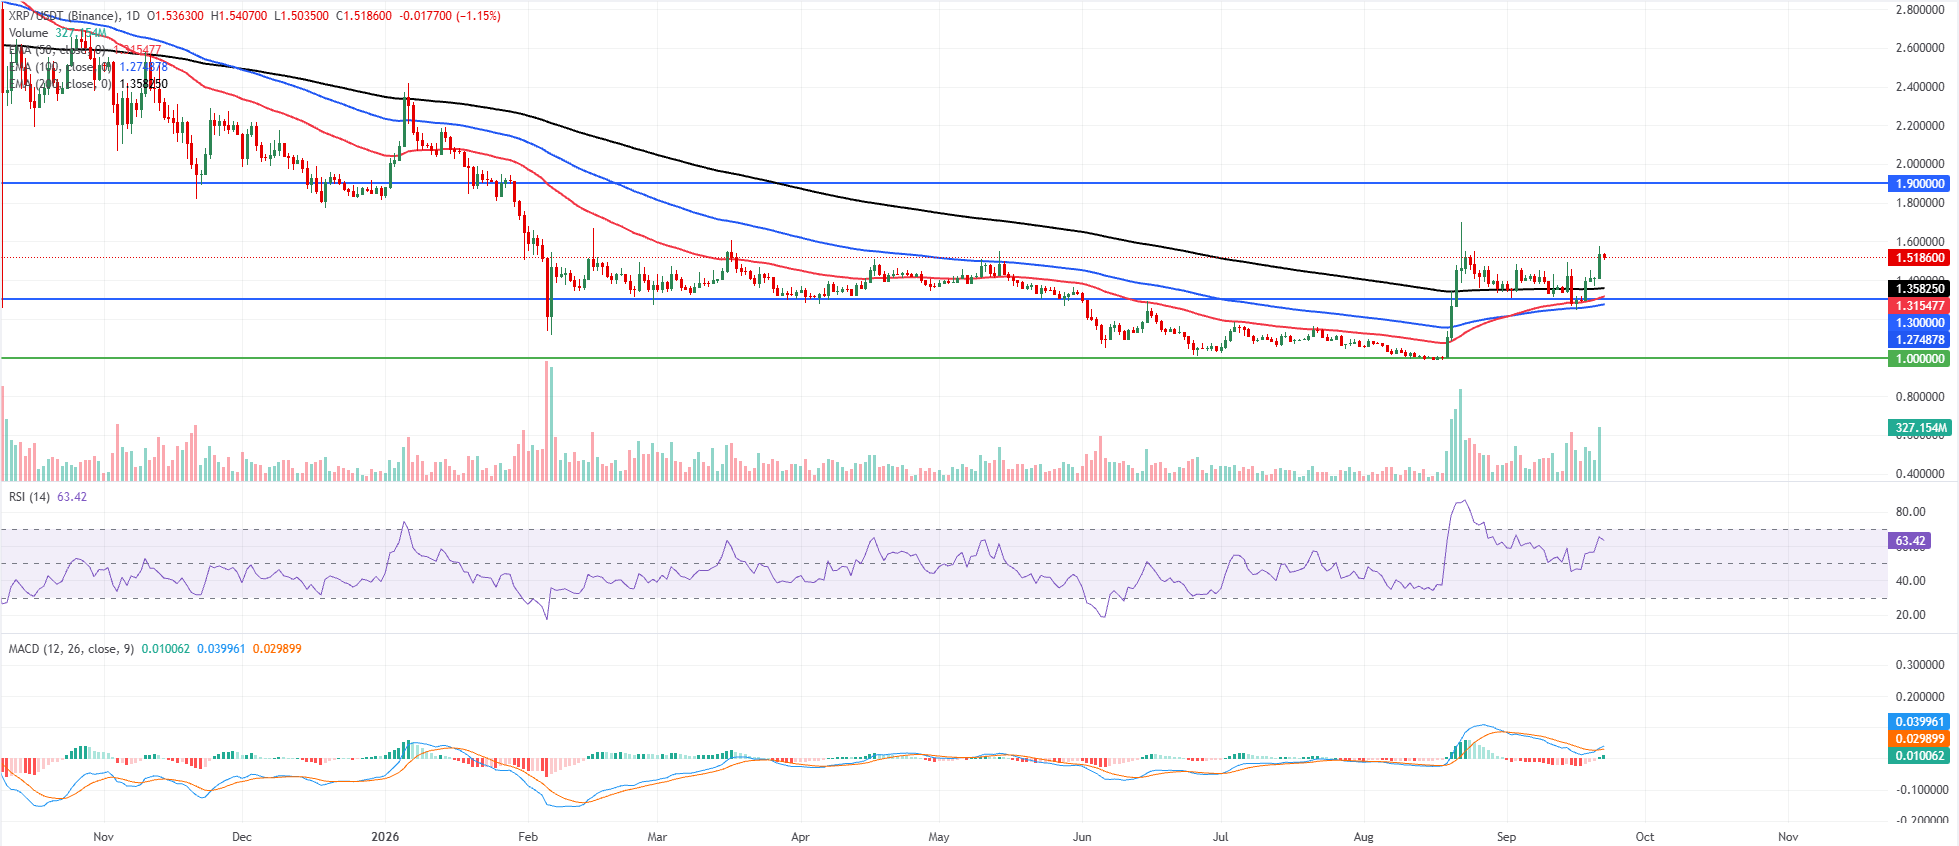
XRP/USDT daily chart

XLM technical outlook: Strengthening momentum indicators

XLM price trades at $0.2135 on Tuesday after gaining over 9% the previous day. XLM maintains a clear bullish bias as price holds above the 50-day, 100-day, and 200-day EMAs, clustered between roughly $0.182 and $0.188.

The rising RSI  near 66 and a positive MACD histogram both suggest strong upward momentum, reinforcing the view that the recent breakout is supported by underlying demand rather than a mere spike.

On the downside, initial support appears at the 200-day EMA near $0.188, followed by the short-term 50-day EMA around $0.184 and the 100-day EMA at $0.182, which together create a dense demand zone before the horizontal base at $0.177. A deeper pullback would expose the more distant structural floor near $0.142, but as long as XLM holds above the EMA cluster, buyers are likely to defend dips, keeping the path of least resistance pointed higher.
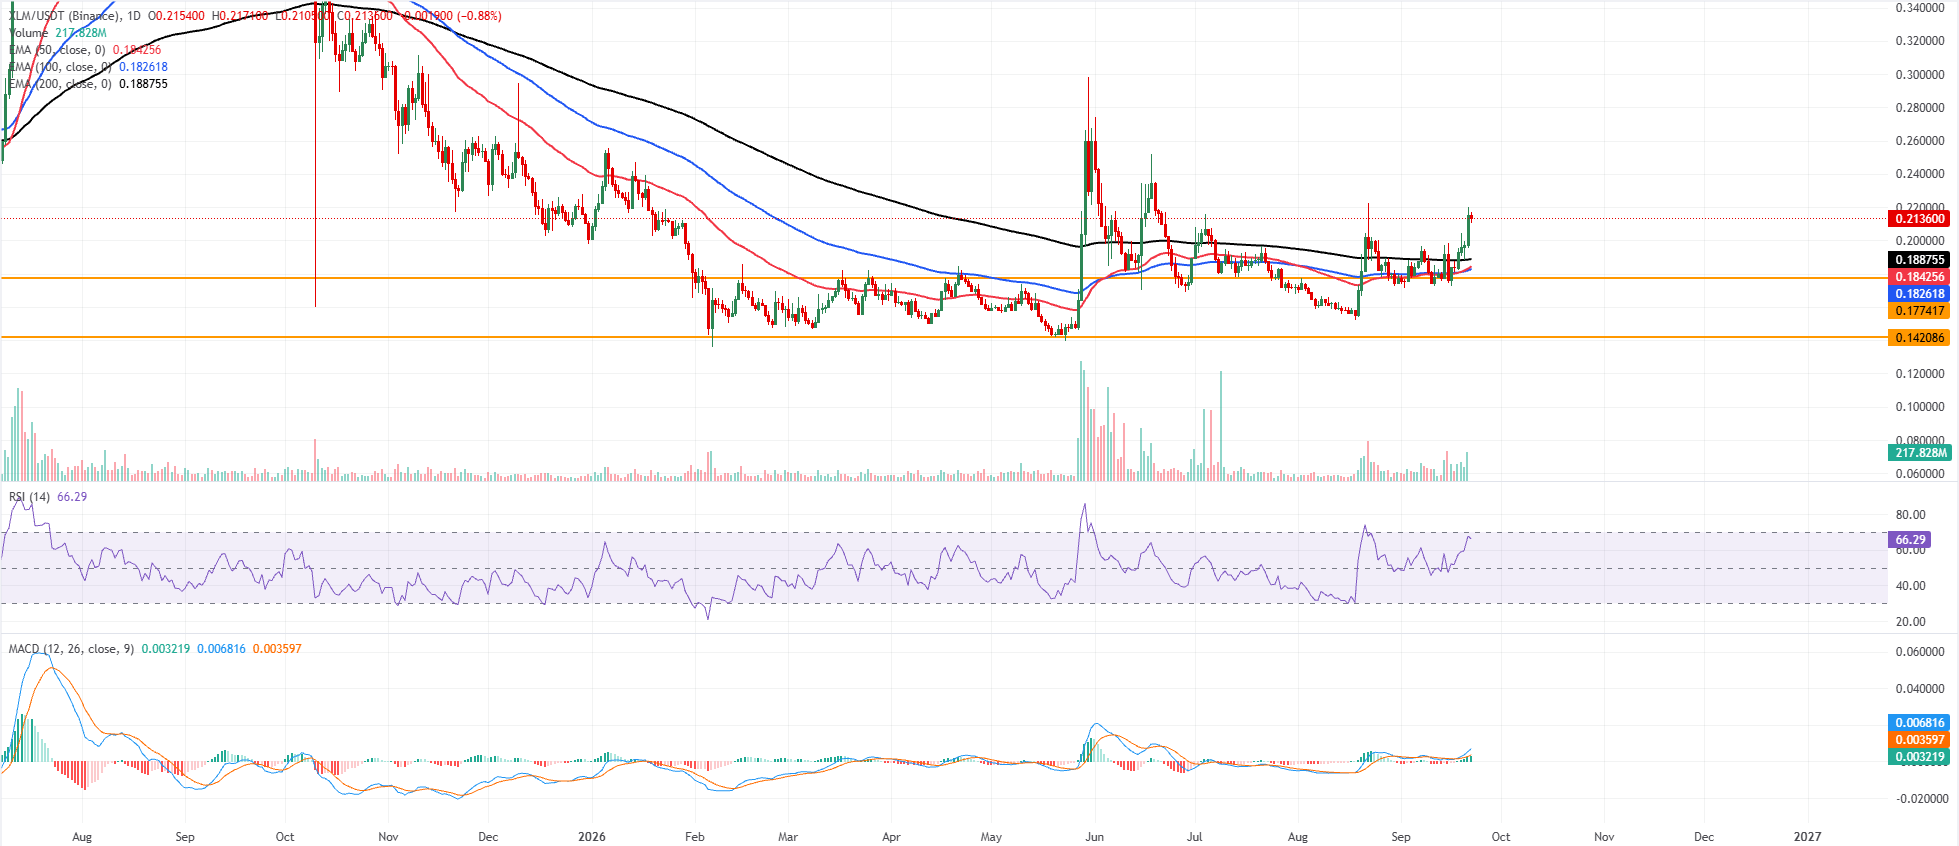
XLM/USDT daily chart

(The technical analysis of this story was written with the help of an AI tool. Know more.)

Disclaimer: For information purposes only. Past performance is not indicative of future results.
placeholder
Bitcoin falls below $75,000 as the CLARITY Act fails in the Senate — what the vote means for cryptoThe US Senate blocked the Digital Asset Market CLARITY Act in a 49-50 procedural vote, sending Bitcoin briefly below $75,000 — its biggest one-day drop since June. Ethereum fell more than 8%, Coinbase slid 10% and $75 billion of crypto market value evaporated. Here is what the vote was, why it failed, and the levels that matter now.
Author  Suzie
Sep 16, Wed
The US Senate blocked the Digital Asset Market CLARITY Act in a 49-50 procedural vote, sending Bitcoin briefly below $75,000 — its biggest one-day drop since June. Ethereum fell more than 8%, Coinbase slid 10% and $75 billion of crypto market value evaporated. Here is what the vote was, why it failed, and the levels that matter now.
placeholder
US to delay new "overcapacity" tariffs on China — what the pause means for trade, inflation and the dollarWashington is expected to hold off announcing new tariffs over Chinese "overcapacity" until after the 24 September summit, according to Bloomberg. The postponed plan would have added 7.5% to Chinese goods, taking second-term US tariffs to around 20%. Here is what is on the table, and what a deal versus no deal would mean for the yuan, Hong Kong equities and the dollar.
Author  Mitrade
Sep 18, Fri
Washington is expected to hold off announcing new tariffs over Chinese "overcapacity" until after the 24 September summit, according to Bloomberg. The postponed plan would have added 7.5% to Chinese goods, taking second-term US tariffs to around 20%. Here is what is on the table, and what a deal versus no deal would mean for the yuan, Hong Kong equities and the dollar.
placeholder
Gold ends three-week slide at the $4,400 line — eight straight days of ETF inflows vs a 5% 10-year and a 100 dollarSpot gold closed Friday at $4,378.39, up 0.84% on the day and about 0.8% for the week — its first weekly gain in four weeks — with the intraday high of $4,399.67 leaving it 33 cents shy of the $4,400 line. Gold ETFs have now logged eight straight sessions of inflows, but with the 10-year back above 5% and the dollar index near 100, here is what decides whether this is a reversal or a bounce.
Author  Suzie
Sep 20, Sun
Spot gold closed Friday at $4,378.39, up 0.84% on the day and about 0.8% for the week — its first weekly gain in four weeks — with the intraday high of $4,399.67 leaving it 33 cents shy of the $4,400 line. Gold ETFs have now logged eight straight sessions of inflows, but with the 10-year back above 5% and the dollar index near 100, here is what decides whether this is a reversal or a bounce.
placeholder
Bitcoin squeezes back above $80,000 — 110,000 traders liquidated as the hawkish Fed and CLARITY setback fail to hold it down; is $83,000 next?Bitcoin closed above $80,000 on Friday for the first time since September 7, and pushed to $81,299 over the weekend, triggering about $603 million of liquidations — $523 million of them shorts — across more than 110,000 traders. With the Fed's hike already priced and the SEC and CFTC advancing crypto rules after the CLARITY Act failed, here is what stands between BTC and the $83,000 gate.
Author  Suzie
Sep 20, Sun
Bitcoin closed above $80,000 on Friday for the first time since September 7, and pushed to $81,299 over the weekend, triggering about $603 million of liquidations — $523 million of them shorts — across more than 110,000 traders. With the Fed's hike already priced and the SEC and CFTC advancing crypto rules after the CLARITY Act failed, here is what stands between BTC and the $83,000 gate.
placeholder
Bitcoin rallies near $86K on improving markets ahead of quarterly options expiryBitcoin (BTC) market conditions improved over the past week as spot buying pressure strengthened and derivatives positioning increased, pushing the top crypto near $86,000.
Author  FXStreet
8 hours ago
Bitcoin (BTC) market conditions improved over the past week as spot buying pressure strengthened and derivatives positioning increased, pushing the top crypto near $86,000.
Related Instrument
goTop
quote