

Ripple Price Forecast: XRP extends rally toward $1.50 as derivatives activity rises despite ETF outflows

Source Fxstreet
  • XRP maintains a strong bullish stance, consolidating just below $1.50.
  • XRP futures Open Interest climbs to 2.3 billion XRP, while US-listed spot ETFs record $44,000 in outflows.
  • XRP appears well-positioned to continue its upward trajectory, with strengthening momentum indicators reinforcing a constructive market structure.

Ripple (XRP) holds a strong bullish picture, rising to trade near $1.50 on Monday. The remittance token marks four consecutive days of gains, supported by robust momentum indicators and increased risk appetite in the broader cryptocurrency market.

A daily close above $1.50 could reassert bullish control, raising the odds of an extended breakout to $1.60 and subsequently August highs of $1.70.

XRP derivatives rise offsetting ETF outflows

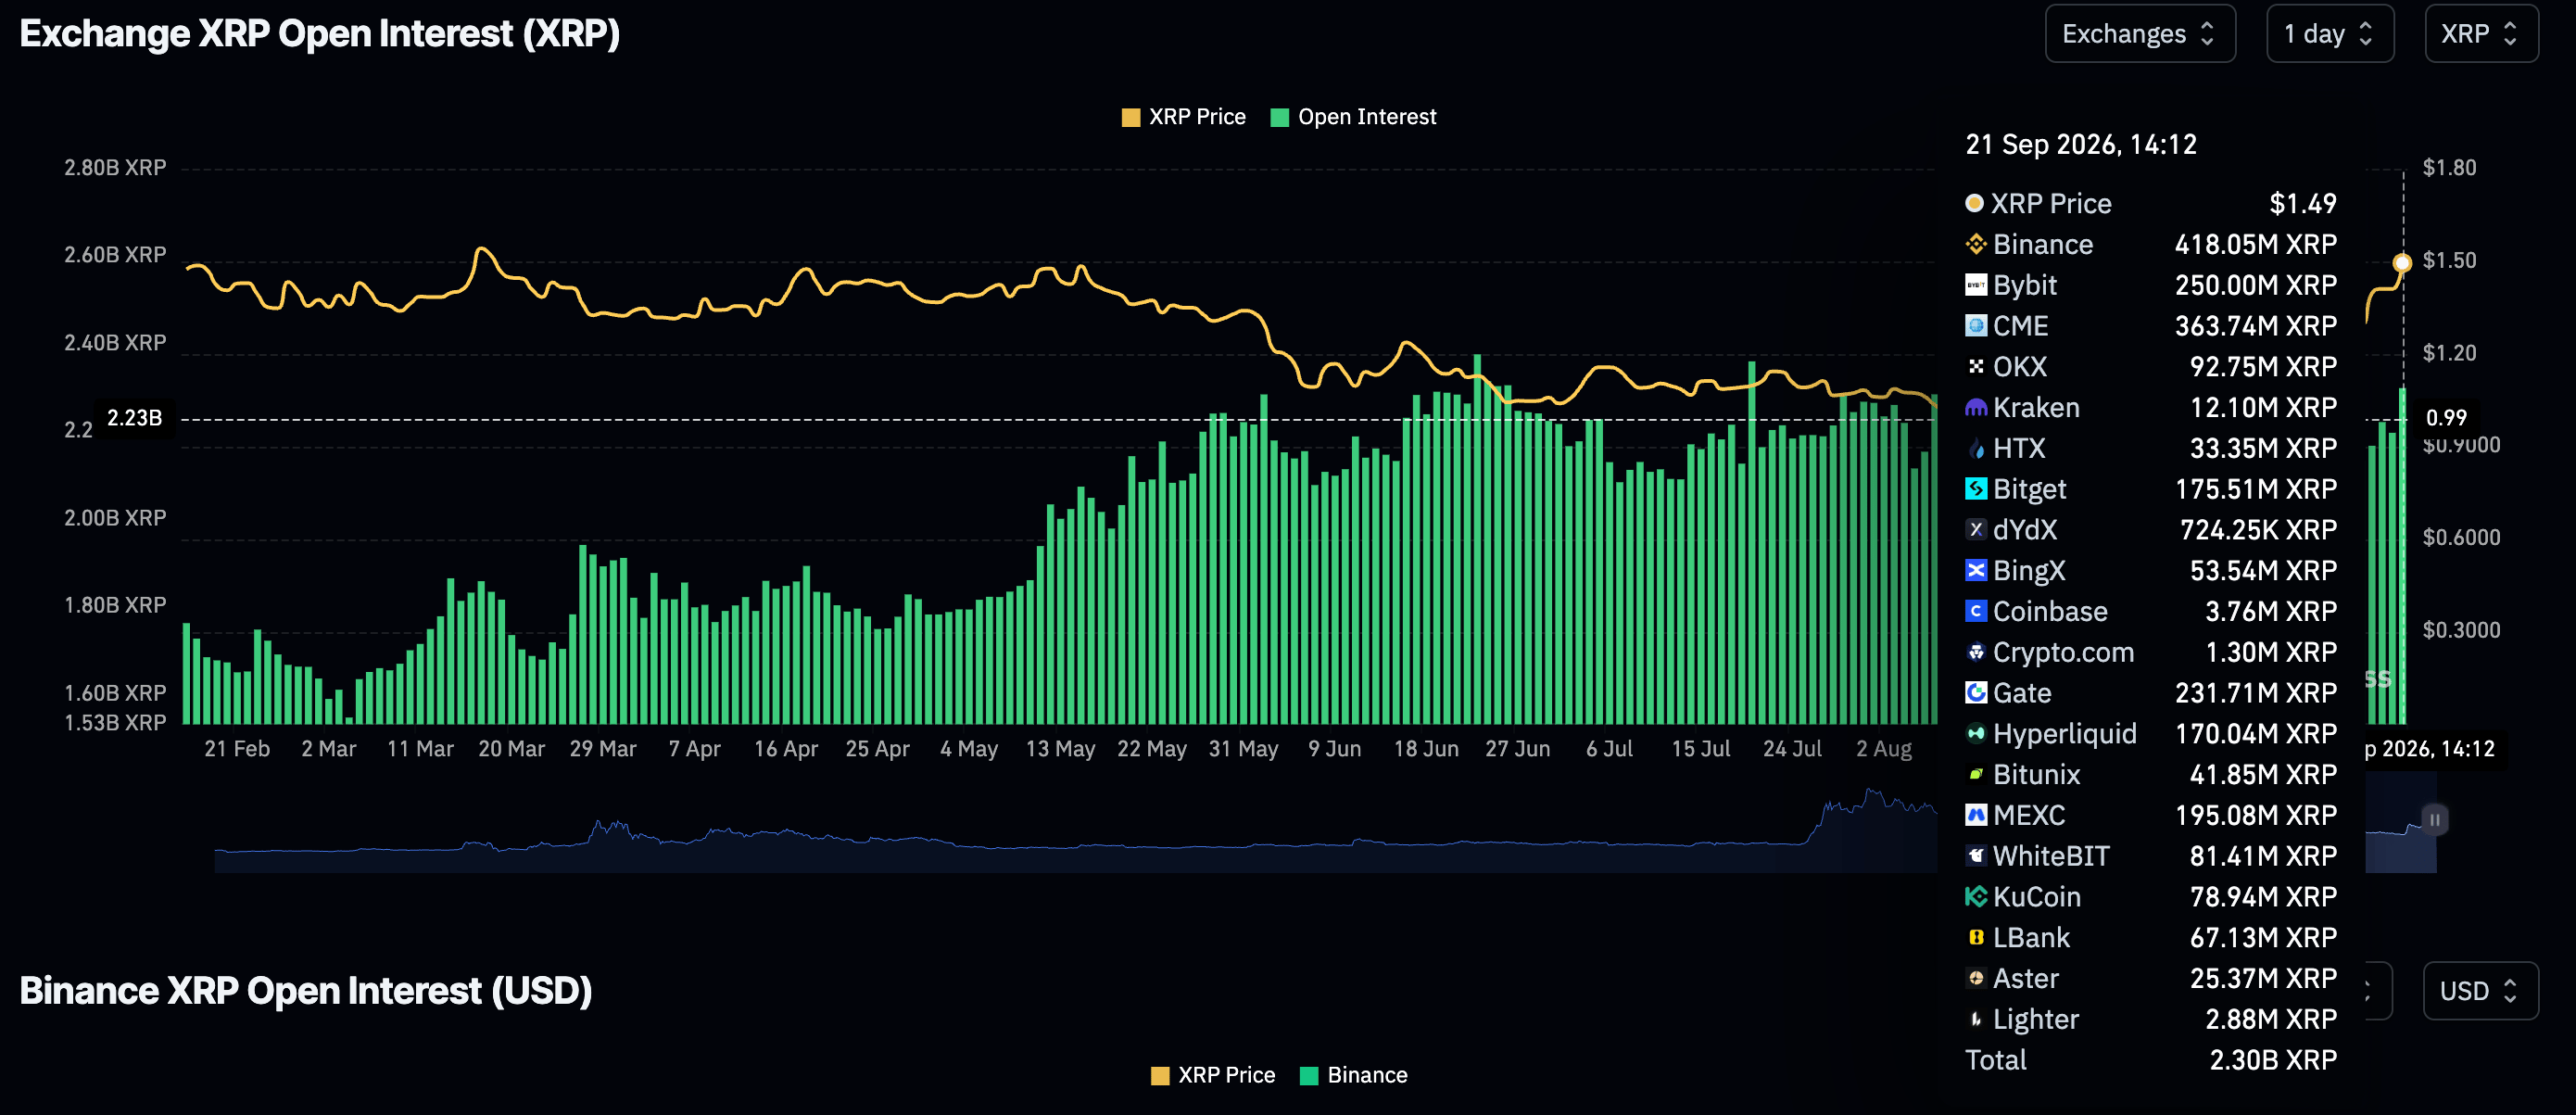
The XRP derivatives market is gaining strength, with perpetual futures Open Interest (OI) reaching 2.3 billion XRP on Monday, up from 2.2 billion the previous day. On a broader timeframe, OI has steadily rebounded from 2.08 billion XRP as of September 13, highlighting renewed conviction among derivatives traders.

Continued demand would provide a tailwind to support the token’s bullish outlook. However, traders should tread with caution, given near-overbought levels. Failure to breach key short-term barriers could trigger a sell-off amid profit-taking.
Crypto Fear & Greed Index | Source: Alternative

Meanwhile, institutional interest in US-listed XRP spot Exchange-Traded Funds (ETFs) remains on the back foot, with mild outflows totaling $44,000 last Friday and roughly $5  million the day before. Despite the outflows, cumulative inflows are positive at $1.71 billion while net assets average $1.51 billion, underscoring long-term investor interest in XRP.
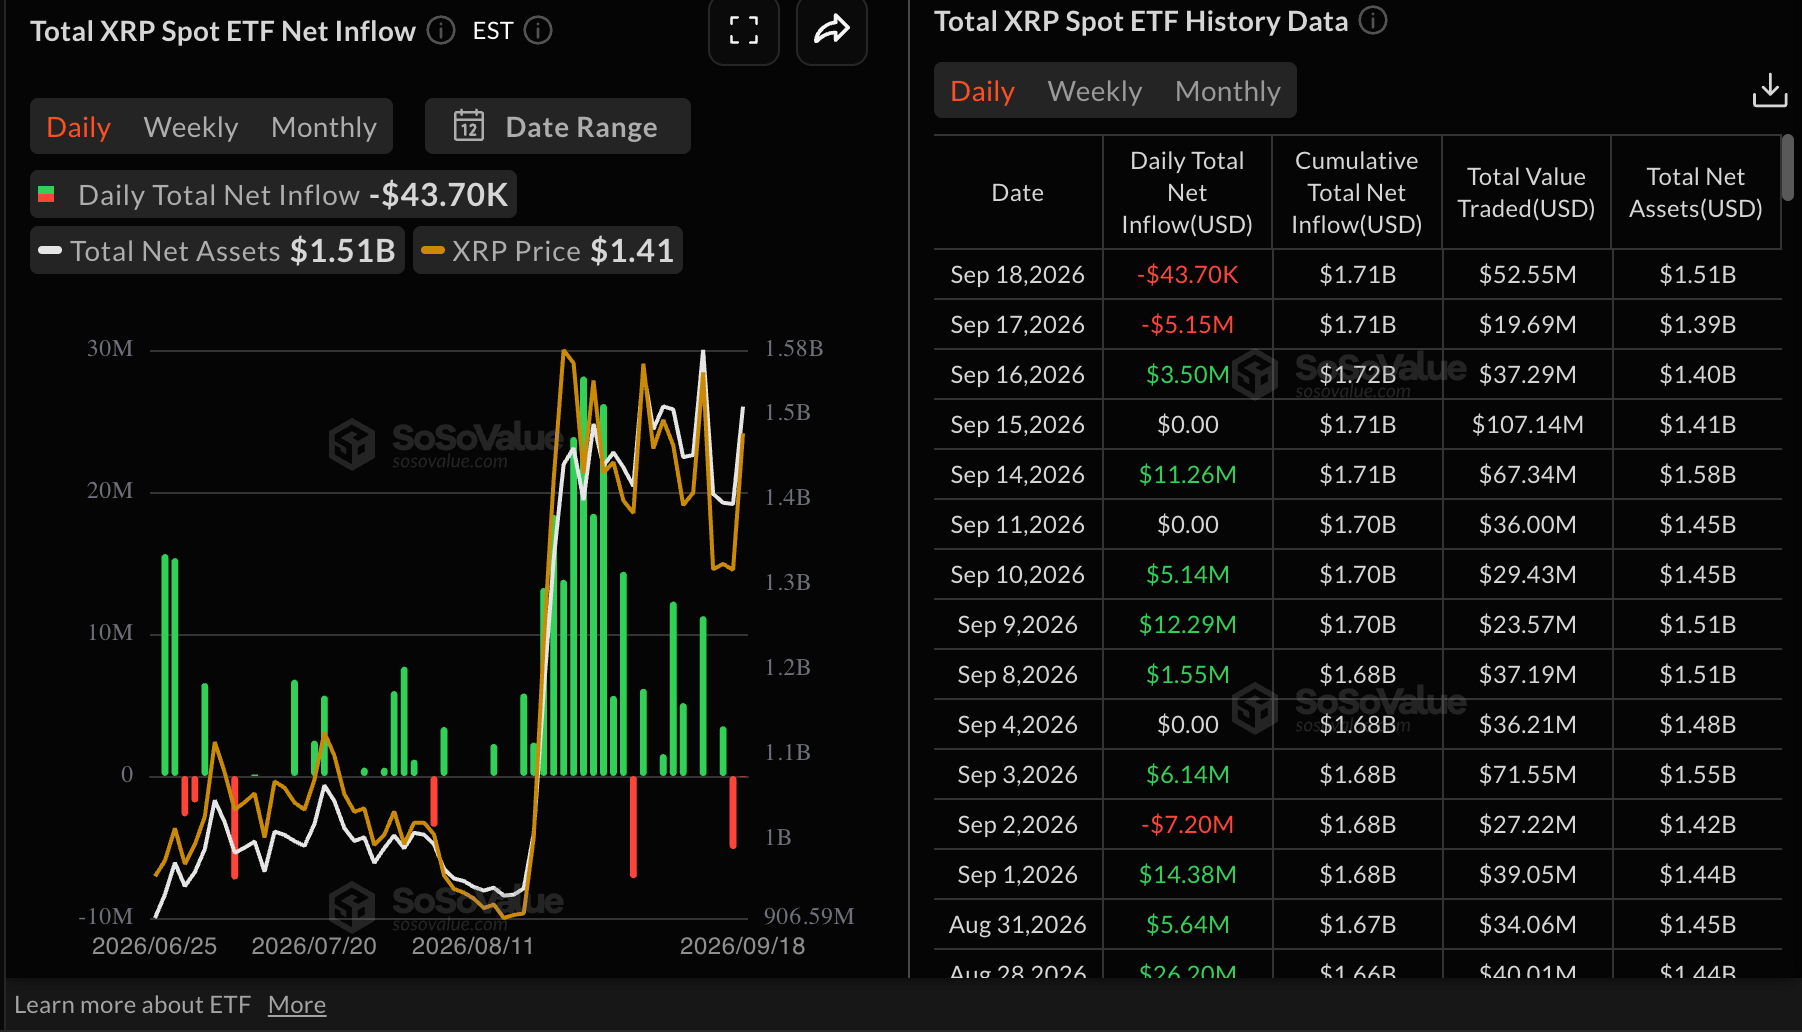
XRP ETF flows | Source: SoSoValue

Technical analysis: XRP edges higher amid increased buying

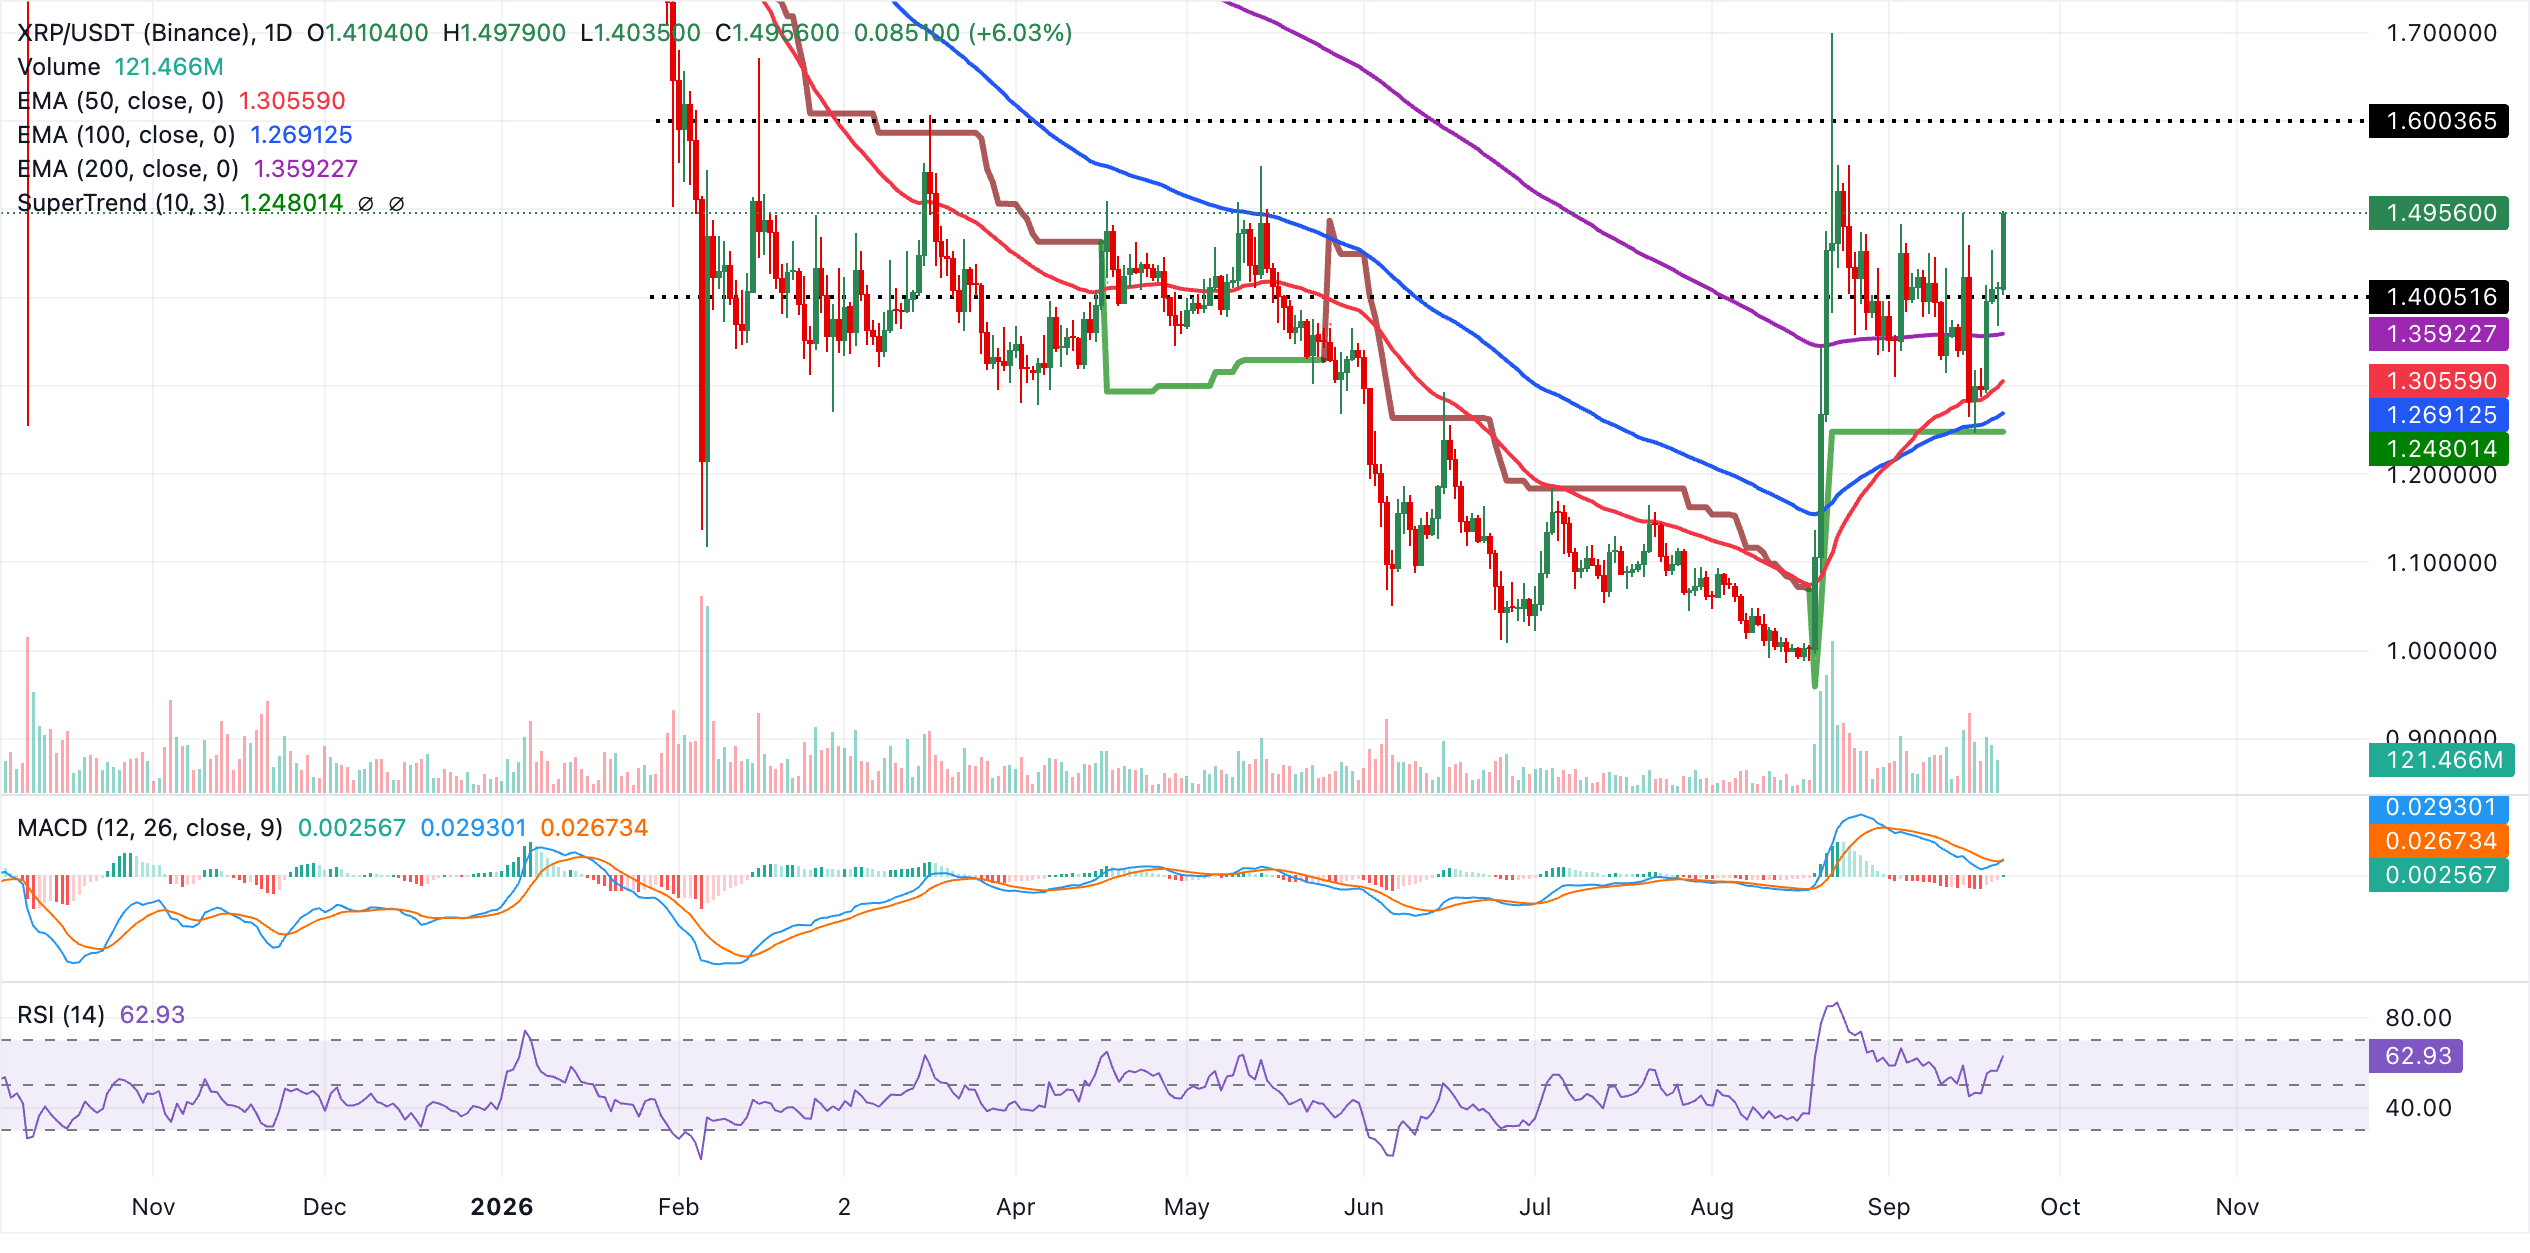
XRP trades near $1.50, maintaining a constructive bullish bias as price holds comfortably above the 50-day, 100-day and 200-day Exponential Moving Averages (EMAs) clustered between roughly $1.27 and $1.36. The SuperTrend line at $1.25 reinforces this demand undercurrent, while the Relative Strength Index (RSI) near 63 points to firm but not yet overextended upside momentum, and the Moving Average Convergence Divergence (MACD) histogram has turned marginally positive, suggesting buyers still retain near-term control.
XRP/USDT daily chart

On the downside, initial support is at the 200-day EMA around $1.36, followed by the 50-day EMA near $1.31 and the 100-day EMA near $1.27, with the SuperTrend baseline at $1.25 as a deeper safety net if a corrective pullback unfolds. With no clear overhead levels defined on the daily chart, the broader technical picture suggests that any dips toward these EMA and SuperTrend supports are likely to attract fresh demand as long as daily closes remain above the $1.36 area.

(The technical analysis of this story was written with the help of an AI tool. Know more.)

Crypto ETF FAQs

An Exchange-Traded Fund (ETF) is an investment vehicle or an index that tracks the price of an underlying asset. ETFs can not only track a single asset, but a group of assets and sectors. For example, a Bitcoin ETF tracks Bitcoin’s price. ETF is a tool used by investors to gain exposure to a certain asset.

Yes. The first Bitcoin futures ETF in the US was approved by the US Securities & Exchange Commission in October 2021. A total of seven Bitcoin futures ETFs have been approved, with more than 20 still waiting for the regulator’s permission. The SEC says that the cryptocurrency industry is new and subject to manipulation, which is why it has been delaying crypto-related futures ETFs for the last few years.

Yes. The SEC approved in January 2024 the listing and trading of several Bitcoin spot Exchange-Traded Funds, opening the door to institutional capital and mainstream investors to trade the main crypto currency. The decision was hailed by the industry as a game changer.

The main advantage of crypto ETFs is the possibility of gaining exposure to a cryptocurrency without ownership, reducing the risk and cost of holding the asset. Other pros are a lower learning curve and higher security for investors since ETFs take charge of securing the underlying asset holdings. As for the main drawbacks, the main one is that as an investor you can’t have direct ownership of the asset, or, as they say in crypto, “not your keys, not your coins.” Other disadvantages are higher costs associated with holding crypto since ETFs charge fees for active management. Finally, even though investing in ETFs reduces the risk of holding an asset, price swings in the underlying cryptocurrency are likely to be reflected in the investment vehicle too.

Disclaimer: For information purposes only. Past performance is not indicative of future results.
placeholder
Gold Price Analysis Today | Forex Gold Analysis | XAU/USD Analysis - November 10, 2026Get the latest gold price analysis, forex gold insights, and XAU/USD analysis for November 10, 2026. Read on for the details.
Author  Mitrade
Nov 10, Tue
Get the latest gold price analysis, forex gold insights, and XAU/USD analysis for November 10, 2026. Read on for the details.
placeholder
Gold Price Analysis Today | Forex Gold Analysis | XAU/USD Analysis - November 11, 2026Get the latest gold price analysis, forex gold insights, and XAU/USD analysis for November 11, 2026. Read on for the details.
Author  Mitrade
Nov 11, Wed
Get the latest gold price analysis, forex gold insights, and XAU/USD analysis for November 11, 2026. Read on for the details.
placeholder
Nvidia slid 7.7% after hours while AMD and Broadcom rose — the AI trade changed hands, it didn't breakNvidia closed Wednesday at 173.73, up 2.87%, then fell as much as 8.1% to 159.44 after reports that its board was preparing for a possible leadership change. The same session, the Philadelphia Semiconductor Index rose 5.7% with all 30 components higher, CoreWeave jumped 24.7% on 168% revenue growth, and Micron added 11.9%. If AI demand were being repriced, AMD and Broadcom would not be bid. This is a governance discount on one name, and 204.54 — the 200-day average — is the level that settles it.
Author  Irene Q.
Nov 12, Thu
Nvidia closed Wednesday at 173.73, up 2.87%, then fell as much as 8.1% to 159.44 after reports that its board was preparing for a possible leadership change. The same session, the Philadelphia Semiconductor Index rose 5.7% with all 30 components higher, CoreWeave jumped 24.7% on 168% revenue growth, and Micron added 11.9%. If AI demand were being repriced, AMD and Broadcom would not be bid. This is a governance discount on one name, and 204.54 — the 200-day average — is the level that settles it.
placeholder
Gold hit a one-year low while central banks bought 321 tonnes — the sellers were never the ones you thinkSpot gold closed at 3,876 on Thursday, down 2.8% and its lowest close in more than a year, with an intraday low near 3,852. The dollar is at a 19-month high of 103.21 and the 10-year yield is at 5.10%, so the price move is easy to explain. What is harder to explain is who sold: central banks bought 321 tonnes in Q3, the PBoC added for a 24th straight month, ETF holdings are near a record 4,256 tonnes, and roughly 95% of the futures selling came from non-reportable and sovereign-type accounts rather than hedge funds. This piece separates the two books that have to balance.
Author  Irene Q.
Nov 13, Fri
Spot gold closed at 3,876 on Thursday, down 2.8% and its lowest close in more than a year, with an intraday low near 3,852. The dollar is at a 19-month high of 103.21 and the 10-year yield is at 5.10%, so the price move is easy to explain. What is harder to explain is who sold: central banks bought 321 tonnes in Q3, the PBoC added for a 24th straight month, ETF holdings are near a record 4,256 tonnes, and roughly 95% of the futures selling came from non-reportable and sovereign-type accounts rather than hedge funds. This piece separates the two books that have to balance.
placeholder
Brent rose 3.3% and US crude stocks built 4.66 million barrels in the same weekBrent January settled at 95.82, up 3.3%, and WTI at 88.74, up 2.55%, after the US signalled it would not pursue a deal with Iran and attacks on Gulf shipping continued. In the same week, EIA data showed US crude inventories rising 4.657 million barrels against expectations of a 1.1 million draw, with gasoline up another 1.799 million. OPEC output also rebounded 1.96 million barrels a day to 27.16 million in October, led by Saudi Arabia at 10.56 million. This piece separates the geopolitical premium from the physical balance and lays out where each side of the trade is anchored.
Author  Irene Q.
Nov 13, Fri
Brent January settled at 95.82, up 3.3%, and WTI at 88.74, up 2.55%, after the US signalled it would not pursue a deal with Iran and attacks on Gulf shipping continued. In the same week, EIA data showed US crude inventories rising 4.657 million barrels against expectations of a 1.1 million draw, with gasoline up another 1.799 million. OPEC output also rebounded 1.96 million barrels a day to 27.16 million in October, led by Saudi Arabia at 10.56 million. This piece separates the geopolitical premium from the physical balance and lays out where each side of the trade is anchored.
Related Instrument
goTop
quote