


XRP (XRPUSD) Is down 2.26% on Oct 30: Key Drivers to Watch
XRP (XRPUSD) is down 2.26% at Oct 30 20:30(ET), now at $1.2102, with a 7-day down of 7.47%.
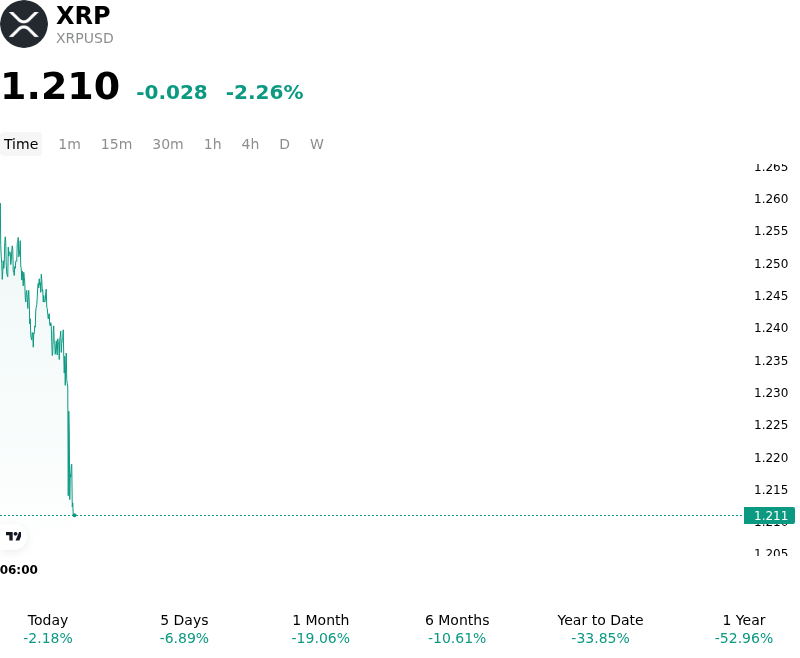
What is driving XRP (XRPUSD)’s stock price down today?
The downside movement in XRP reflected broader risk-off sentiment across digital asset markets following the Federal Reserve's hawkish monetary policy stance. The central bank's choice to hold interest rates steady was accompanied by persistent warnings on inflation risks, dampening expectations for near-term monetary easing. This macroeconomic backdrop, combined with earnings-driven volatility in technology equities, tightened global market liquidity and prompted a retrenchment in high-beta risk assets. Institutional risk appetite contracted across major cryptocurrencies, driving systematic de-risking and long liquidations in crypto derivatives markets.
Asset-specific factors further weighted on XRP, driven primarily by a structural disconnect between corporate developments and native token demand. Although recent corporate announcements highlighted expanding enterprise financial services, regulatory milestones, and growth in stablecoin issuance such as RLUSD, market participants noted that these initiatives largely bypass direct token utility. Institutional capital flows into spot XRP exchange-traded funds remained stagnant, registering zero net inflows to absorb spot market overhead supply. Consequently, positive enterprise headlines failed to translate into structural buying pressure for the underlying token.
From an on-chain and technical perspective, a clear divergence emerged between blockchain utilization and price performance. Despite daily active accounts on the XRP Ledger reaching multi-month highs, expanded network participation failed to generate meaningful spot accumulation. In derivatives markets, open interest contracted as traders unwound leveraged long positions after prices failed to hold key technical moving averages. Furthermore, market participants maintained a cautious stance ahead of the recurring monthly release of tokens from programmatic escrow accounts, reinforcing liquidations and preventing upside momentum.
Technical Analysis of XRP (XRPUSD)
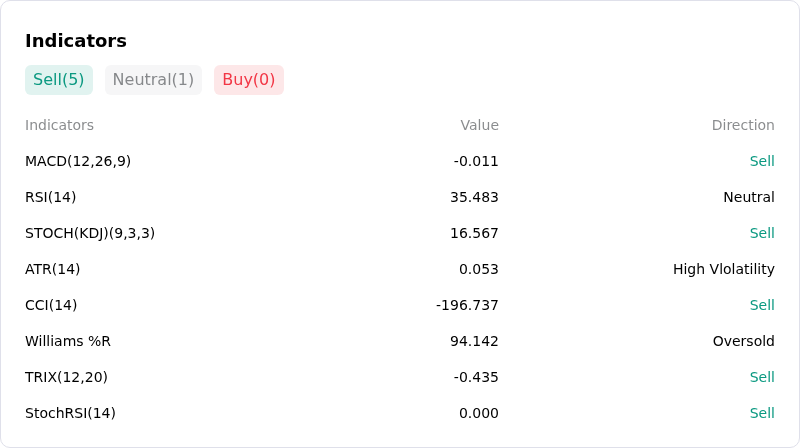
Technically, XRP (XRPUSD) shows a MACD (12,26,9) value of -0.010, indicating a sell signal. The RSI at 35.895 suggests neutral condition and the Williams %R at 93.986 suggests oversold condition. Please monitor closely.
More details about XRP (XRPUSD)
Recent Events and Risks:
- Derivatives Leverage Unwinds and Long Liquidations: Persistent crypto market weakness and a sharp downside long liquidation imbalance across perpetual futures markets have forced XRP prices down toward the critical $1.25–$1.28 support boundary. With derivatives open interest remaining elevated relative to thin spot trading volumes, positioning remains vulnerable to cascading liquidation flushes.
- Whale Position Distribution and Exchange Inflows: On-chain tracking shows active supply distribution among large XRP holders, with mid-tier whale wallets (10M to 100M XRP) reducing balances while approximately 50 million tokens were transferred onto centralized crypto exchanges, adding overhead selling pressure.
- Technical Support Breakdown and Bearish Crossover: XRP's 20-day exponential moving average has crossed below its 50-day EMA, signaling a deteriorating short-term technical structure. Market analysts warn that a sustained daily close beneath the $1.25–$1.26 support range risks triggering technical stop losses toward lower support targets at $1.11 and $0.98.
- Protocol Governance Delays and Ledger Liquidity Contraction: Activation of the core fixCleanup amendment on the XRP Ledger was delayed after validator consensus temporarily dropped below the required 80% threshold, while total stablecoin capitalization on the XRPL declined nearly 12% over the past month, weakening available on-chain trading liquidity.
Recommended Articles


