Fed hike odds near 90% into Wednesday's decision — how to trade the dollar, gold and the S&P 500

coverImg
Source: DepositPhotos

The Federal Reserve is set to raise rates for the first time since July 2023. After August core inflation came in hotter than expected, futures markets now assign roughly 86.5% ~ 90% odds to a 25 basis-point increase at the 15-16 September meeting. The dollar is holding near 99, gold has just posted its third straight weekly loss, and the S&P 500 is drifting below 7,650 into the decision.

The interesting question is no longer whether the Fed moves. It is what the dot plot says about the next one.

When it lands: the timeline and what is priced

The decision is published at 2:00 pm ET on Wednesday 16 September (04:00 AEST Thursday 17 September), followed by the Chair's press conference and the quarterly Summary of Economic Projections. Because this is the first time since June that the committee has updated its view of where rates end the year, the dot plot matters as much as the decision itself.

ItemMarket expectationPrior / current
Fed funds target rate+25bp hike3.50% ~ 3.75%
August CPI, YoY3.4% (in line)3.4%
August CPI, MoM+0.4%+0.1%
August core CPI, MoM+0.3% (vs 0.2% expected)+0.2%
August core CPI, YoY2.4% (third straight decline)2.5%
August non-farm payrolls+162,000 (vs +56,000 expected)

CME FedWatch shows the odds of a quarter-point move climbing from about 70% before the CPI release to roughly 86.5% ~ 90%, with a second hike by year-end now fully priced. Several institutions have gone further: BMO expects increases in September, October and December.

Worth keeping in mind: a Reuters poll of economists still has the majority expecting the Fed to hold this month and through the end of 2027. That gap between market pricing and economist forecasts is itself the source of volatility.
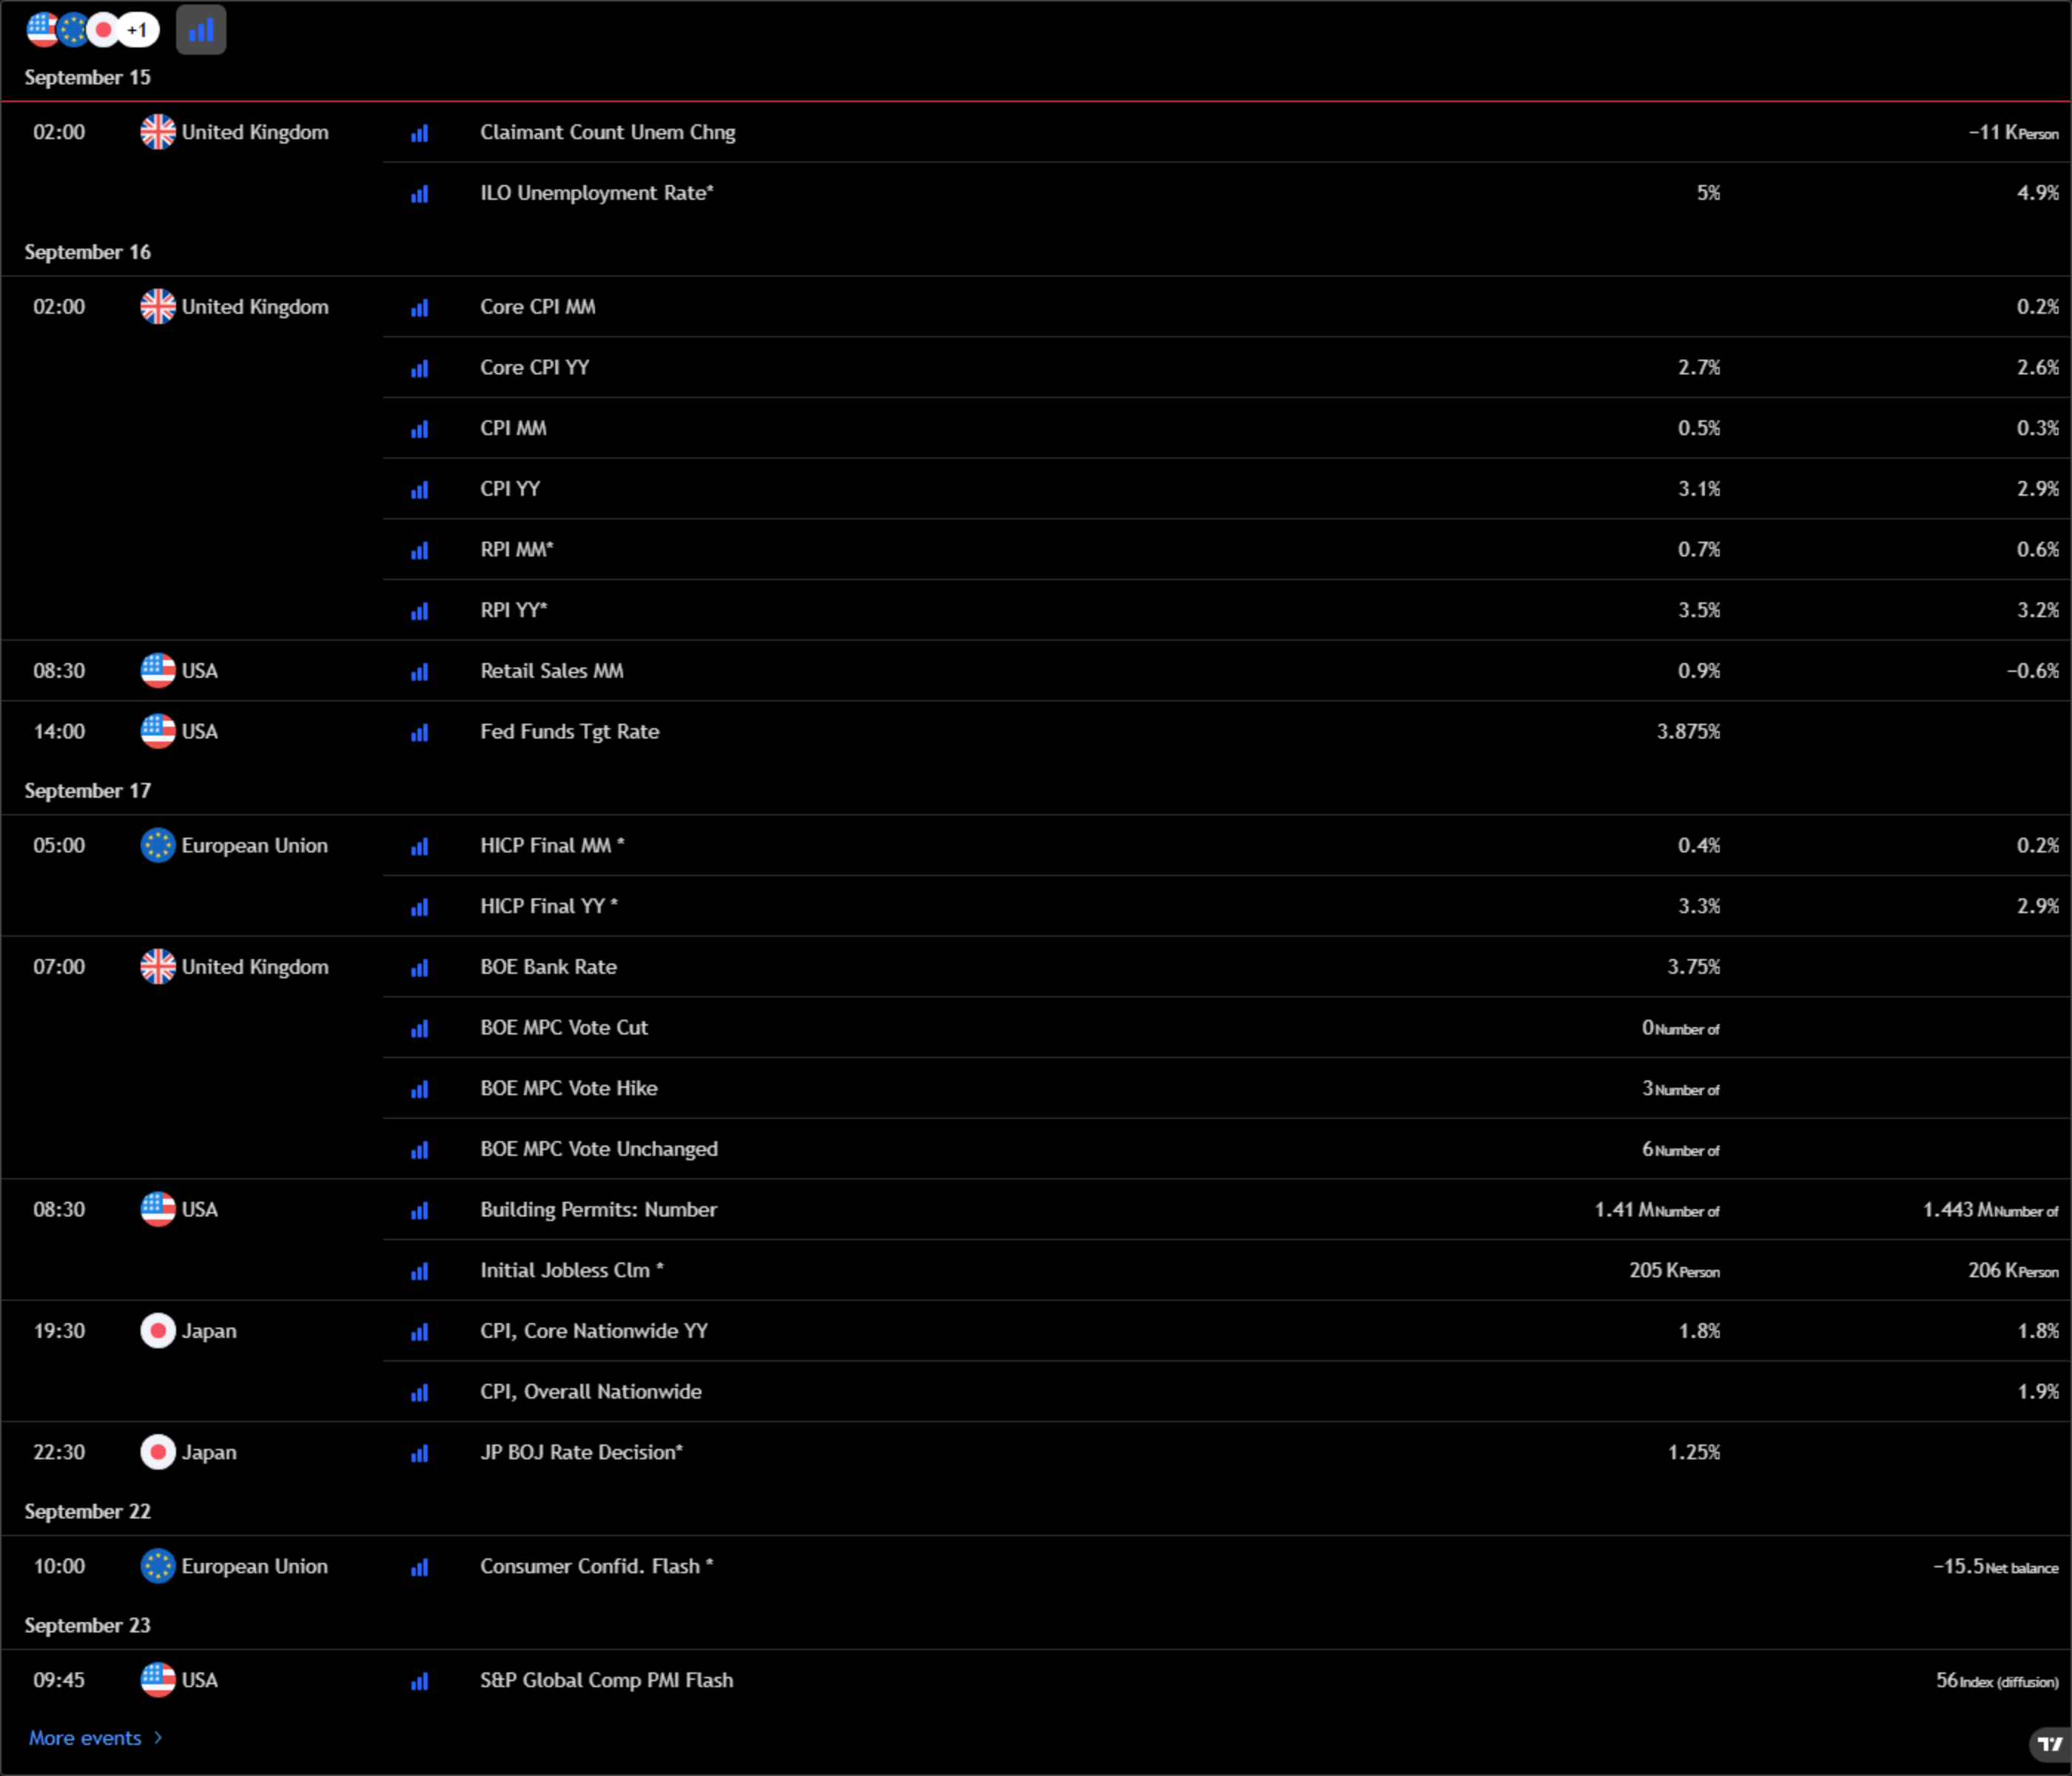
Official TradingView economic calendar screenshot (English interface, New York time, UTC-4) — listing the key events from 15 to 23 September: the US Fed Funds Target Rate on 16 September (expected 3.875%), US retail sales month-on-month on 16 September (expected 0.9%, prior -0.6%), the Bank of England Bank Rate on 17 September (expected 3.75%), and the Bank of Japan rate decision on 18 September (expected 1.25%).

* Source: official TradingView Economic Calendar screenshot, New York time (EDT, UTC-4), captured 14 September 2026.

Why a hike is now close to a done deal

Two data sets did the work.

  1. Inflation. August headline CPI rose 0.4% month-on-month. Energy rose 2.1%, with gasoline up 3.9% and accounting for more than a third of the headline gain; fuel oil jumped 10.1%. Core CPI at 0.3% month-on-month was the largest increase since April, and this time the pressure came from services rather than energy — shelter +0.3%, communication +2.3%, airfares +2.7%.

  2. Employment. August payrolls came in at +162,000 against expectations of +56,000, with unemployment at 4.1%. The labour market has not cooled enough to give the Fed cover to wait.

Oil is amplifying the inflation stickiness. Brent is back above $106 a barrel after a key regional export pipeline was shut down as a precaution with no restart timeline given, and European natural gas has hit its highest since December 2022. The pass-through from energy into headline prices has only just begun.
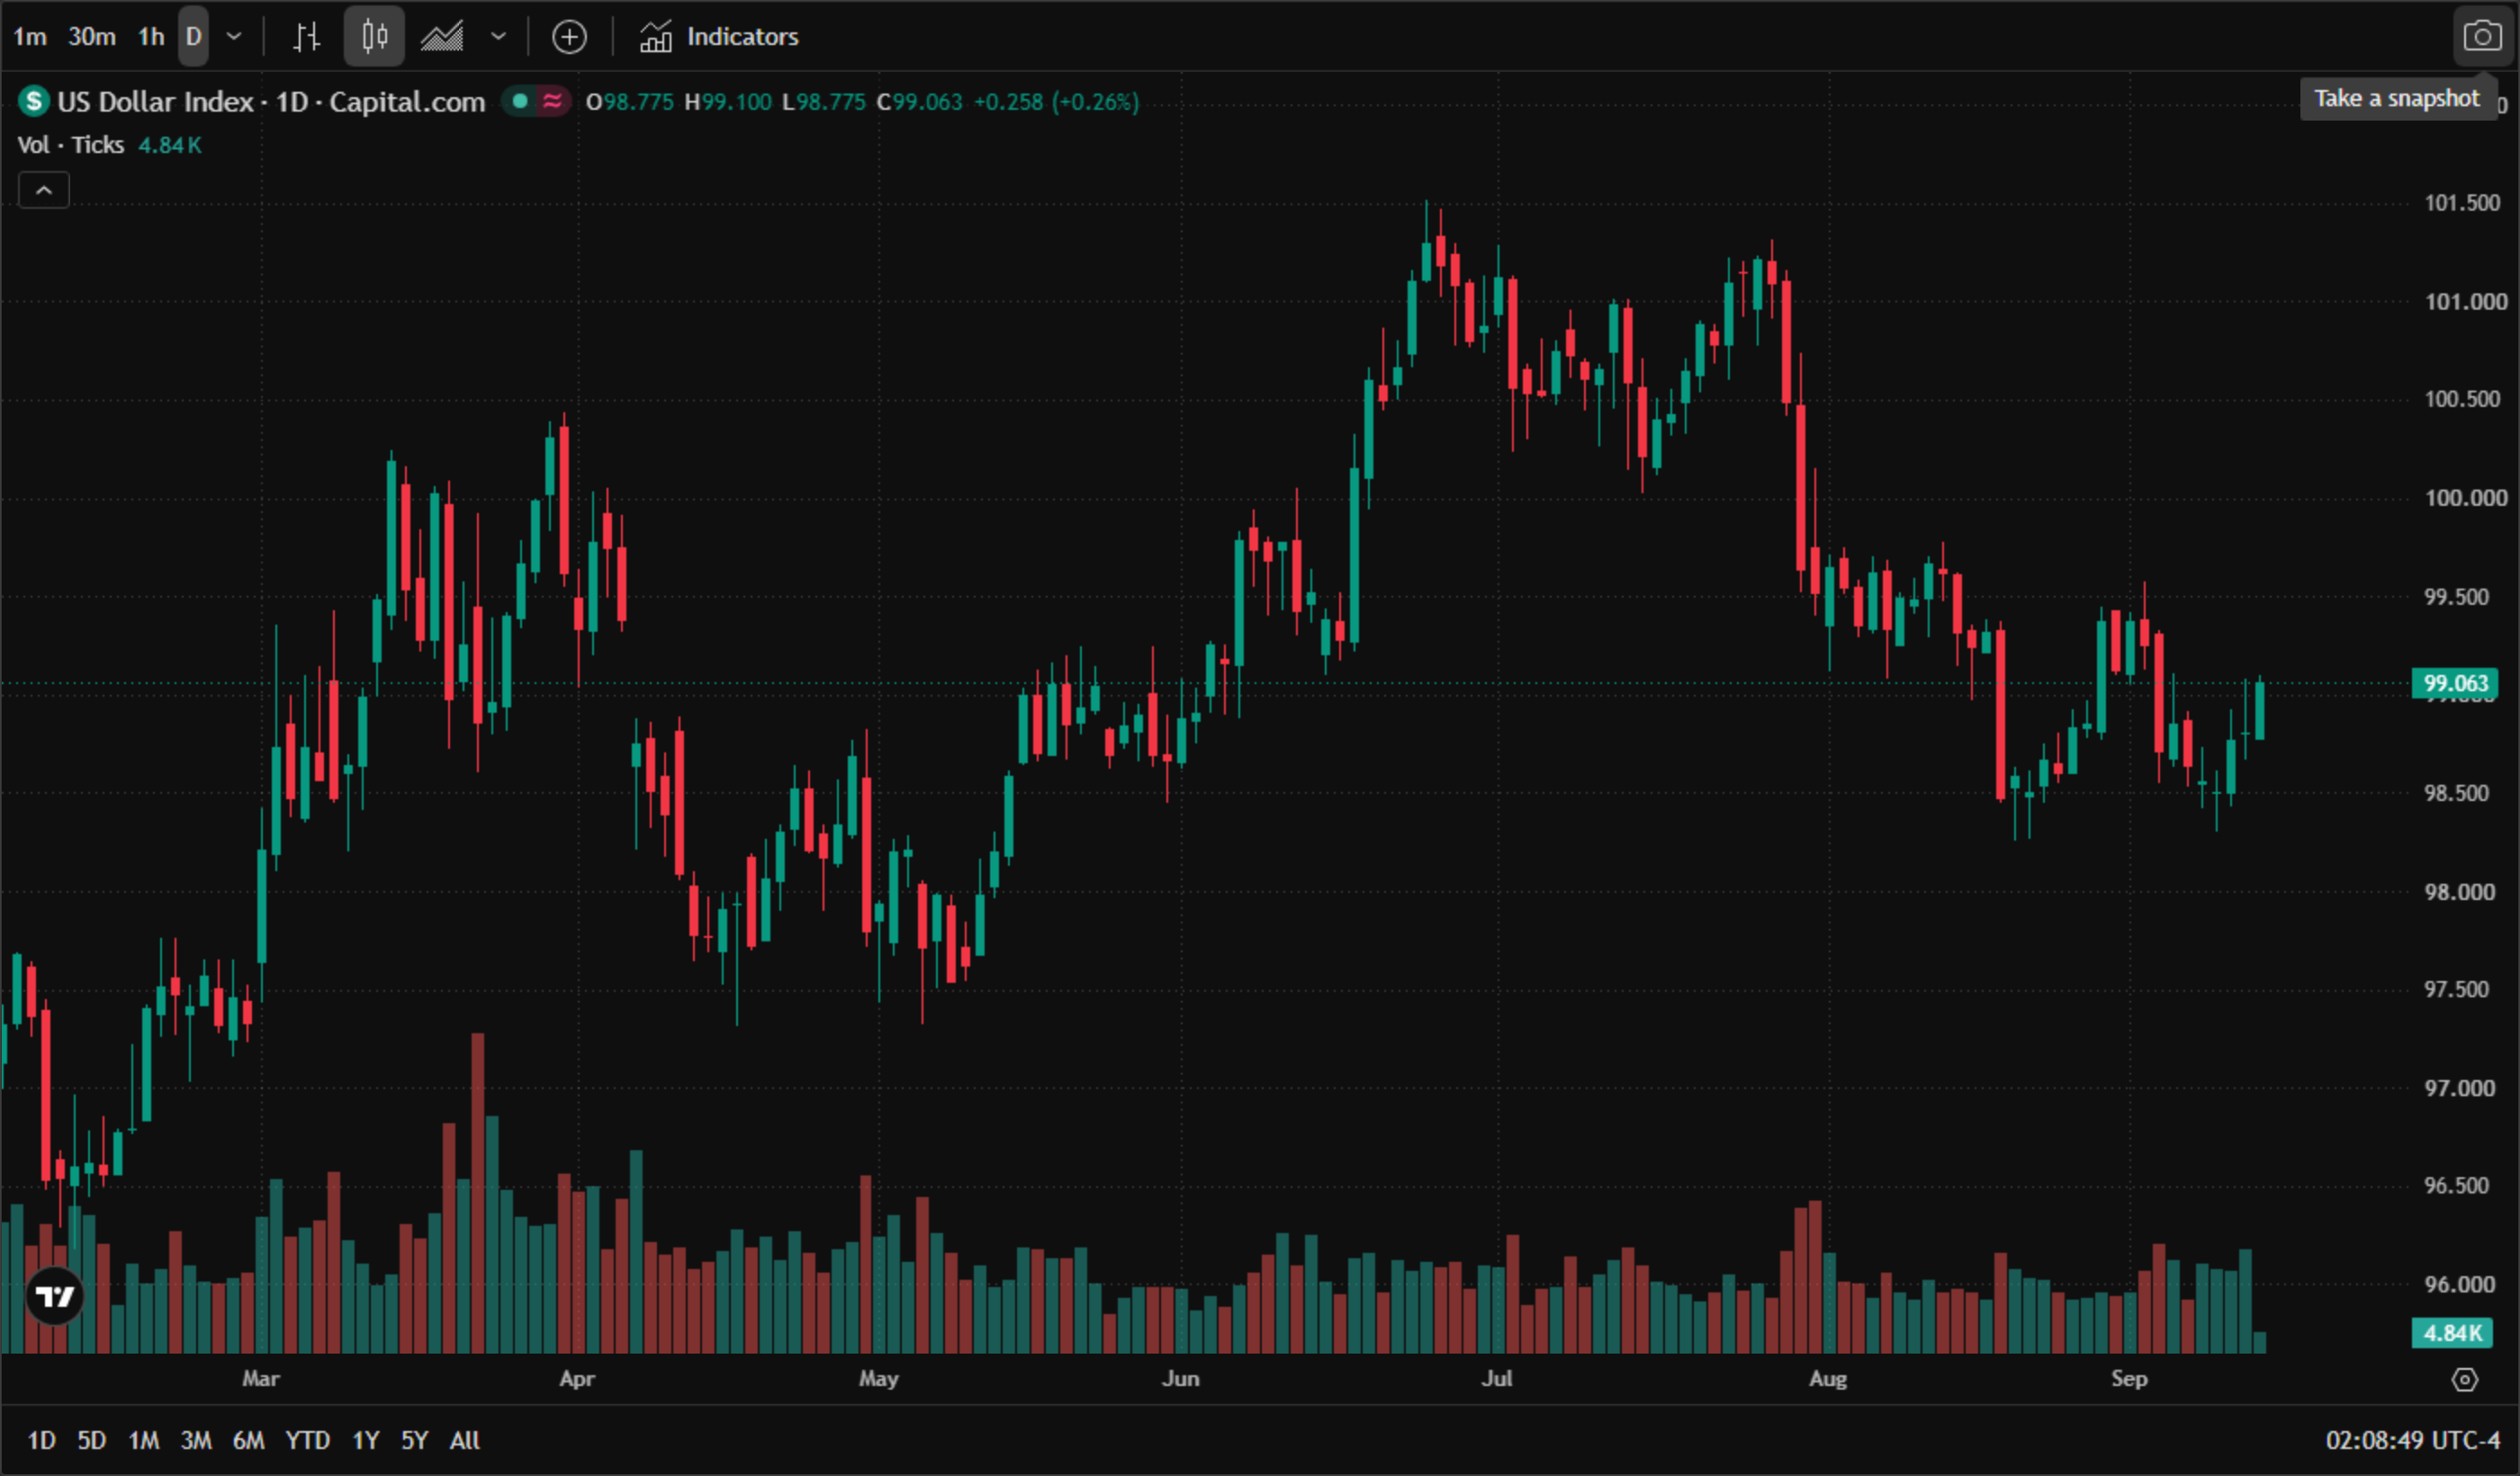
US Dollar Index (DXY) daily chart (official TradingView chart screenshot, Capital.com data feed, real daily candles and volume from March to September 2026, English interface) — the index climbed from around 97.5 early in the year, was rejected near 101.5 in April, fell to roughly 96.0 in July and rebounded to just under the 100 handle in August; as of 14 September 2026, 2:06 am ET, it traded at 99.048, up 0.243 (+0.25%) on the session, having opened at 98.775 with a high of 99.060 and a low of 98.775.

* Chart source: official TradingView chart screenshot, Capital.com data feed (US Dollar Index), captured 14 September 2026 at 2:06 am ET.

Two scenarios, and the one markets are under-pricing

  • Scenario one: a 25bp hike with a hawkish dot plot. This is the base case. The 10-year Treasury yield, currently around 4.97%, pushes toward 5%; the dollar consolidates above 99 and takes aim at 100; gold extends its slide toward $4,300 and the S&P 500 stays under pressure, with rate-sensitive growth and semiconductor names hit hardest.

  • Scenario two: a 25bp hike delivered dovishly. A "buy the rumour, sell the fact" setup. Because roughly nine in ten traders already expect the move, the larger move on the day is arguably more likely in this direction — a dot plot that does not endorse a second hike would send the dollar lower, gold higher on short-covering, and equities into a relief rally. Some strategists frame the whole exercise as an insurance hike closer to 1997 than to a sustained tightening cycle, in which case the hike itself could mark the peak of rate fear.

  • Scenario three: no change. The lowest-probability outcome and the most disruptive. It would raise questions about the Fed's commitment to its inflation target and push long-end yields and volatility higher rather than lower.

Key levels into the decision

  • US Dollar Index — 99 is the pivot. The index sits at 99.048. Holding above 99 keeps 100 in play; a dovish read would target 98.5.

  • Gold — $4,300 is the line in the sand. Spot gold trades at $4,333.39, down 0.37% on the session and lower for a third consecutive week. Immediate support sits at the $4,300 round number, which also marked last week's low; below that, $4,263. Resistance is $4,350 and then $4,380.

  • S&P 500 — 7,500 is the floor. The index is at 7,619.60, down 0.48%, having spent September fading from its August peak. Support at 7,500; resistance at 7,700.
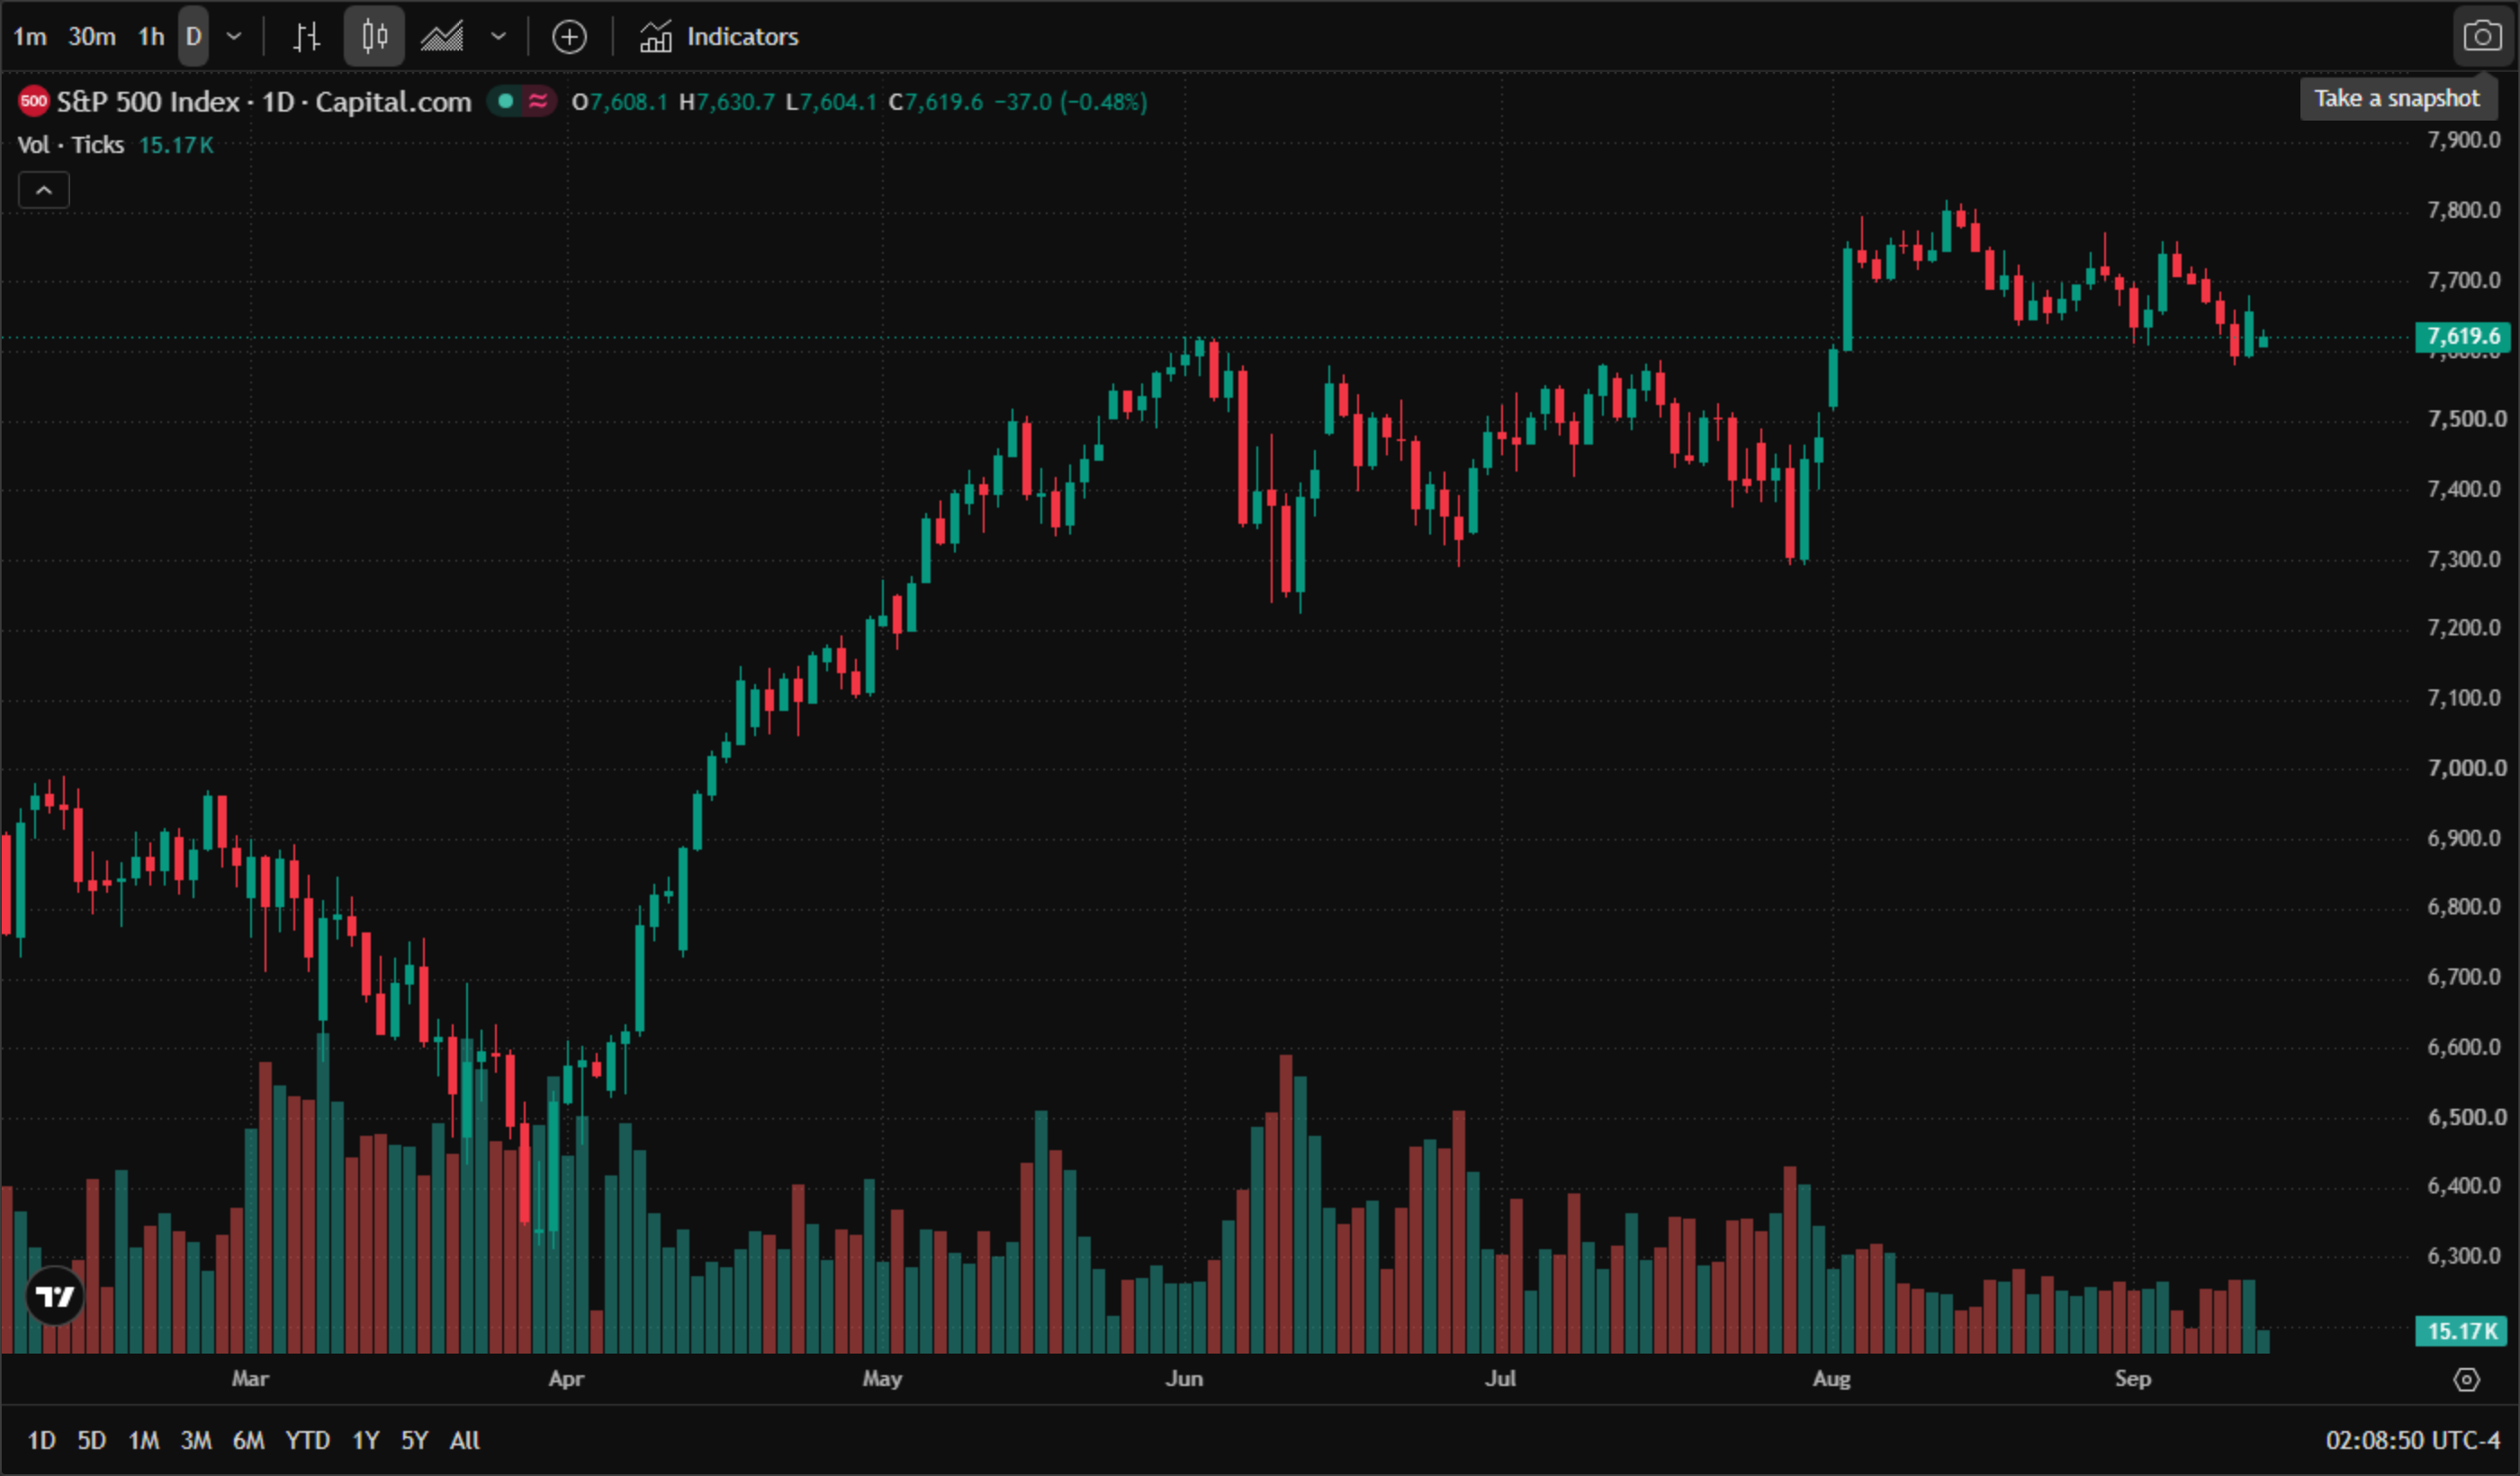
S&P 500 Index daily chart (official TradingView chart screenshot, Capital.com data feed, real daily candles and volume from March to September 2026, English interface) — the index bottomed near 6,350 in early April, rallied through the summer to a peak just above 7,800 in August and has since drifted sideways; as of 14 September 2026, 2:08 am ET, it traded at 7,619.6, down 37.0 (-0.48%) on the session, having opened at 7,608.1 with a high of 7,630.7 and a low of 7,604.1.

* Chart source: official TradingView chart screenshot, Capital.com data feed (S&P 500 Index), captured 14 September 2026 at 2:08 am ET.
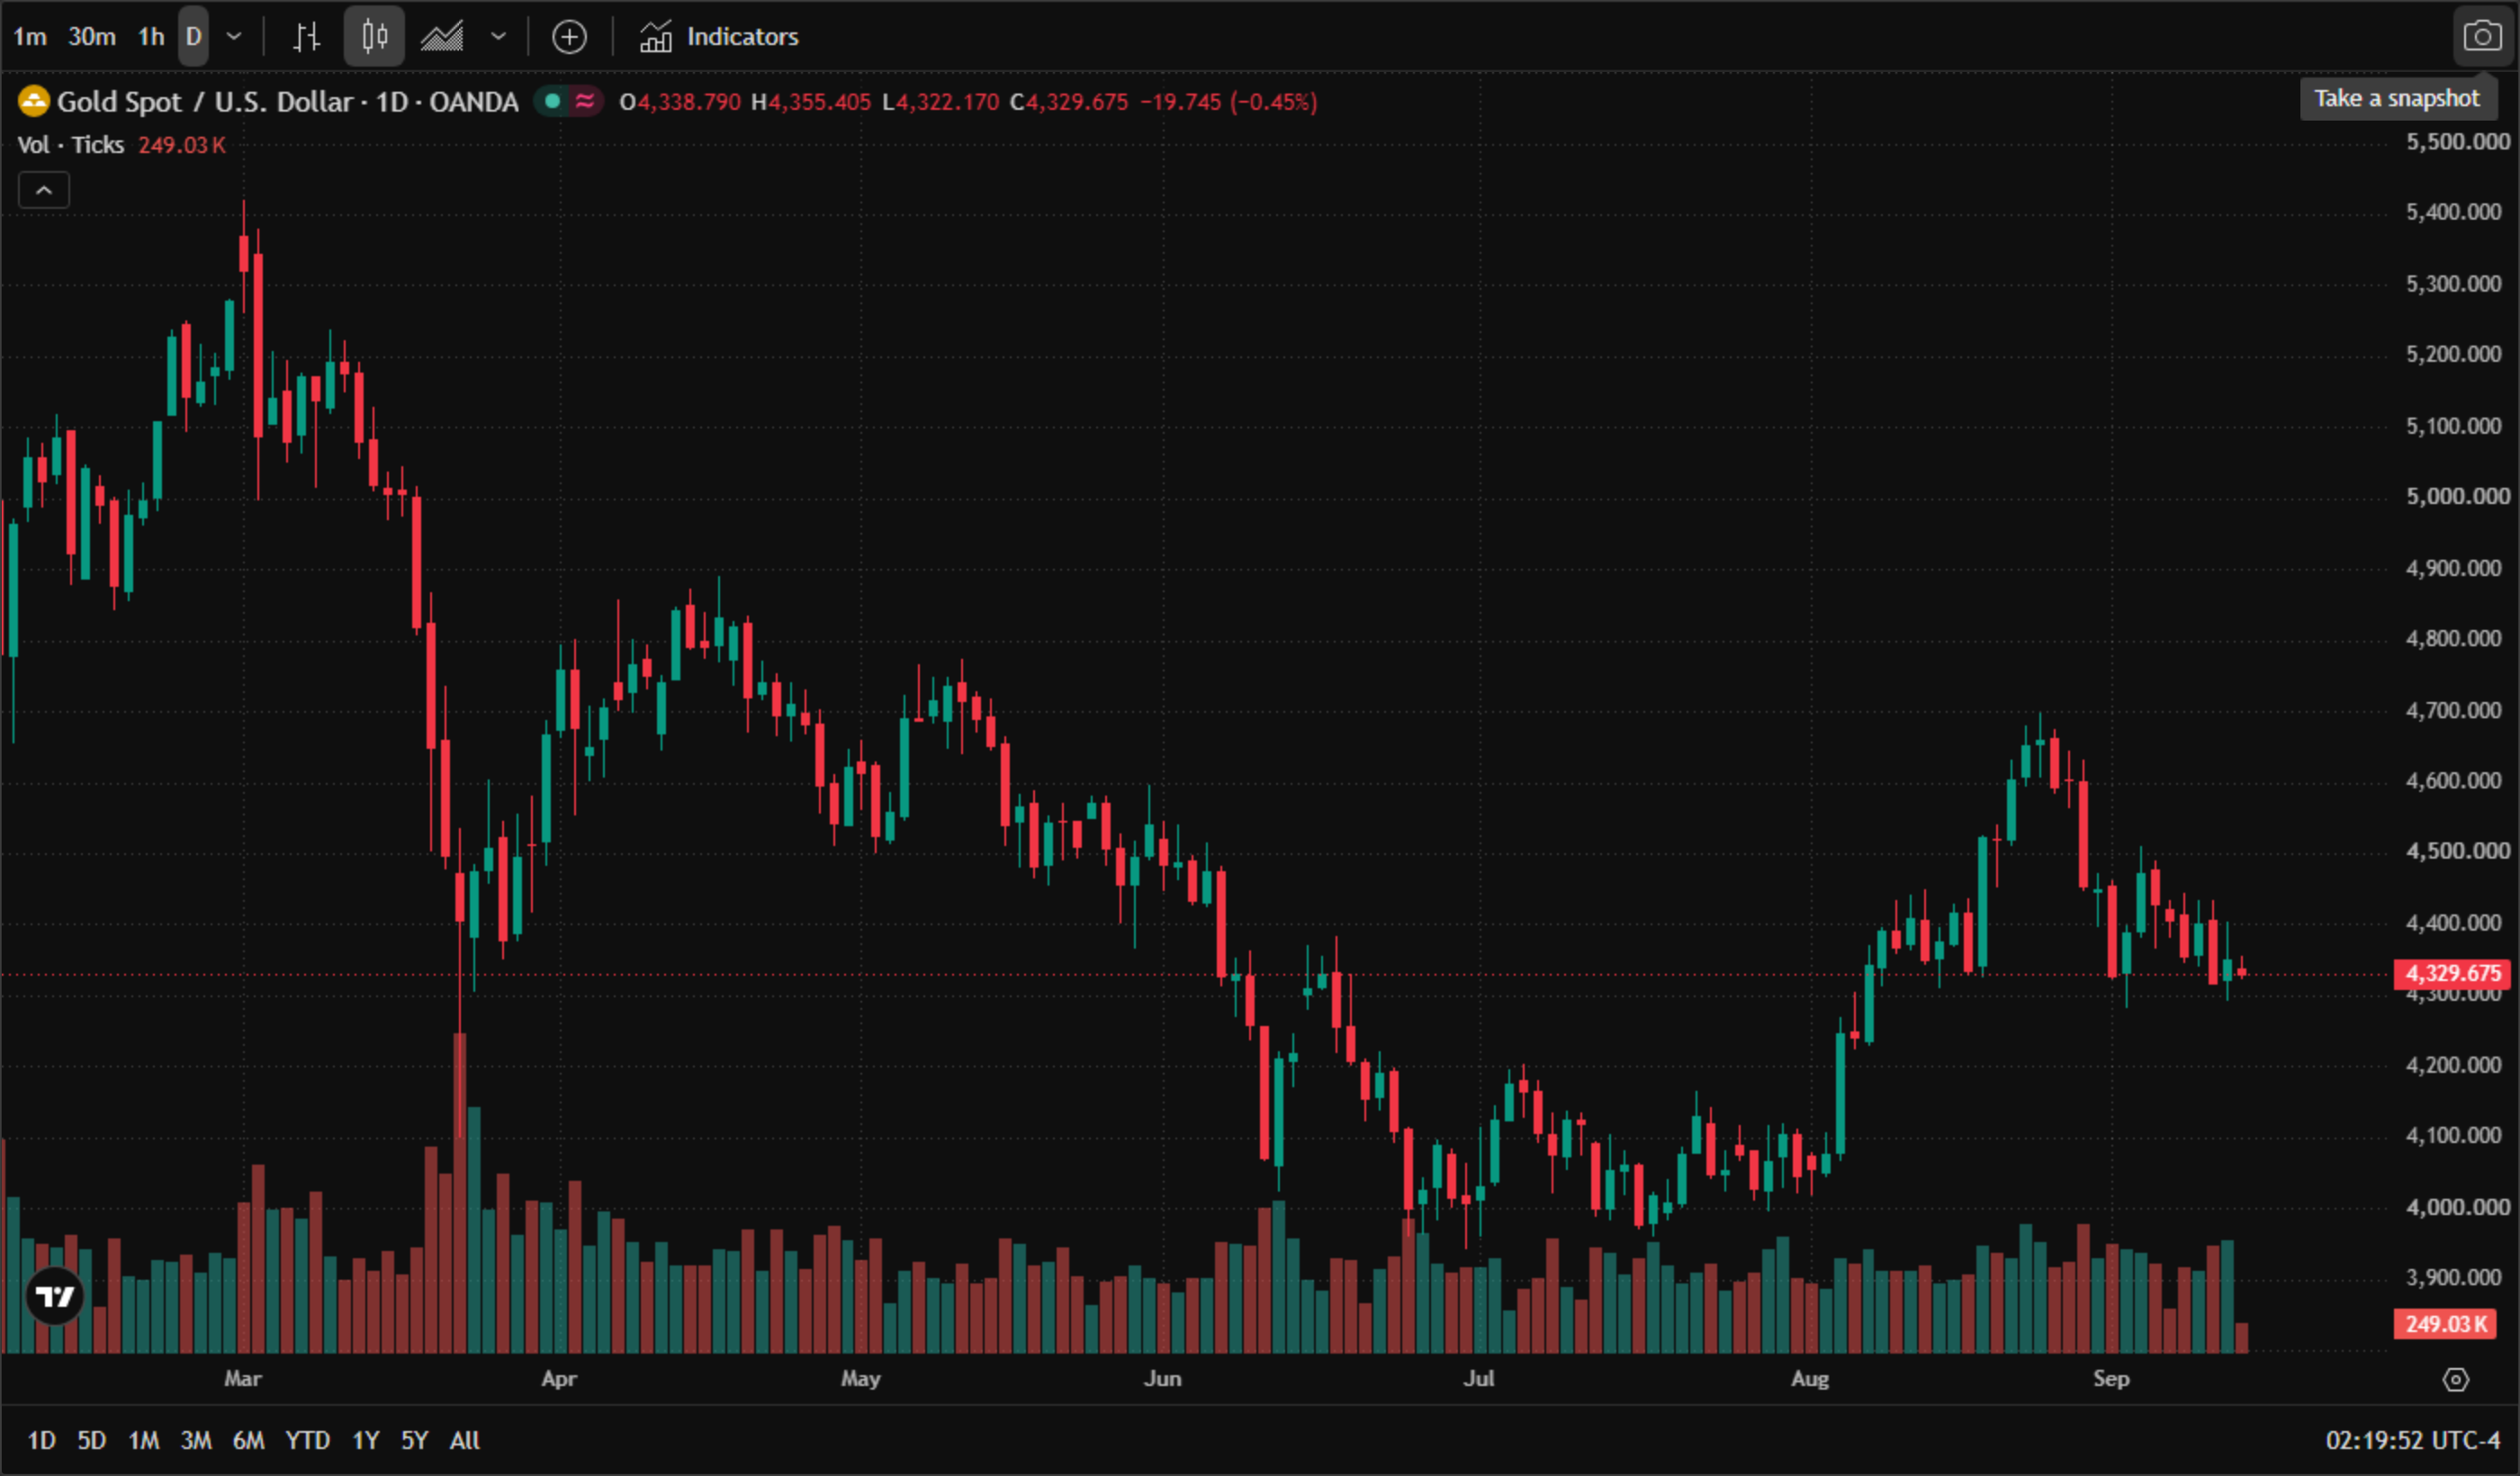
Spot gold (XAUUSD) daily chart (official TradingView chart screenshot, OANDA data feed, real daily candles and volume from March to September 2026, English interface) — gold peaked near $5,400 early in the year, fell to roughly $4,000 in July, rebounded to about $4,700 in August and has since rolled over into a third consecutive weekly decline; as of 14 September 2026, 2:08 am ET, it traded at $4,333.39, down $16.03 (-0.37%) on the session, having opened at $4,338.79 with a high of $4,355.41 and a low of $4,322.17.

* Chart source: official TradingView chart screenshot, OANDA data feed (XAU/USD CFD), captured 14 September 2026 at 2:08 am ET.

What to watch beyond the decision

  • The dot plot is the real event. With the hike itself close to fully priced, the marginal information comes from how many 2026 increases the committee is willing to signal. One and done is a very different market than three.

  • Oil is the wildcard the Fed does not control. If the shipping disruption in the region escalates further, inflation expectations could shift up again — and the market would start pricing the next meeting rather than debating this one.

  • There is an information vacuum afterwards. The next FOMC meeting is not until late October, with only one September PCE print in between. Positioning should account for that: scale in rather than press a single direction, and keep stops tight.

Read more

  • Gold Price Forecast: PPI and Oil Prices Fuel Inflation Concerns, Can CPI Change Gold's Direction?
  • Note: If you want to share the article 《Fed hike odds near 90% into Wednesday's decision — how to trade the dollar, gold and the S&P 500》, make sure you retain the original link. For more information, please visit Insights or browse www.mitrade.com.

    * The content presented above, whether from a third party or not, is considered as general advice only.  This article should not be construed as containing investment advice, investment recommendations, an offer of or solicitation for any transactions in financial instruments.

    goTop
    quote
    Related Articles
    placeholder
    TradingKey Daily Market Briefing: CPI Data Boosts Rate Hike Expectations, Geopolitical Risks Spark Oil Price SurgeTracking Market TrendsTradingKey - The three major U.S. stock indices rose across the board last Friday, with the Dow Jones Industrial Average rising 0.98%, the Nasdaq Composite Index gaining 0.96%, a
    Author  TradingKey
    20 hours ago
    Tracking Market TrendsTradingKey - The three major U.S. stock indices rose across the board last Friday, with the Dow Jones Industrial Average rising 0.98%, the Nasdaq Composite Index gaining 0.96%, a
    placeholder
    Gold Price Forecast: PPI and Oil Prices Fuel Inflation Concerns, Can CPI Change Gold's Direction?As of the Asian session on September 11, gold prices (XAUUSD) remained in weak consolidation today after dropping sharply to near $4,300 on Thursday, with the latest price trading around
    Author  TradingKey
    Sep 11, Fri
    As of the Asian session on September 11, gold prices (XAUUSD) remained in weak consolidation today after dropping sharply to near $4,300 on Thursday, with the latest price trading around
    placeholder
    US August CPI lands tonight: after a 5.4% PPI shock, will the Fed hike on September 16?US August PPI came in at 5.4% year-on-year, above the 5.3% consensus, with core PPI at 4.6%. Traders have pushed the odds of a 25bp Fed hike on September 15-16 to around 70%. Tonight's CPI is the last major inflation print before the decision — here is the full calendar, the consensus numbers, and what a hot versus cool reading would mean for the dollar, yields, gold and stocks.
    Author  Irene Q.
    Sep 11, Fri
    US August PPI came in at 5.4% year-on-year, above the 5.3% consensus, with core PPI at 4.6%. Traders have pushed the odds of a 25bp Fed hike on September 15-16 to around 70%. Tonight's CPI is the last major inflation print before the decision — here is the full calendar, the consensus numbers, and what a hot versus cool reading would mean for the dollar, yields, gold and stocks.
    placeholder
    TradingKey Daily Market Briefing: WTI Oil Tops $100, US Stocks Fall for 4th Day, Apple Bucks Trend, CPI AheadTracking Market TrendsTradingKey - On September 10 Eastern Time, the three major US stock indices fell for the fourth consecutive trading day. US August PPI showed upstream price pressures continued t
    Author  TradingKey
    Sep 11, Fri
    Tracking Market TrendsTradingKey - On September 10 Eastern Time, the three major US stock indices fell for the fourth consecutive trading day. US August PPI showed upstream price pressures continued t
    placeholder
    US August CPI Preview: Will Inflation Reaccelerate? US Stocks, Dollar and Gold Face Key Test On Friday, September 11 (ET), the U.S. Bureau of Labor Statistics will release the Consumer Price Index (CPI) for August, the final major inflation report before the Federal Reserve's Sep
    Author  TradingKey
    Sep 10, Thu
    On Friday, September 11 (ET), the U.S. Bureau of Labor Statistics will release the Consumer Price Index (CPI) for August, the final major inflation report before the Federal Reserve's Sep
    Live Quotes
    Name / SymbolChart% Change / Price
    USDOLLAR-F
    USDOLLAR-F
    0.00%0.00
    US500
    US500
    0.00%0.00

    Gold Related Articles

    • 10 Best Day Trading Platforms for Beginners and Active Traders in 2026: A Practical Guide
    • What is Gold CFD? How to Trade Gold CFD With Mitrade Example
    • ​5 Best Paper Trading Platforms for 2026 (Free Demo Accounts for Beginners & Traders)
    • XAU/USD Gold Price Trend Analysis 2026: Will It Keep Rising?
    • Is Mitrade Right for You? A Complete Guide on How to Start Trading CFDs in 5 Steps
    • How and Where to Buy Gold in Australia? A Complete Guide for Beginners

    Click to view more