


Gold Price Analysis Today | Forex Gold Analysis | XAU/USD Analysis - October 26, 2026


Today's Gold Price
Gold price chart for today
*0% Commission and Low Spreads 0️⃣
*$50,000 in Free Virtual Funds 💰
*$100 New Customer Bonus 🎁
Gold (XAU/USD) traded around $3,996 on the morning of October 26, 2026, breaking below the psychologically important $4,000 support level and closing the week down more than 3.5%. The Hormuz crisis has pushed Brent crude to $117, accelerating inflation and pressuring the Fed to keep rates on hold. But experts say selling pressure has become overstretched, while the University of Michigan's inflation expectation has risen to 4.7%. The key question is whether gold can hold above $3,981–4,004 to build a rebound base.
Today's Key Points
| Key Points |
|
|
|
Hormuz crisis drives Brent crude above $117 to a four-year high, accelerating inflation and pressuring the Fed to keep rates on hold
Spot gold fell more than 3.5% to close the week in negative territory at $3,995.81 an ounce, while silver continued to decline. Military tensions in the Strait of Hormuz pushed Brent crude to $117 a barrel, its highest level in more than four years, while WTI rose above $103 after 28 attacks on commercial vessels in October, driving freight costs to record highs.
The energy crisis has reignited inflation concerns, leading investors to believe that the Fed may need to maintain a restrictive policy to control inflation. This has temporarily overshadowed gold's safe-haven status as markets face liquidity-raising liquidation pressure amid concern that the conflict could escalate after the U.S. midterm elections in early November.
Gold breaks below the psychologically important $4,000 support level, but experts say selling pressure is becoming overstretched and see scope for a rebound
Spot gold broke below the psychologically important $4,000 level into the $3,992–3,996 range. Ole Hansen of Saxo Bank said a break below $4,065 triggered consecutive stop-loss orders. But hedge-fund short positioning is approaching an extreme, while long-term institutional buying remains strong, which could trigger a sharp rebound soon.
This is consistent with Roukaya Ibrahim of BCA Research, who said the decline stemmed from cross-market liquidity strain. The deviation from the 200-day moving average has reached levels last seen in late July, which had been a reversal base. Neil Welsh of Britannia added that central banks continue to buy, suggesting prices are building a sideways base rather than entering a new downtrend.
University of Michigan consumer sentiment holds at 48 as inflation expectations rise to 4.7%; markets watch this week's FOMC meeting
The University of Michigan reported October consumer sentiment at 48.0, above expectations of 46.3. But one-year inflation expectations rose to 4.7% and long-term expectations reached 3.5%, the highest since May, reinforcing signs that inflation is becoming entrenched in the U.S. economy amid surging crude prices.
Meanwhile, the U.S. composite PMI remained strong at 57.6, while selling prices accelerated at their fastest pace since August 2022. Investors are watching the October 27–28 FOMC meeting and core PCE inflation data on Thursday night for signs of whether the Fed will signal a December rate increase.



Technical Analysis of Gold (XAU/USD)
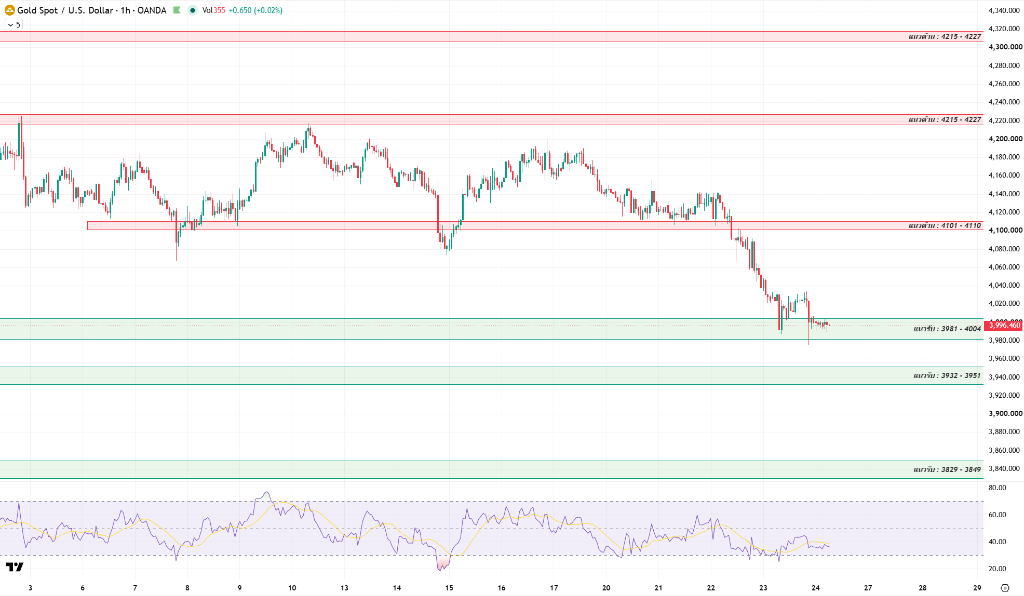
On the 1-hour chart, gold broke below $4,000 to test first support at $3,981–4,004, trading around $3,996.46. Selling pressure is beginning to slow as the market attempts to build a base. Although price remains below all moving averages, the failure to make a new low below $3,970 leaves room for a new base to form.
The RSI is starting to rise from oversold territory to 35–37 and is beginning to form higher lows, indicating that selling pressure is easing and buying interest is returning to absorb liquidity. This supports the potential for a technical rebound to relieve near-term stress.
The key decision point is reclaiming and holding above $4,004 to confirm rejection of further downside and open a recovery toward first resistance at $4,101–4,110. Until then, however, watch for a bull trap that could accelerate the next leg lower.
Holding above support at $3,981–4,004 would open the way for a recovery toward $4,101–4,110 and $4,215–4,227. But a break below $3,981 would open further downside toward the next support at $3,932–3,951 and major support at $3,829–3,849, respectively.
Today's Gold Price Outlook
| Scenarios |
|
|
|
Today's Trading Strategy
Short-term traders should trade the range cautiously. Avoid chasing short positions when price is near support and the RSI is starting to rise; wait for a reversal candlestick around support before opening a position.
- Buy setup: Consider a position if prices pull back to test the $3,981–4,004 support zone and show clear buying support, or follow a break and hold above $4,004, targeting $4,101–4,110 with a stop-loss below $3,970.
- Sell setup: Consider a position if prices rebound to test resistance at $4,101–4,110 or $4,215–4,227 and fail, or on a break below $3,981, targeting $3,932–3,951 with a stop-loss above resistance.
For long-term investors, fundamental factors and central-bank buying remain strong. Consider accumulating gradually only after prices build a base above $3,981–4,004 support or pull back to test major support at $3,932–3,951.
Daily Support and Resistance Levels
| Type | Price Level |
| Support #1 | $3,981–4,004 |
| Support #2 | $3,932–3,951 |
| Support #3 | $3,829–3,849 |
| Resistance #1 | $4,101–4,110 |
| Resistance #2 | $4,215–4,227 |
| Resistance #3 | $4,315–4,327 |
Today's Questions (FAQ)
Why does crude oil above $117 put pressure on gold prices?
Higher crude prices reignite inflation concerns, leading markets to expect the Fed to keep rates high for longer, strengthening the dollar and raising the opportunity cost of holding gold. They also trigger liquidity-driven selling, temporarily overshadowing gold's safe-haven status.
Why do experts believe a break below $4,000 may reflect overstretched selling?
The deviation from the 200-day moving average has reached the level seen in late July, which had been a reversal base. Combined with hedge-fund short positioning nearing an extreme and continued central-bank buying, this points to a short-term correction rather than a new downtrend.
Read more
The above content was completed with the assistance of AI and has been reviewed by an editor.


