


Gold Price Analysis Today | Forex Gold Analysis | XAU/USD Analysis - October 23, 2026


Today's Gold Price
Gold price chart for today
*0% Commission and Low Spreads 0️⃣
*$50,000 in Free Virtual Funds 💰
*$100 New Customer Bonus 🎁
Gold (XAU/USD) traded around $4,018 on the morning of October 23, 2026, falling to test key support after coming under heavy selling pressure of more than $119. The Strait of Hormuz crisis has driven oil higher and accelerated inflation, while U.S. jobless claims have fallen to a three-month low. But softer Treasury yields and Gabelli's $5,000 target are still providing support. The key question is whether gold can hold above $4,017–4,040 to build a rebound base.
Today's Key Points
| Key Points |
|
|
|
Precious metals face heavy selling as gold falls to $4,018 amid a Hormuz crisis that drives oil higher and accelerates inflation
Spot gold fell more than $119, or 2.88%, to $4,018.91 an ounce, while silver tumbled nearly 6% to $54.44 after military tensions in the Strait of Hormuz drove crude prices sharply higher. This reignited inflation concerns and led markets to assess that the Fed may need to maintain a tight monetary stance or signal further rate increases.
Although the 10-year U.S. Treasury yield eased amid a selloff in technology stocks, gold did not receive support from its safe-haven status. This indicates that markets are facing liquidation pressure to raise liquidity and risk-reducing portfolio adjustments ahead of the Fed blackout period. Markets place an 84% probability on the Fed holding rates next week, but continue to watch the December meeting.
U.S. jobless claims fall to a three-month low, reinforcing the view of a resilient labor market
The U.S. Labor Department said initial jobless claims fell to 194,000, below expectations of 200,000, while the four-week average declined to 197,750. Both marked three-month lows, or the lowest levels since late July, showing that the labor market remains highly resilient and U.S. businesses are still slowing layoffs.
Labor-market strength is keeping gold below $4,100 because it reduces the chances that the Fed will accelerate interest-rate cuts, helping the dollar remain elevated. Investors are watching tonight's flash manufacturing and services PMI releases, along with the University of Michigan consumer-sentiment report, for further economic signals.
Gabelli says the energy crisis only delays the $5,000 target and reiterates that gold-mining shares remain deeply undervalued
Chris Mancini of the Gabelli Gold Fund said that, if the Strait of Hormuz conflict had eased since summer, gold would already have broken above $5,000. Although higher oil prices are fueling inflation and weighing on gold in the short term, he sees this only as a temporary obstacle delaying the advance toward the long-term target.
Mancini said high interest rates and energy costs will hurt the economy and eventually force the Fed to reverse course. He added that gold-mining shares are generating substantial cash flow while gold holds above $4,000, with strong balance sheets and valuations still far below historical averages.



Technical Analysis of Gold (XAU/USD)
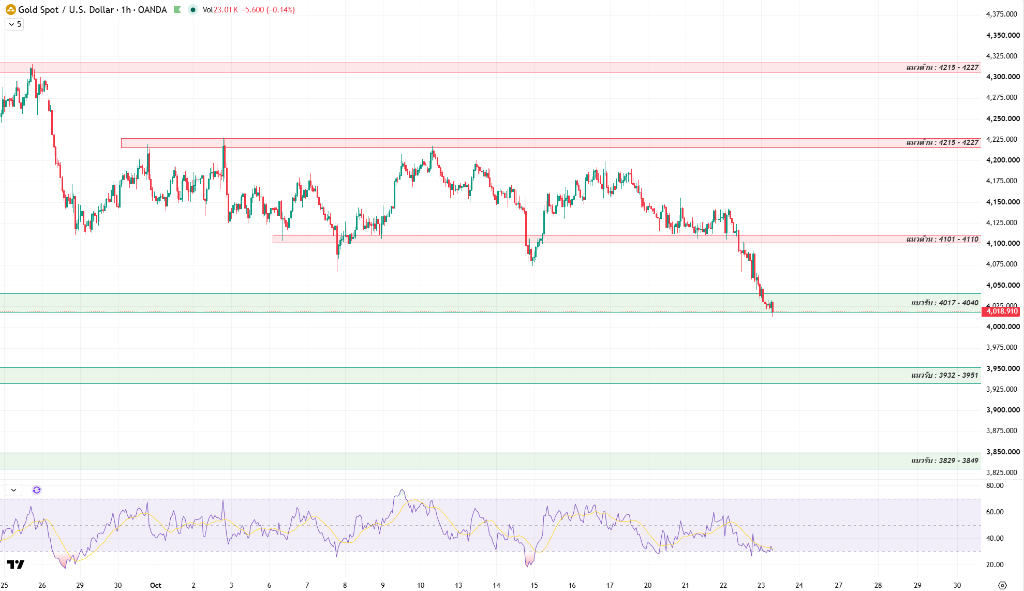
On the 1-hour chart, gold broke below minor support and fell to test the first support zone at $4,017–4,040, trading around $4,018.91. Unrelenting selling without support has damaged the short-term momentum structure, but a test of the lower boundary of major support is a key test of the market's ability to absorb selling pressure.
The RSI has plunged to 24–26, entering deeply oversold territory. This suggests selling pressure is becoming extremely stretched and opens the possibility of a technical rebound or short-covering at any time if buying support begins to emerge.
The key decision point is reclaiming $4,040 to open the way for a test of first resistance at $4,101–4,110. But if the rebound fails and selling resumes, watch for a bull trap that could accelerate the next leg lower.
Holding above $4,017–4,040 would open the way for a recovery toward $4,101–4,110 and $4,215–4,227. But a break below $4,017 would open further downside toward the next support levels at $3,932–3,951 and $3,829–3,849, respectively.
Today's Gold Price Outlook
| Scenarios |
|
|
|
Today's Trading Strategy
Short-term traders should cautiously trade the range. Avoid chasing short positions in the support zone while the RSI is deeply oversold, and wait for a reversal candlestick around support before opening a position.
- Buy setup: Consider a position if prices pull back to test the $4,017–4,040 support zone and show clear buying support, or follow a break and hold above $4,110, targeting $4,215–4,227 with a stop-loss below $4,000.
- Sell setup: Consider a position if prices rebound to test resistance at $4,101–4,110 or $4,215–4,227 and fail, or on a break below $4,017, targeting $3,932–3,951 with a stop-loss above resistance.
For long-term investors, fundamental factors and Gabelli's outlook continue to support the $5,000 target. Consider accumulating gradually only after prices build a base or pull back to test major support at $3,932–3,951 and $3,829–3,849.
Daily Support and Resistance Levels
| Type | Price Level |
| Support #1 | $4,017–4,040 |
| Support #2 | $3,932–3,951 |
| Support #3 | $3,829–3,849 |
| Resistance #1 | $4,101–4,110 |
| Resistance #2 | $4,215–4,227 |
| Resistance #3 | $4,315–4,327 |
Today's Questions (FAQ)
Why did gold fall sharply even though U.S. Treasury yields declined?
Cross-market liquidity-driven selling, together with oil's rise from the Hormuz crisis that reignited inflation concerns, made investors worry that the Fed would keep rates high for longer, overshadowing gold's safe-haven status.
Why does Gabelli view the energy crisis as only delaying gold's advance toward $5,000?
Although energy-driven inflation may keep the Fed tight in the short term, expensive interest rates and oil will hurt the economy and eventually force the Fed to cut rates, which would support gold's advance toward the $5,000 target.
Read more
The above content was completed with the assistance of AI and has been reviewed by an editor.


