




US CPI data set to ease in October as markets reassess Fed rate hike expectations
- The US Consumer Price Index is expected to rise by 0.3% MoM in October.
- Monthly core CPI inflation is expected to soften to 0.2% from 0.3% in September.
- The inflation report, combined with geopolitical headlines and the stock market action, could influence the US Dollar valuation in the near term.
The US Bureau of Labor Statistics (BLS) will publish the October Consumer Price Index (CPI) data on Tuesday, a release that could influence the US Dollar (USD) valuation as investors reassess the Federal Reserve’s (Fed) interest-rate outlook.
The report won’t include 12-month percentage changes for most CPI series in this release, due to missing October 2025 monthly data because of the lack of collection during the government shutdown from October 1, 2025, to November 12, 2025.
“For most CPI series, BLS could not publish October 2025 indexes. As a result, BLS will not publish 12-month percent changes for October 2026 for indexes where October 2025 data are not available,” the BLS noted in a press release.
On a monthly basis, headline CPI is forecast to rise 0.3% following the 0.6% increase recorded in September, while the core CPI is seen increasing 0.2%, compared to 0.3% in the previous month.
Economists at Deutsche Bank see a clear moderation in the upcoming US inflation data. They note that “headline CPI [is] to rise by 0.20% month-on-month, down from 0.65% previously, with core CPI also up 0.20% after 0.33% last time.” Despite the anticipated softer prints, the bank’s team “continue[s] to expect 25bp rate increases at the December and March FOMC meetings, absent a further material tightening in financial conditions.”
Economic Indicator
Consumer Price Index (MoM)
Inflationary or deflationary tendencies are measured by periodically summing the prices of a basket of representative goods and services and presenting the data as The Consumer Price Index (CPI). CPI data is compiled on a monthly basis and released by the US Department of Labor Statistics. The MoM figure compares the prices of goods in the reference month to the previous month.The CPI is a key indicator to measure inflation and changes in purchasing trends. Generally, a high reading is seen as bullish for the US Dollar (USD), while a low reading is seen as bearish.
Read more.Next release: Tue Nov 10, 2026 13:30
Frequency: Monthly
Consensus: 0.3%
Previous: 0.6%
Source: US Bureau of Labor Statistics
The US Federal Reserve (Fed) has a dual mandate of maintaining price stability and maximum employment. According to such mandate, inflation should be at around 2% YoY and has become the weakest pillar of the central bank’s directive ever since the world suffered a pandemic, which extends to these days. Price pressures keep rising amid supply-chain issues and bottlenecks, with the Consumer Price Index (CPI) hanging at multi-decade highs. The Fed has already taken measures to tame inflation and is expected to maintain an aggressive stance in the foreseeable future.
How could the US Consumer Price Index report affect EUR/USD?
According to the CME FedWatch Tool, markets currently see about an 80% chance of the Federal Reserve (Fed) raising the policy rate by another 25 basis points (bps) at the last meeting of the year.
Speaking at a news conference after the Fed's decision to leave interest rates unchanged at a range of 3.75%-4.00% in October, Fed Chair Kevin Warsh described labor market conditions as “positive,” and added that the discussion among policymakers is focused mainly on the price stability mandate. The October employment report confirmed a robust labor market, with Nonfarm Payrolls (NFP) rising by 165K and the Unemployment Rate declining to 4.1% despite an uptick in the Labor Force Participation Rate.
In the meantime, crude Oil prices declined sharply last week as markets grew optimistic about a diplomatic resolution to the conflict in the Middle East following the Republicans’ defeat in the midterm elections. Although this recent fall won’t be reflected in October inflation figures, a notable downward surprise in the monthly CPI, with a print of 0.1% or lower, combined with an extended slide in energy prices could cause market participants to refrain from pricing in a rate hike in December. In this scenario, the US Dollar (USD) could come under sudden selling pressure and help EUR/USD gather bullish momentum in the near term.
Conversely, a reading at or above market expectations, coupled with a lack of progress in ceasefire negotiations with Iran, could reinforce an increase in interest rates next month. However, the market positioning suggests that the USD’s upside potential could remain limited in this scenario, paving the way for a short-lasting bearish reaction in EUR/USD.
At the same time, the action in stock markets could further influence the USD’s valuation and impact EUR/USD’s performance. An extended selloff in technology stocks could support the USD and cap EUR/USD gains even if inflation data arrive soft and reinforce a cautious Fed policy-tightening path.
Strategists at ING argue that the recent US Dollar strength is heavily contingent on risk sentiment, noting that “we think the dollar rally requires the risk-off mood to persist this week.” They caution that “Friday’s move looked a bit too stretched relative to short-term market drivers,” leaving “some moderate correction risk” if market nerves ease. Even so, ING believes the broader backdrop remains Dollar-supportive, with the “macro story”
“We expect tomorrow’s October US CPI to come in at 0.3% month-on-month for both headline (consensus 0.3%) and core (0.3%),” they add and note that such an outcome “should help cement expectations for a December Fed hike (19bp priced in), making the swap curve more protected from other equity market shocks.”
Eren Sengezer, European Session Lead Analyst, shares a brief technical outlook for EUR/USD:
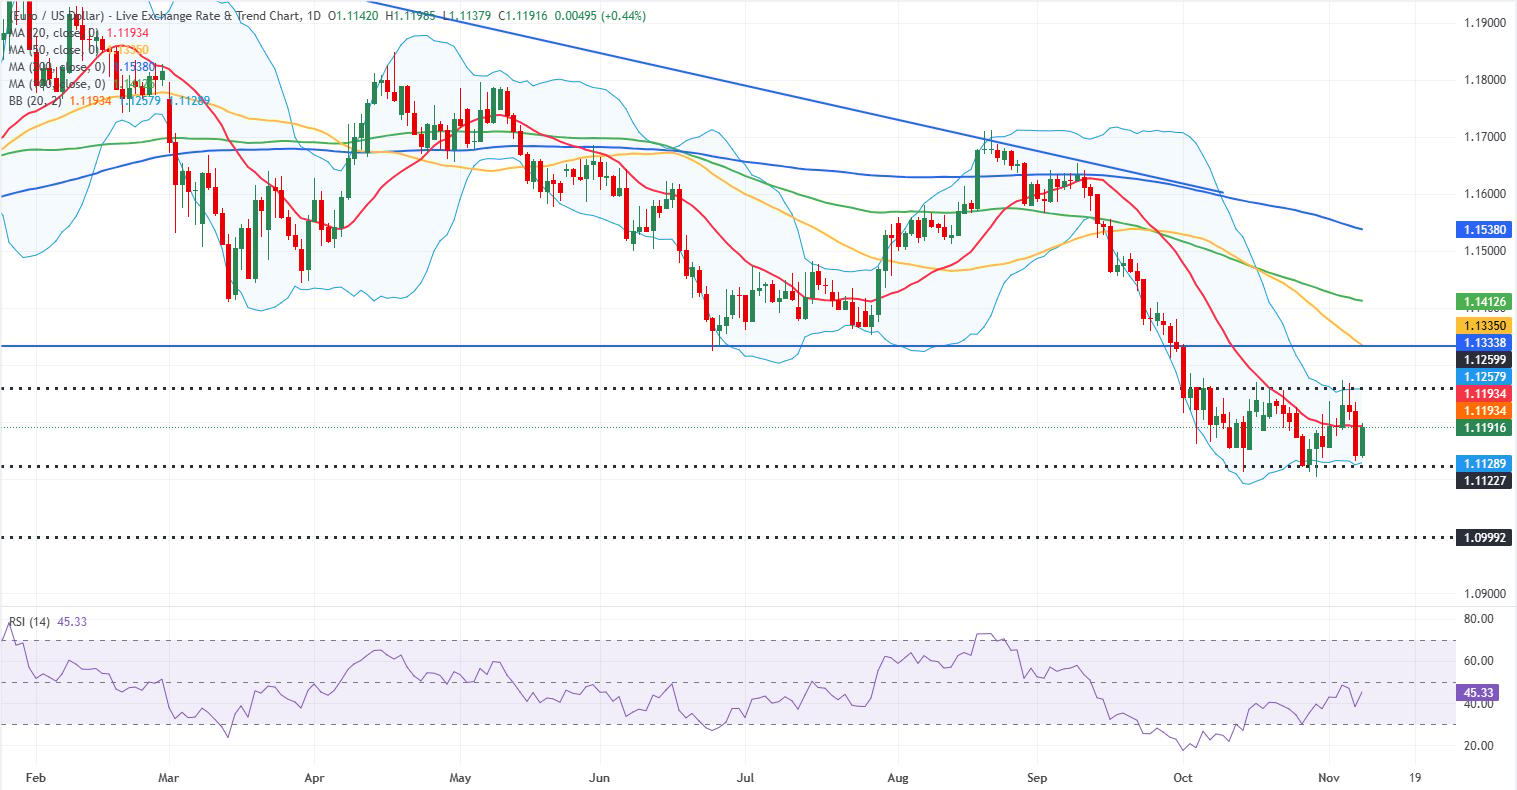
“The EUR/USD pair has been moving in a relatively narrow channel since the beginning of October. During last week’s post-midterm elections rally, the Relative Strength Index (RSI) indicator on the daily chart recovered toward 50 but failed to clear this level, highlighting buyers’ hesitancy.”
“On the upside, 1.1260 (upper arm of the Bollinger Bands, static level) aligns as the first resistance level ahead of 1.1335 (50-day Simple Moving Average (SMA), static level) and 1.1410 (100-day SMA). Looking south, the first support level could be spotted at 1.1130 (lower arm of the Bollinger Bands, static level). If this support fails and gets confirmed as resistance, technical sellers could take action and open the door for an extended drop toward 1.1000 (static level, round level).”
Inflation FAQs
Inflation measures the rise in the price of a representative basket of goods and services. Headline inflation is usually expressed as a percentage change on a month-on-month (MoM) and year-on-year (YoY) basis. Core inflation excludes more volatile elements such as food and fuel which can fluctuate because of geopolitical and seasonal factors. Core inflation is the figure economists focus on and is the level targeted by central banks, which are mandated to keep inflation at a manageable level, usually around 2%.
The Consumer Price Index (CPI) measures the change in prices of a basket of goods and services over a period of time. It is usually expressed as a percentage change on a month-on-month (MoM) and year-on-year (YoY) basis. Core CPI is the figure targeted by central banks as it excludes volatile food and fuel inputs. When Core CPI rises above 2% it usually results in higher interest rates and vice versa when it falls below 2%. Since higher interest rates are positive for a currency, higher inflation usually results in a stronger currency. The opposite is true when inflation falls.
Although it may seem counter-intuitive, high inflation in a country pushes up the value of its currency and vice versa for lower inflation. This is because the central bank will normally raise interest rates to combat the higher inflation, which attract more global capital inflows from investors looking for a lucrative place to park their money.
Formerly, Gold was the asset investors turned to in times of high inflation because it preserved its value, and whilst investors will often still buy Gold for its safe-haven properties in times of extreme market turmoil, this is not the case most of the time. This is because when inflation is high, central banks will put up interest rates to combat it. Higher interest rates are negative for Gold because they increase the opportunity-cost of holding Gold vis-a-vis an interest-bearing asset or placing the money in a cash deposit account. On the flipside, lower inflation tends to be positive for Gold as it brings interest rates down, making the bright metal a more viable investment alternative.
Recommended Articles


