




Dow Jones Industrial Average rips to records on borrowed tailwinds
- DJIA closed near record highs on Wednesday, up roughly 1% after a sharp afternoon rally.
- Cheaper Crude Oil and falling Treasury yields powered the late-day surge.
- Thursday's Core PCE release is the week's main catalyst and the biggest threat to the move.
The Dow Jones Industrial Average (DJIA) pushed into fresh record territory again on Wednesday, but the way it got there is worth a second look. The index added roughly 1% and closed near 52,200, just below the all-time high around 52,300. None of that came from earnings or growth surprises; it came from a falling Crude Oil price and a bond market that decided yields had gone far enough.
Crude Oil and softer yields did the lifting
The afternoon move tracked Crude Oil almost tick for tick. Both major benchmarks shed about 4% on the day, as the geopolitical risk premium kept draining out of the energy complex on the back of the Versailles peace framework. Implementation talks have stalled and the fighting in Lebanon has not stopped, so this is a fragile sort of calm; markets are treating it as durable anyway.
A cheaper barrel feeds straight into the disinflation story, which in turn pulled Treasury yields lower, with the 10-year note slipping below 4.5%. That combination flatters the Dow specifically. Its heavy weighting in industrials, financials, and dividend payers responds far more to the cost of money than the technology-led indices do, so a softer yield backdrop is close to tailor-made for this index.
The Dow's lack of chip exposure is suddenly a feature
It also helped that the Dow sat out the worst of this week's technology wobble. The semiconductor selloff that hit the Nasdaq on Tuesday barely touched an index with little chip exposure, and Wednesday's rotation out of stretched tech found a home in the Dow's value and cyclical components.
That edge is about to narrow as Alphabet replaces Verizon in the index, a swap that hands the Dow a far larger technology footprint. For now the change reads as a tailwind, since Alphabet rallied on the news.
Momentum is loud but stretched
The intraday chart is a textbook reversal: the index bottomed near 51,550 in early afternoon trade with the five-minute Stochastic Relative Strength Index (Stoch RSI) pinned in the low single digits, about as oversold as the reading gets, before ripping roughly 700 points into the close. That same reading now sits near 88, deep in overbought territory.
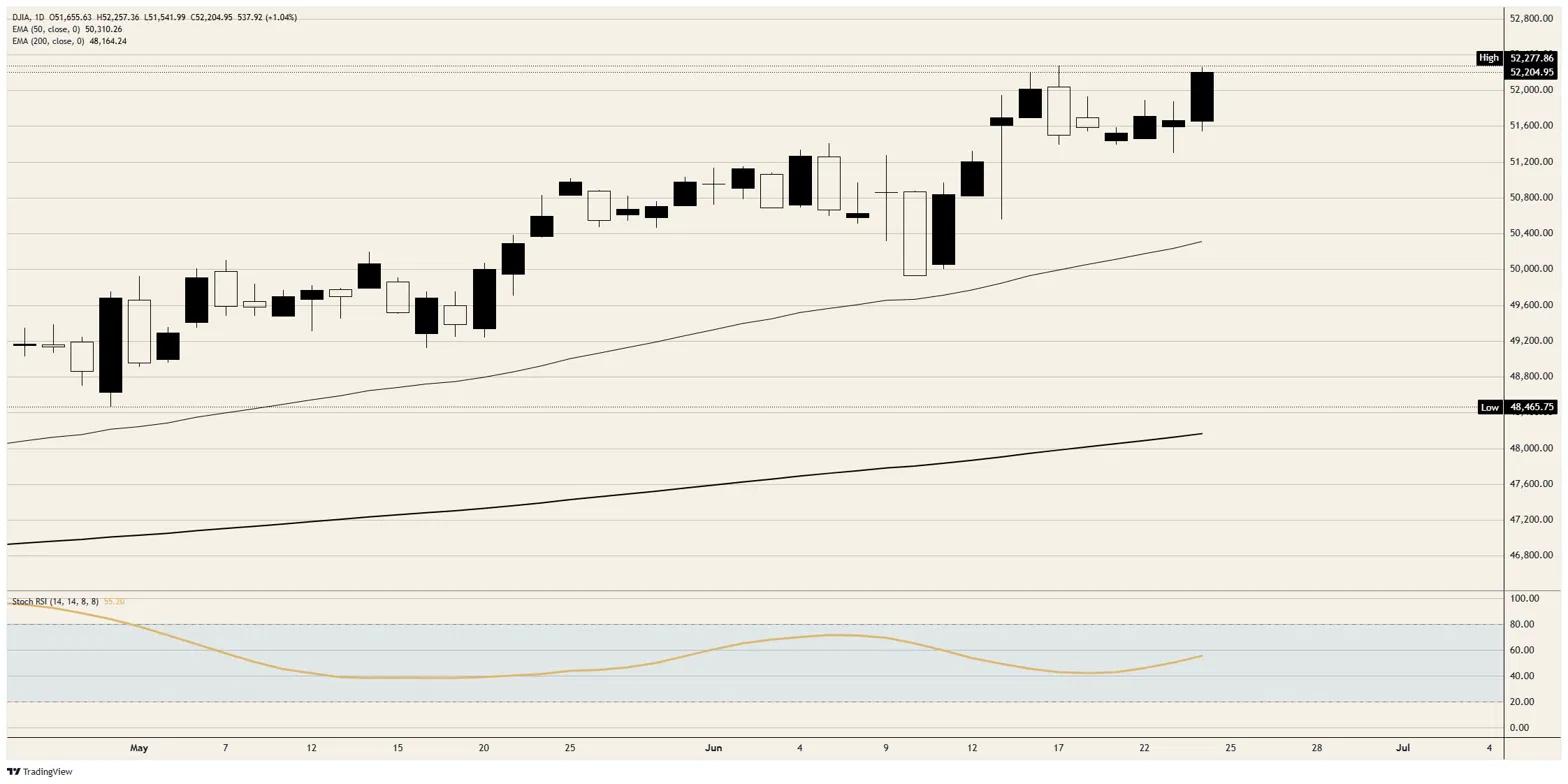
On the daily chart the picture is healthier. The daily Stoch RSI is only around 55 and curling up, which leaves room before the trend looks exhausted, and price sits well above the 50-day Exponential Moving Average (EMA) near 50,300. The trend structure is firmly higher; it is the speed of the latest leg, not the direction, that invites caution.
Core PCE is the only number that matters
All of this runs straight into Thursday's main event at 12:30 GMT, when the Core Personal Consumption Expenditures (PCE) Price Index lands. Consensus looks for 0.3% on the month and 3.4% on the year, both a tenth higher than the prior readings, which is the awkward part. The market spent Wednesday celebrating disinflation through a cheaper barrel while the Federal Reserve's (Fed) preferred inflation gauge is expected to show core prices speeding up, not slowing down.
The headline PCE figures point the same way, with the annual rate seen ticking up toward 4%, and the data lands inside a crowded 12:30 GMT slot alongside final first-quarter Gross Domestic Product (GDP), durable goods, and jobless claims, with Fed officials due to speak that evening. With the Fed having held at 3.75% and turned more hawkish in June, a hot Core PCE would hand the doves nothing and could puncture a rally built on the opposite assumption.
Resistance: The immediate ceiling is the record zone, with Wednesday's high near 52,250 and the all-time high around 52,300 sitting just overhead. A daily close above there opens blue sky, where the next round-number magnet is 52,500.
Levels to watch
Support: First support sits at 52,000, the level the afternoon breakout cleared and the most likely spot for dip buyers to step in. Below that, Wednesday's low near 51,550 marks the launchpad for the entire move; losing it would signal the rally has genuinely stalled rather than paused.
Bias: Bullish. The trend, the momentum, and the macro tailwind all point the same way, and pullbacks toward 52,000 read as opportunities rather than reversals. The one thing that changes the call is Thursday's Core PCE: a hot print paired with a close back under 51,550 would be the signal that the borrowed tailwinds have been repossessed.
Dow Jones daily chart
Dow Jones FAQs
The Dow Jones Industrial Average, one of the oldest stock market indices in the world, is compiled of the 30 most traded stocks in the US. The index is price-weighted rather than weighted by capitalization. It is calculated by summing the prices of the constituent stocks and dividing them by a factor, currently 0.152. The index was founded by Charles Dow, who also founded the Wall Street Journal. In later years it has been criticized for not being broadly representative enough because it only tracks 30 conglomerates, unlike broader indices such as the S&P 500.
Many different factors drive the Dow Jones Industrial Average (DJIA). The aggregate performance of the component companies revealed in quarterly company earnings reports is the main one. US and global macroeconomic data also contributes as it impacts on investor sentiment. The level of interest rates, set by the Federal Reserve (Fed), also influences the DJIA as it affects the cost of credit, on which many corporations are heavily reliant. Therefore, inflation can be a major driver as well as other metrics which impact the Fed decisions.
Dow Theory is a method for identifying the primary trend of the stock market developed by Charles Dow. A key step is to compare the direction of the Dow Jones Industrial Average (DJIA) and the Dow Jones Transportation Average (DJTA) and only follow trends where both are moving in the same direction. Volume is a confirmatory criteria. The theory uses elements of peak and trough analysis. Dow’s theory posits three trend phases: accumulation, when smart money starts buying or selling; public participation, when the wider public joins in; and distribution, when the smart money exits.
There are a number of ways to trade the DJIA. One is to use ETFs which allow investors to trade the DJIA as a single security, rather than having to buy shares in all 30 constituent companies. A leading example is the SPDR Dow Jones Industrial Average ETF (DIA). DJIA futures contracts enable traders to speculate on the future value of the index and Options provide the right, but not the obligation, to buy or sell the index at a predetermined price in the future. Mutual funds enable investors to buy a share of a diversified portfolio of DJIA stocks thus providing exposure to the overall index.
Recommended Articles


