




Ripple and Stellar outlook: XRP and XLM extend recovery as bears lose steam
- XRP extends gains, trading above $1.30 on Thursday after closing above the upper trendline of a falling channel pattern.
- XLM trades above $0.168, heading toward the next key resistance at $0.173.
- Improving derivatives metrics and modestly strengthening momentum support a potential for further recovery for both altcoins.
Ripple (XRP) and Stellar (XLM) extend their recovery on Thursday as bearish pressure begins to ease for both altcoins. XRP trades above $1.30 after breaking above the upper trendline of a falling channel pattern, while XLM holds above $0.168 and approaches resistance at $0.173. Meanwhile, improving derivatives metrics and strengthening momentum indicators hint at a potential for further recovery.
Improving derivatives metrics
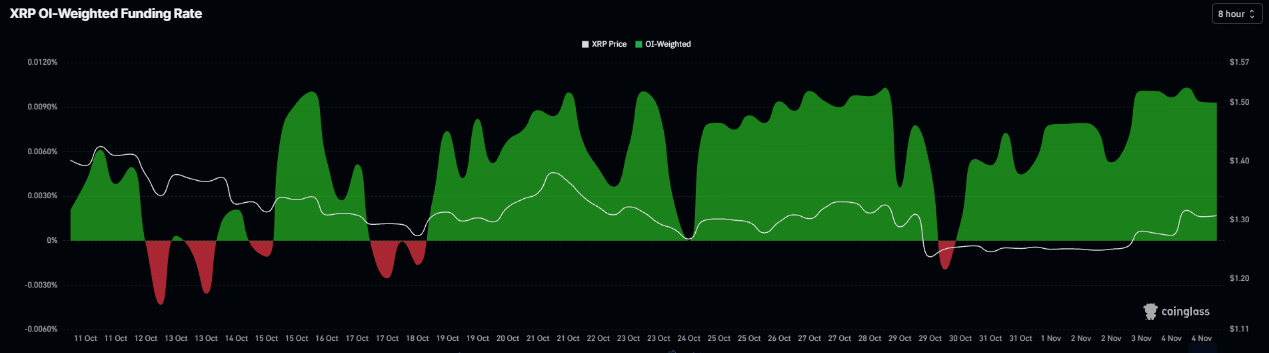
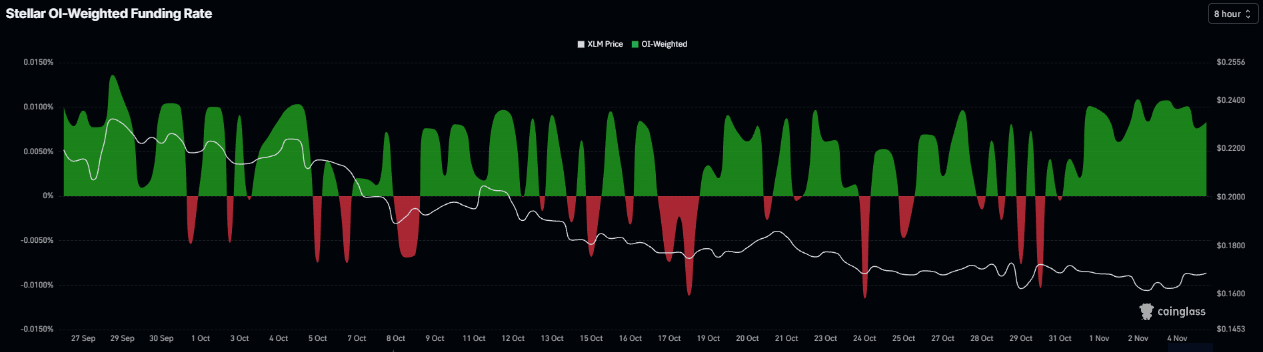
Derivatives data shows mildly improving conditions for Ripple and Stellar. The CoinGlass chart below shows that the funding rates of both altcoins flipped positive on October 30, surging to 0.0093% for XRP and 0.0084% for XLM on Thursday. These positive rates indicate that longs are paying shorts and suggest a mild bullish outlook.
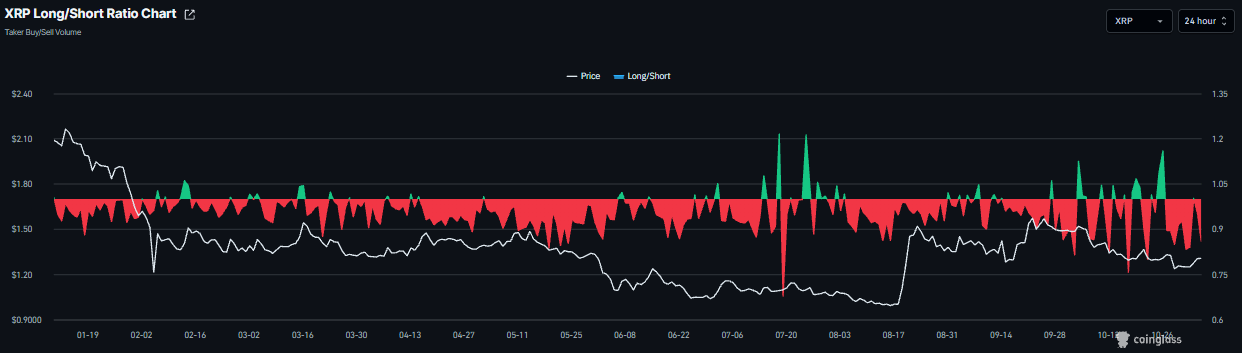
However, CoinGlass’ long-to-short ratios for XRP remained in negative territory, reading 0.85 on Thursday. A ratio below one indicates bearish sentiment, as traders bet that asset prices will fall, capping XRP’s potential recovery.
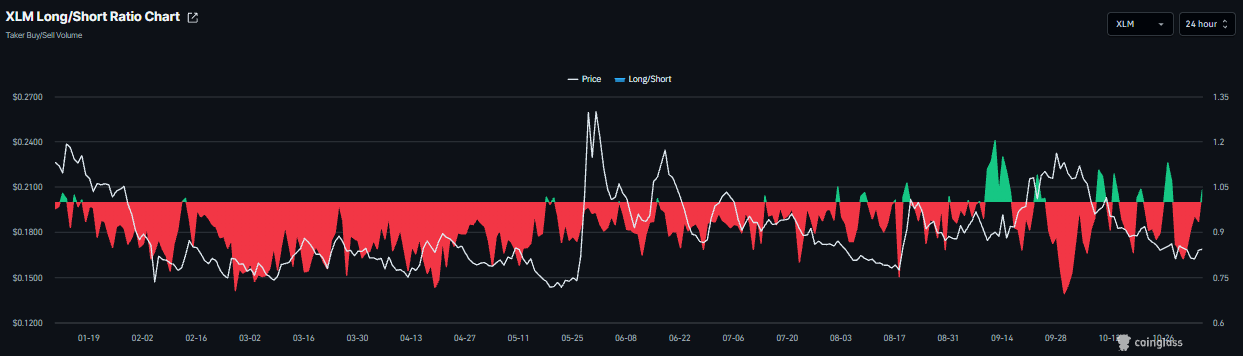
Meanwhile, XLM’s long-to-short ratio flipped into positive territory, reading 1.05 on Thursday and indicating a modest bullish outlook.
XRP technical outlook: Mildly constructive bias
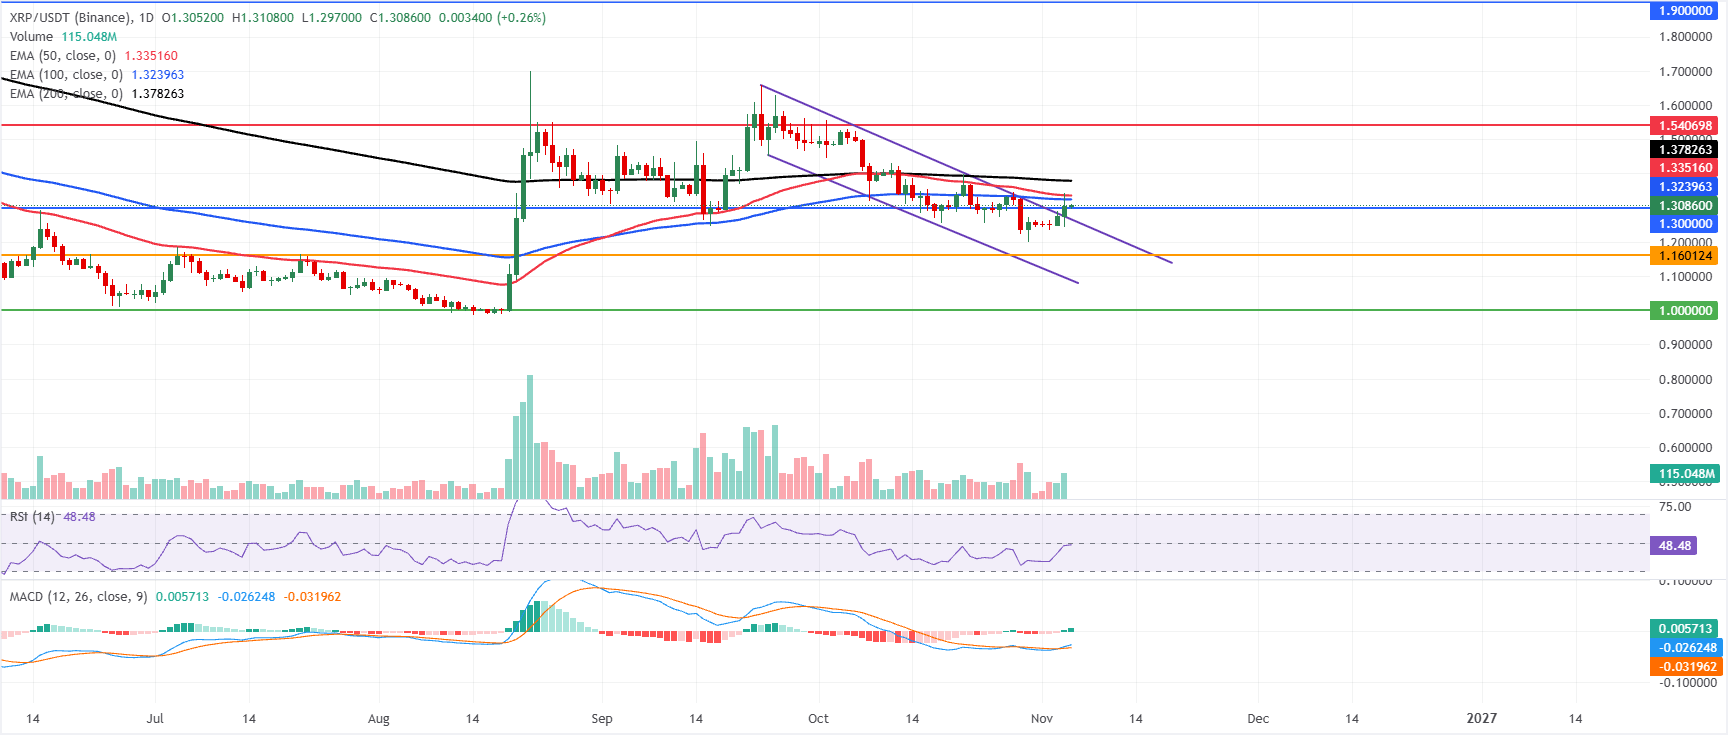
XRP price trades at $1.308 on Thursday, maintaining a mildly constructive bias as it closes above the upper trendline of the falling channel pattern. However, XRP is still capped below its key Exponential Moving Averages (EMAs). The 100-day EMA at $1.323, the 50-day EMA at $1.335 and the 200-day EMA at $1.378 all sit overhead, suggesting the pair remains capped despite a modest improvement in momentum.
The Relative Strength Index (RSI) at 48 is near neutral. At the same time, the Moving Average Convergence Divergence (MACD) shows the line slightly above zero with a positive crossover, hinting at waning downside pressure but not yet overcoming the dominant overhead structure.
On the downside, immediate support is around the previously broken upper trendline at $1.265; a daily close below this would expose deeper support at $1.160 and $1.000.
On the topside, initial resistance is offered by the 100-day EMA at $1.323, ahead of the 50-day EMA at $1.335 and the 200-day EMA at $1.378; a sustained move above these moving averages would be needed to ease the bearish bias and open the way toward the next horizontal barriers at $1.540 and $1.900.
XLM technical outlook: Fading sellers’ strength
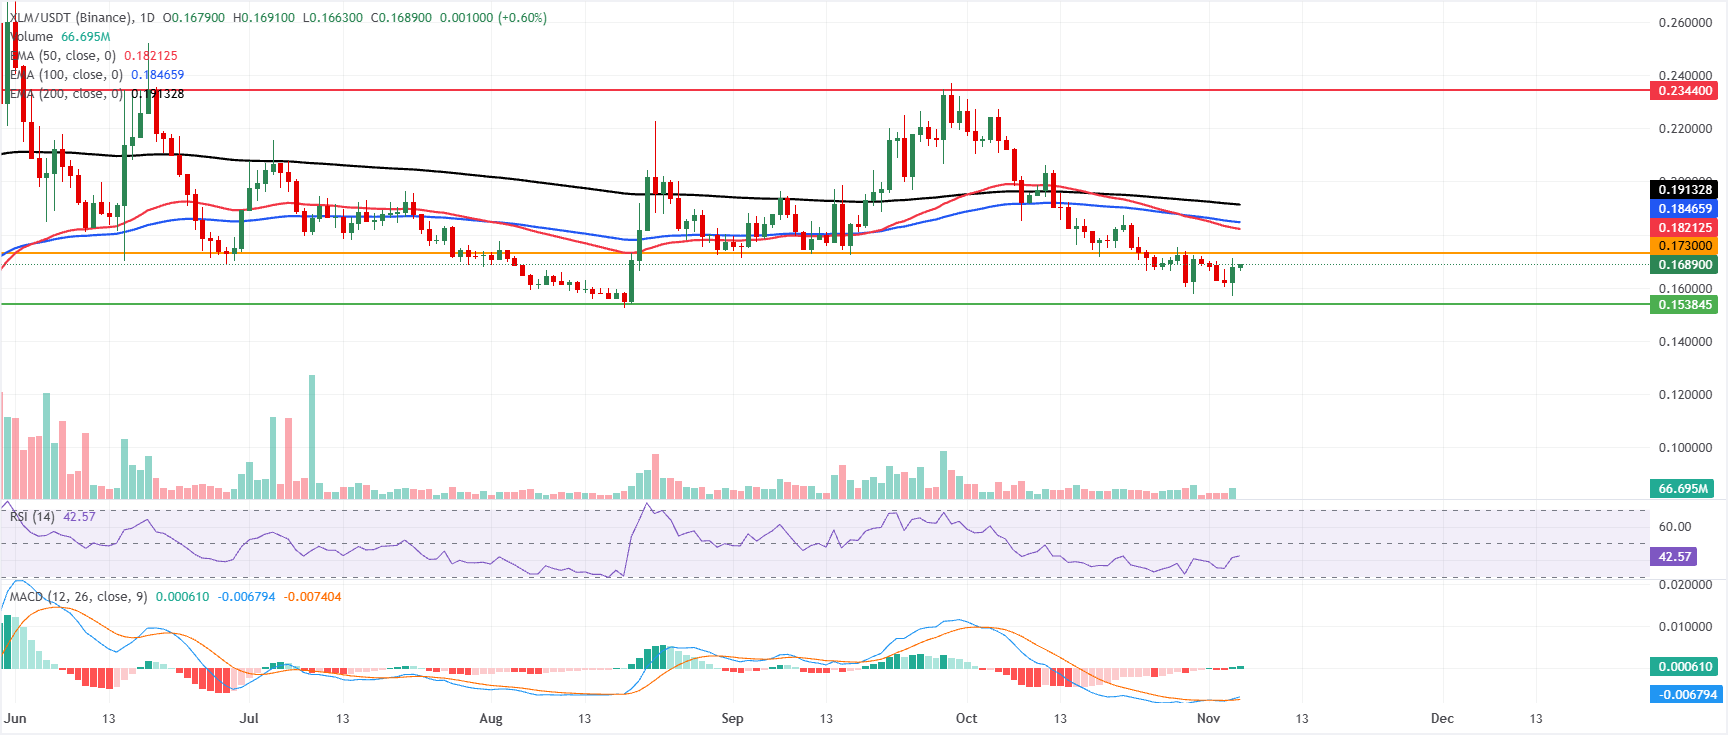
XLM price trades at $0.169 on Thursday and remains under pressure, holding below the 50-day, 100-day and 200-day EMAs at $0.182, $0.184 and $0.191, which collectively cap the upside and sustain a bearish near-term bias.
The Relative Strength Index (RSI) hovers around 42, reflecting soft demand. At the same time, the Moving Average Convergence Divergence (MACD) has turned marginally positive, hinting that bearish momentum is waning but not yet reversed as long as price stays below these key averages.
On the topside, initial resistance is located at the horizontal barrier near $0.173, with successive hurdles at the 50-day EMA at $0.182 and the 100-day EMA at $0.184, ahead of the 200-day EMA at $0.191. More distant resistance stands at $0.234, marking a stronger supply zone if buyers regain control.
On the downside, the next meaningful support is seen at the horizontal level around $0.153, where a break would likely expose the pair to a deeper corrective leg despite the improving MACD profile.
(The technical analysis of this story was written with the help of an AI tool. Know more.)
Recommended Articles


