




Crypto Today: Bitcoin, Ethereum, XRP hold gains after a brief bounce
- Bitcoin recovery gathers momentum above $83,000 as bulls stage a slow comeback.
- Ethereum edges higher, supported by a strong medium to long-term moving average support cluster.
- XRP buyers are tightening their grip, aiming to retain control of the trend as the token nears $1.35.
Cryptocurrency prices are broadly rising on Wednesday, with Bitcoin (BTC) trading above $83,000. Altcoins uphold a similar outlook, led by majors Ethereum (ETH) and Ripple (XRP). The largest smart contract token, ETH, hovers at $2,455, up on the second straight day, while XRP ticks higher near $1.35.
“Bitcoin spent another week in tight consolidation with shrinking volumes, soft derivatives activity and narrowing volatility,” K33 Research said in the weekly Ahead of The Curve report, adding, “Price kept drifting lower and briefly dipped below $80,000 on Thursday as equities sold off on a hot Consumer Price Index (CPI) print and a steep semiconductor sell-off.”
Risk appetite steadies
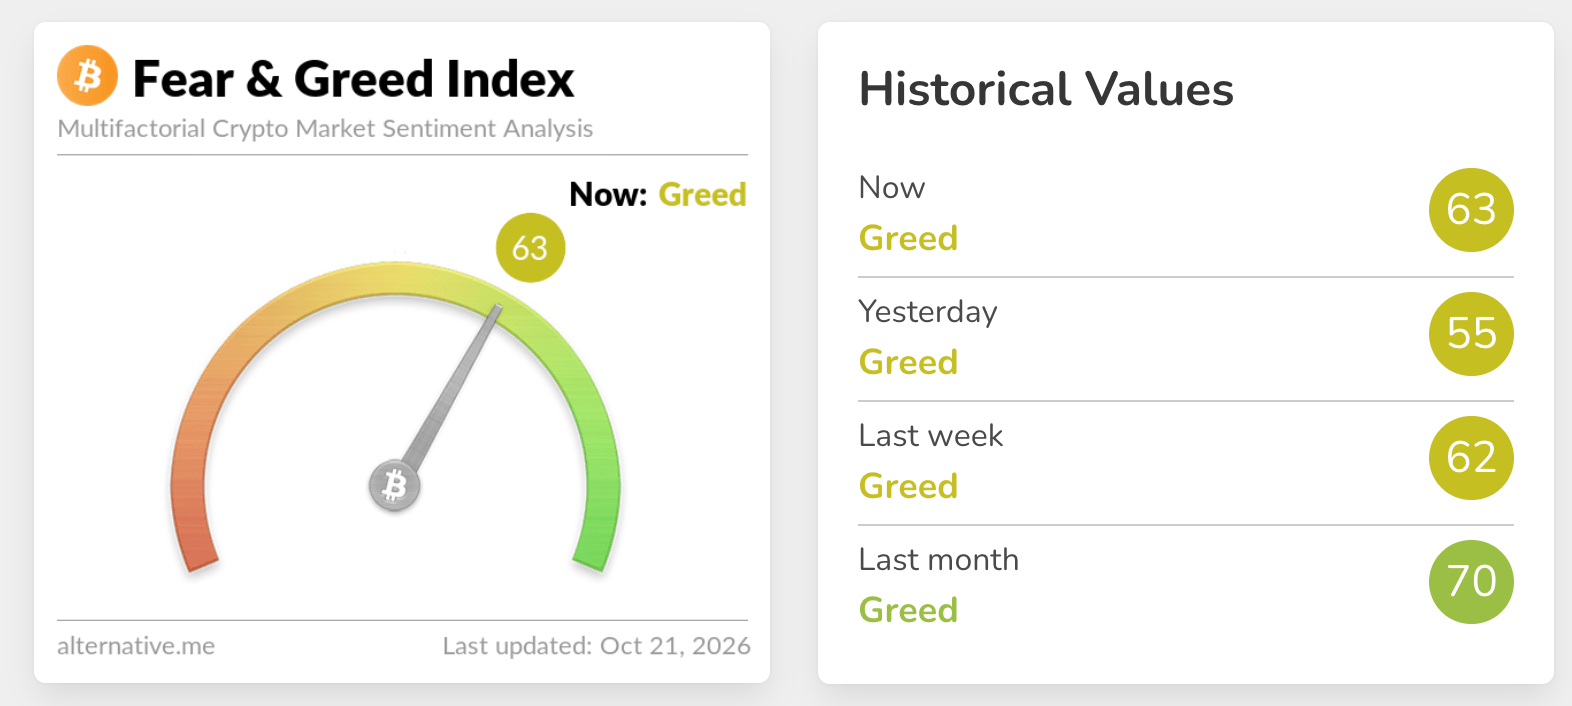
Appetite for digital assets remains elevated, as reflected in the Fear & Greed Index at 63 in the Greed territory on Wednesday, up from 55 the day before. This shows that despite macro-driven headwinds in the broader crypto market, investors are willing to take on more risk, anticipating a resumption of the uptrend.
Bitcoin spot Exchange-Traded Funds (ETFs) recorded $23 million in inflows on Tuesday, a significant drop from the $527 million posted on Monday. SoSoValue data highlights mixed capital flows, as Ethereum spot ETFs recorded $26 million in outflows on Tuesday, extending a five-day bearish streak.
As for XRP spot ETFs, activity has been erratic, given outflows of $105,000 and $2.5 million on Thursday and Friday last week and used activity on Monday and Tuesday.
“Low participation remains the dominant theme, and we still view this regime as similar to the dormant 2023 recovery,” the K33 report added.
Technical analysis: Bitcoin gains ground
Bitcoin trades at $83,187, maintaining a bullish near-term bias as price holds above the key Exponential Moving Averages (EMAs). The 50-day EMA around $80,780, the 100-day EMA near $77,343, and the 200-day EMA near $76,098 all sit below spot, suggesting an underlying uptrend reinforced by the SuperTrend line at about $79,664.
Momentum is mixed, with the Relative Strength Index (RSI) hovering above 53, hinting at modest bullish pressure, while the Moving Average Convergence Divergence (MACD) remains negative, indicating that upside progress is still measured rather than impulsive.
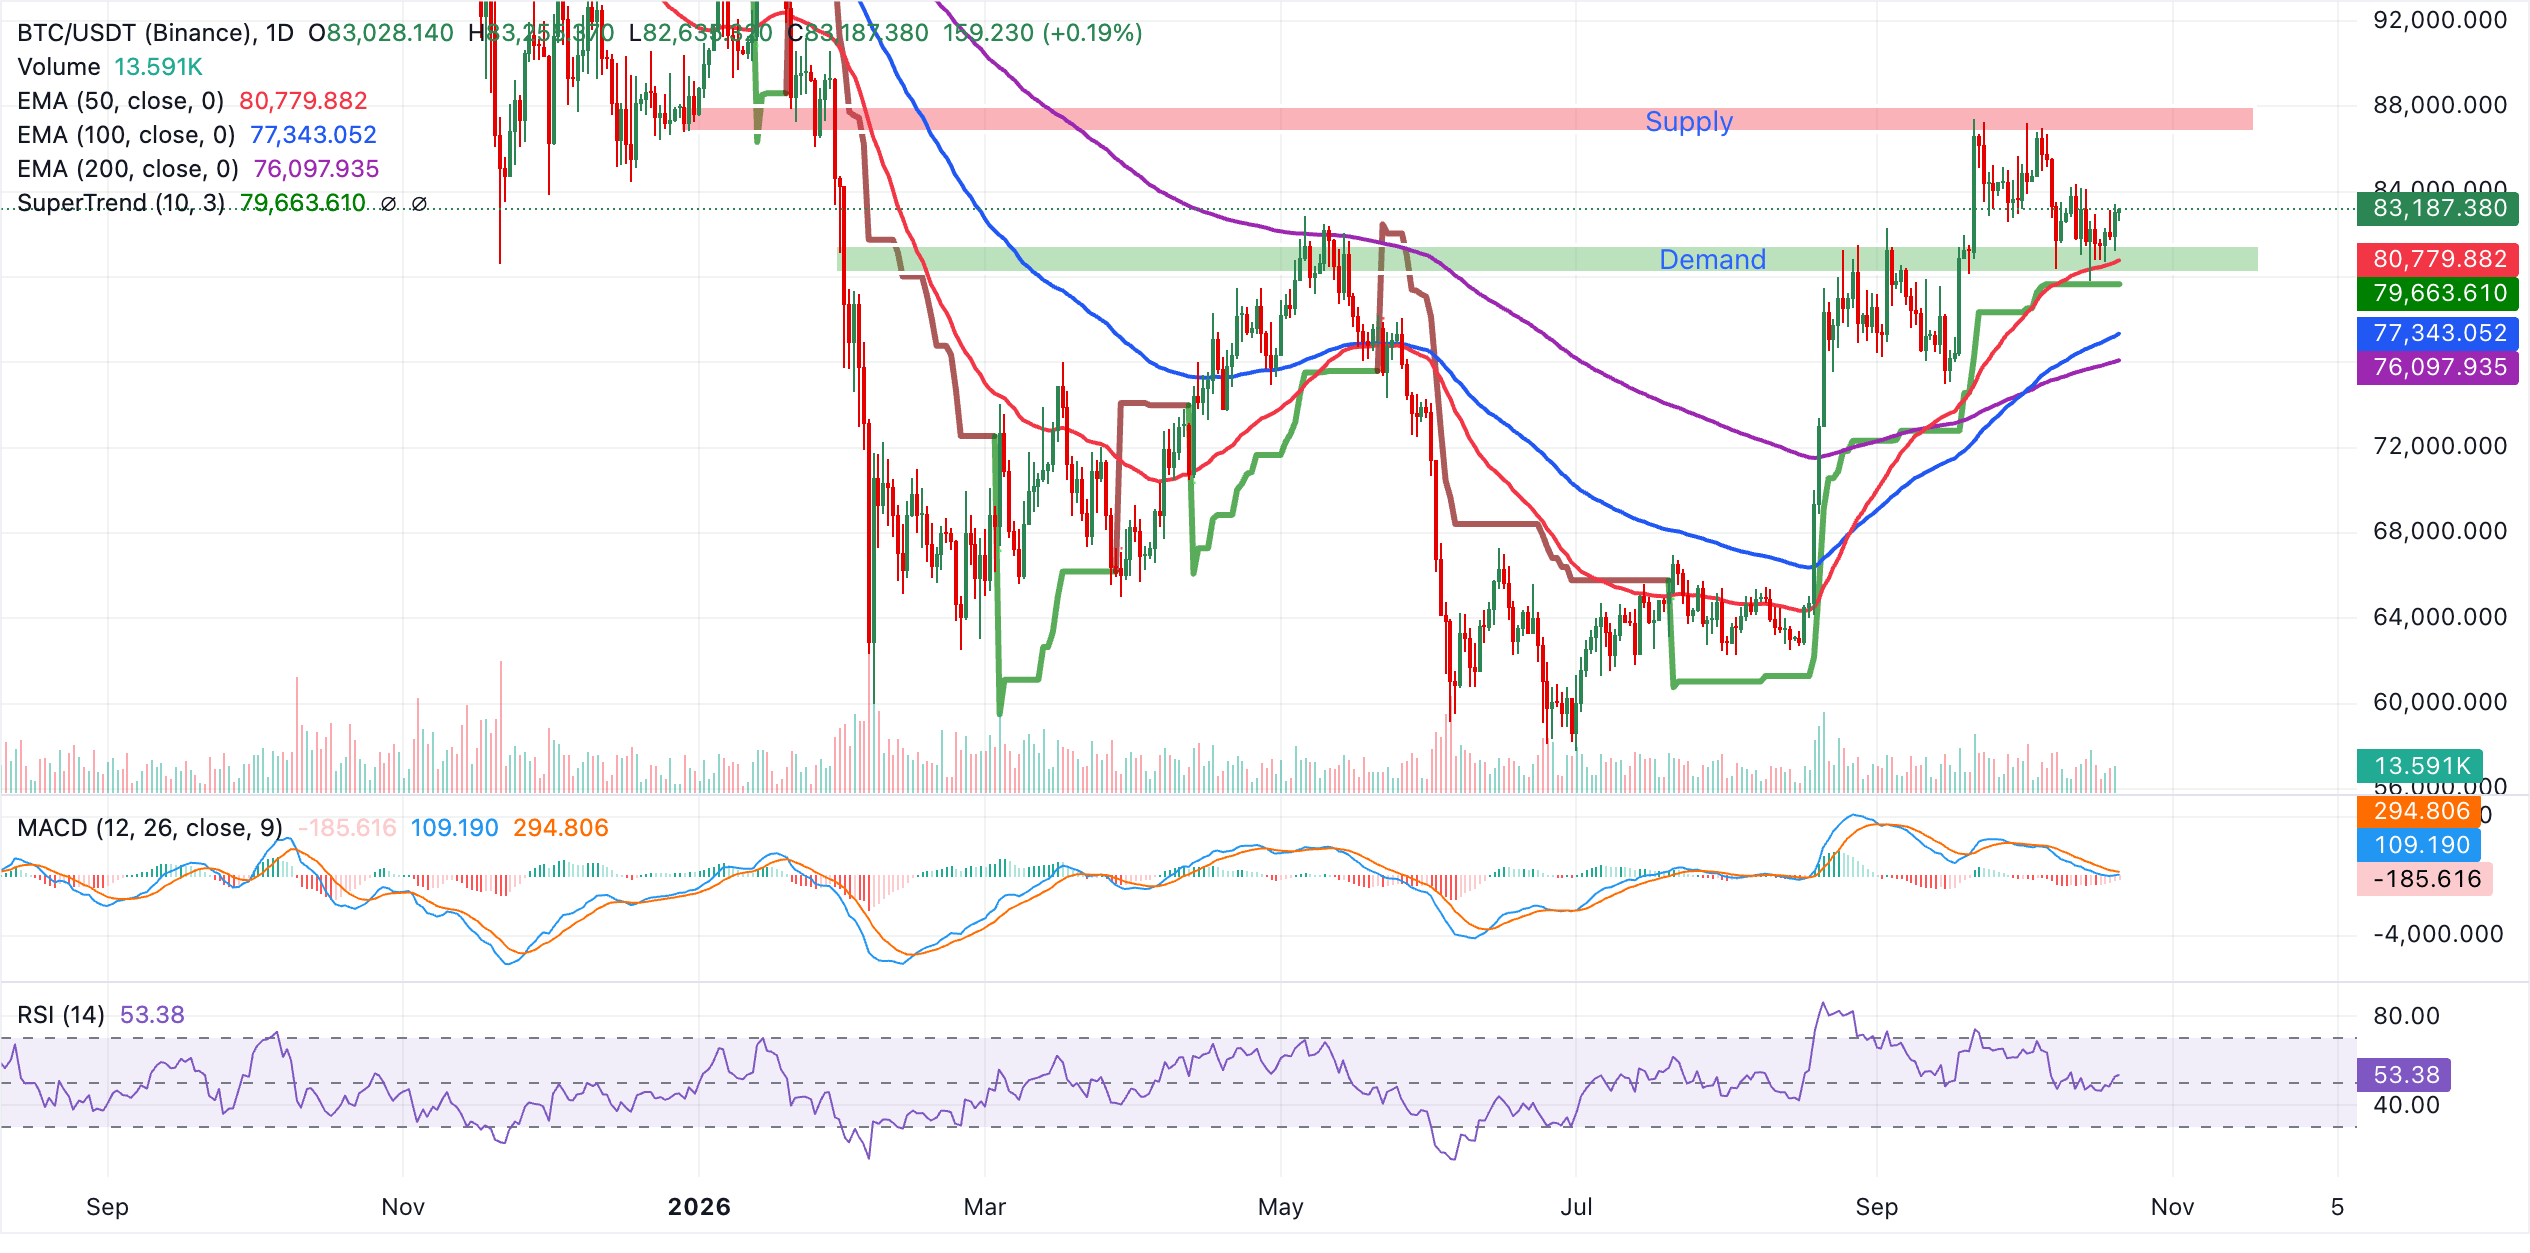
Initial support is seen at the 50-day EMA at $80,780, with the SuperTrend level at $79,664 providing a secondary floor in case of deeper pullbacks. Below these, the 100-day EMA at $77,343 and the 200-day EMA at $76,098 form a broader demand cluster that would be expected to attract buyers on a more pronounced correction.
With no immediate overhead indicator levels flagged as resistance on the daily chart, further gains would likely be driven by price action itself, and a sustained push higher would be signaled if BTC continues to respect this stacked EMA support zone while MACD stabilizes and RSI grinds higher.
Altcoins technical outlook: Ethereum and XRP poised to resume bullish trend
Ethereum trades at $2,455, sandwiched between key moving averages and holding above the 100-day and 200-day EMAs at $2,363 and $2,307, which underpin the broader constructive structure, but still capped by the 50-day EMA at $2,481 and the SuperTrend line at $2,676. This alignment suggests a neutral to slightly bearish near-term bias, as price struggles to reclaim short-term trend resistance while medium-term support remains intact.
Momentum indicators echo this indecisive tone, with the RSI hovering near a neutral 44 and the MACD below zero, hinting that upside attempts could face selling pressure unless the 50-day EMA is decisively cleared.
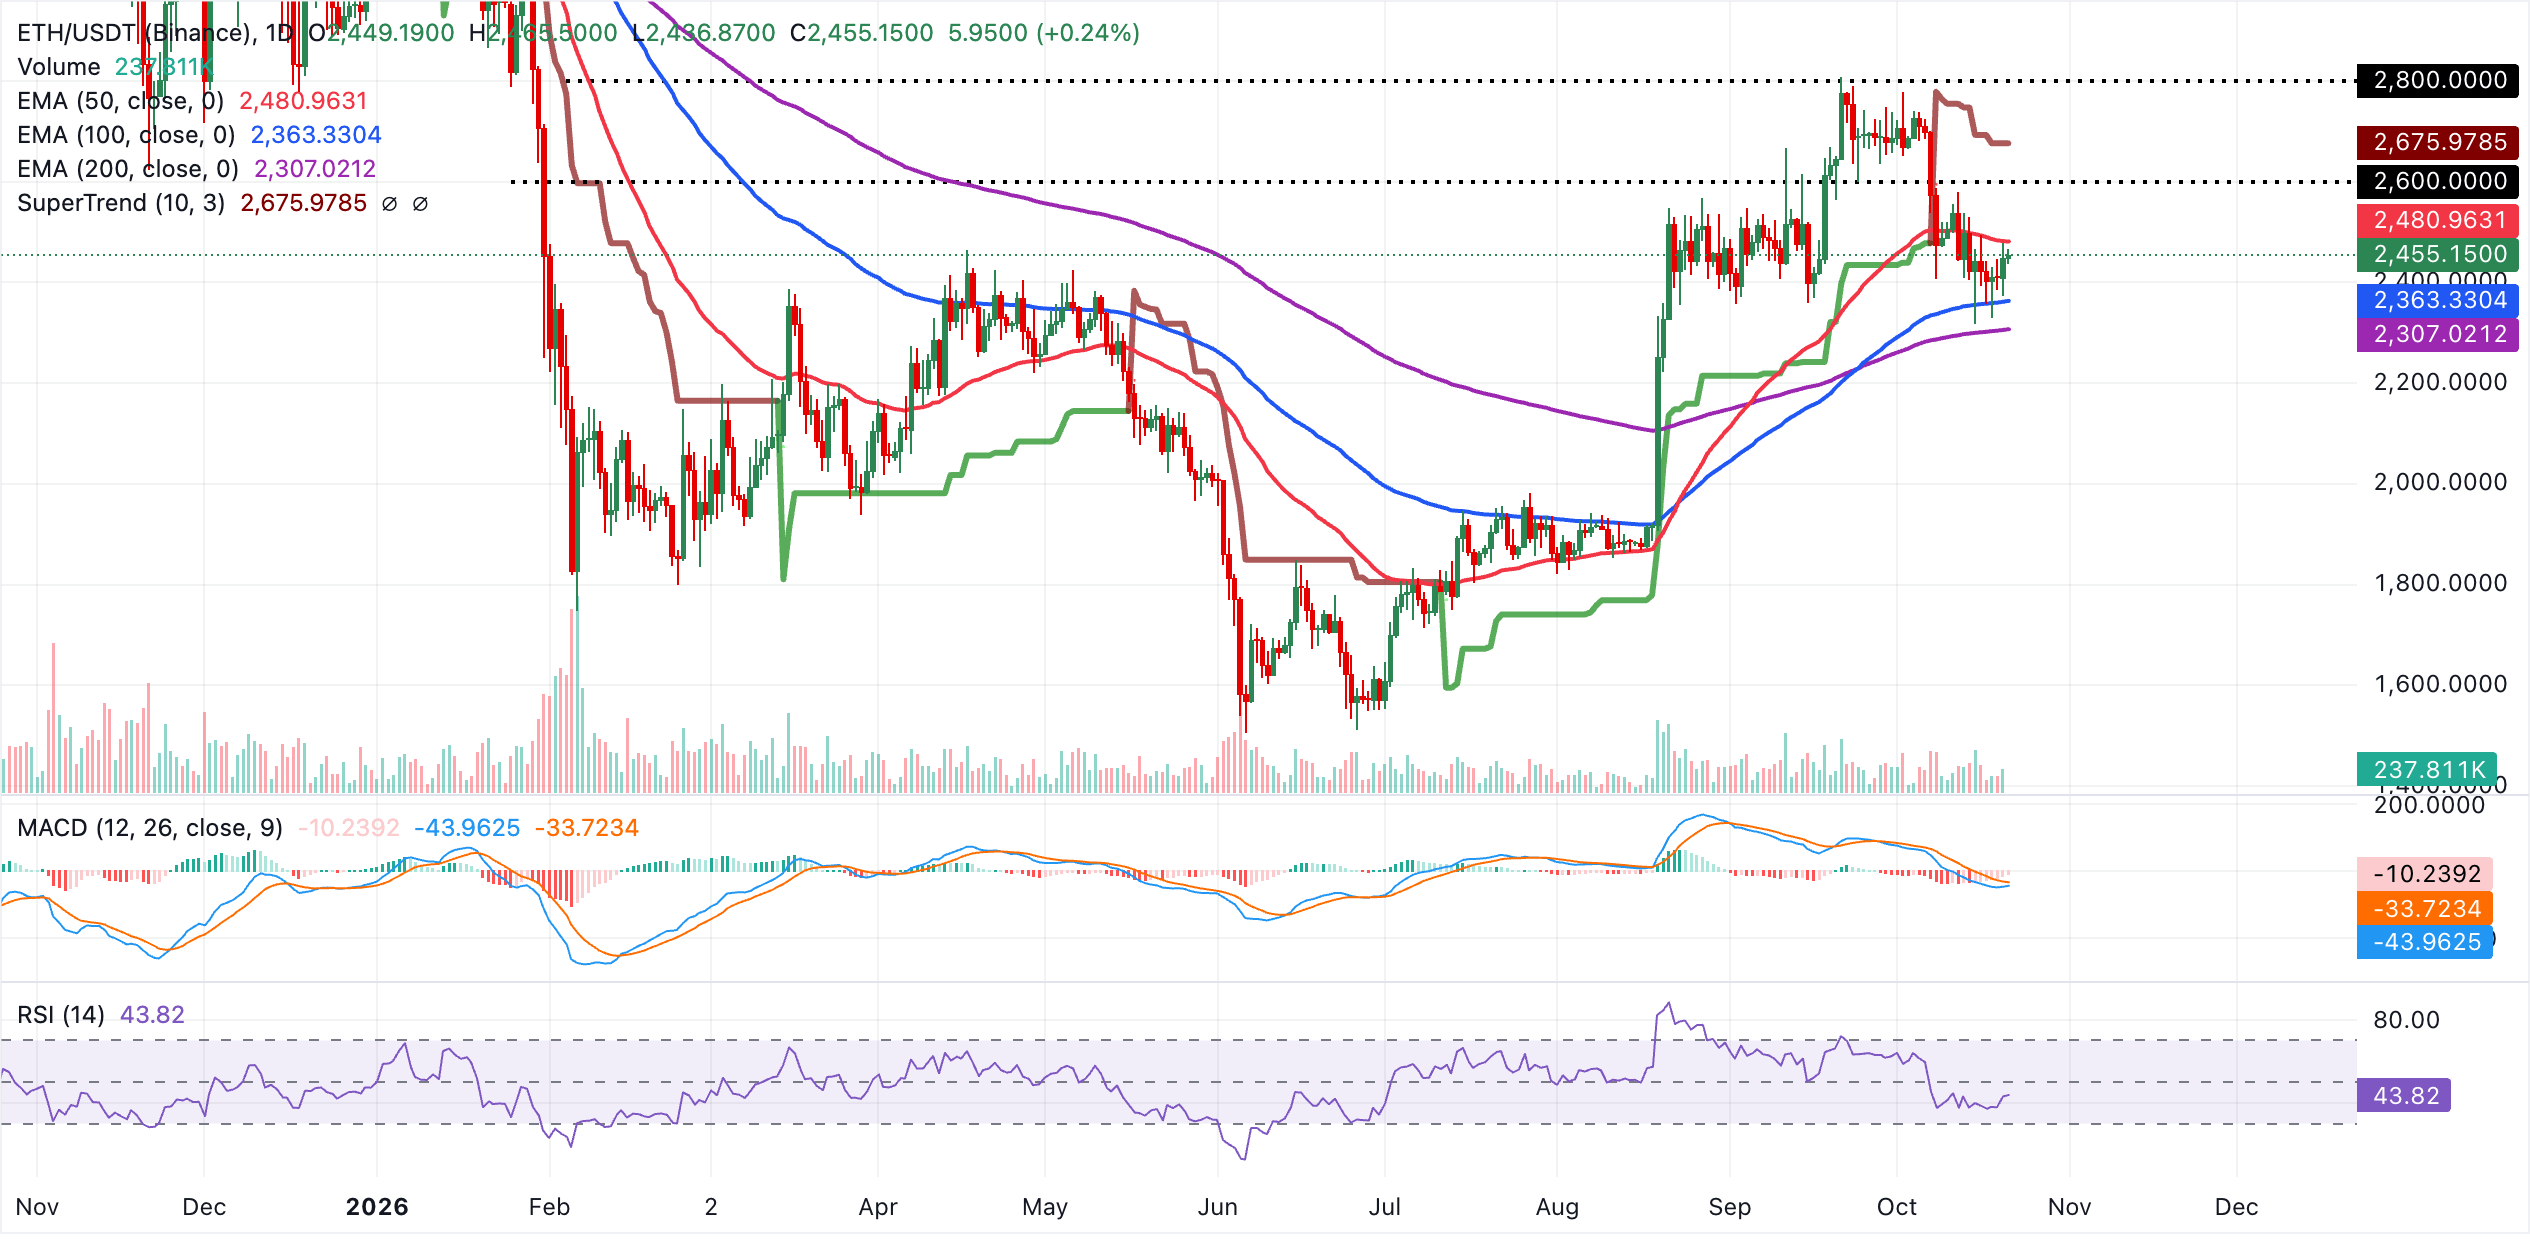
Immediate resistance sits at the 50-day EMA at $2,481, which guards the path to a stronger recovery, followed by a stronger barrier at the SuperTrend line near $2,676. On the downside, initial support lies at the 100-day EMA at $2,363, with a deeper structural floor at the 200-day EMA around $2,307. A daily close below this latter level would significantly weaken the prevailing bullish undertone from the larger trend and expose the pair to further declines.
XRP, meanwhile, trades at $1.34 and is capped in the near term as it holds below the 50-day and 200-day EMAs around $1.38. The pair has reclaimed the 100-day EMA at $1.34 as immediate support, but the broader structure remains constrained by the descending resistance trend line near $1.70 and the SuperTrend line at $1.47.
Momentum aligns with this capped tone, as the MACD remains below zero with a negative reading and the RSI around 44, hinting at subdued buying pressure rather than a decisive bullish reversal.
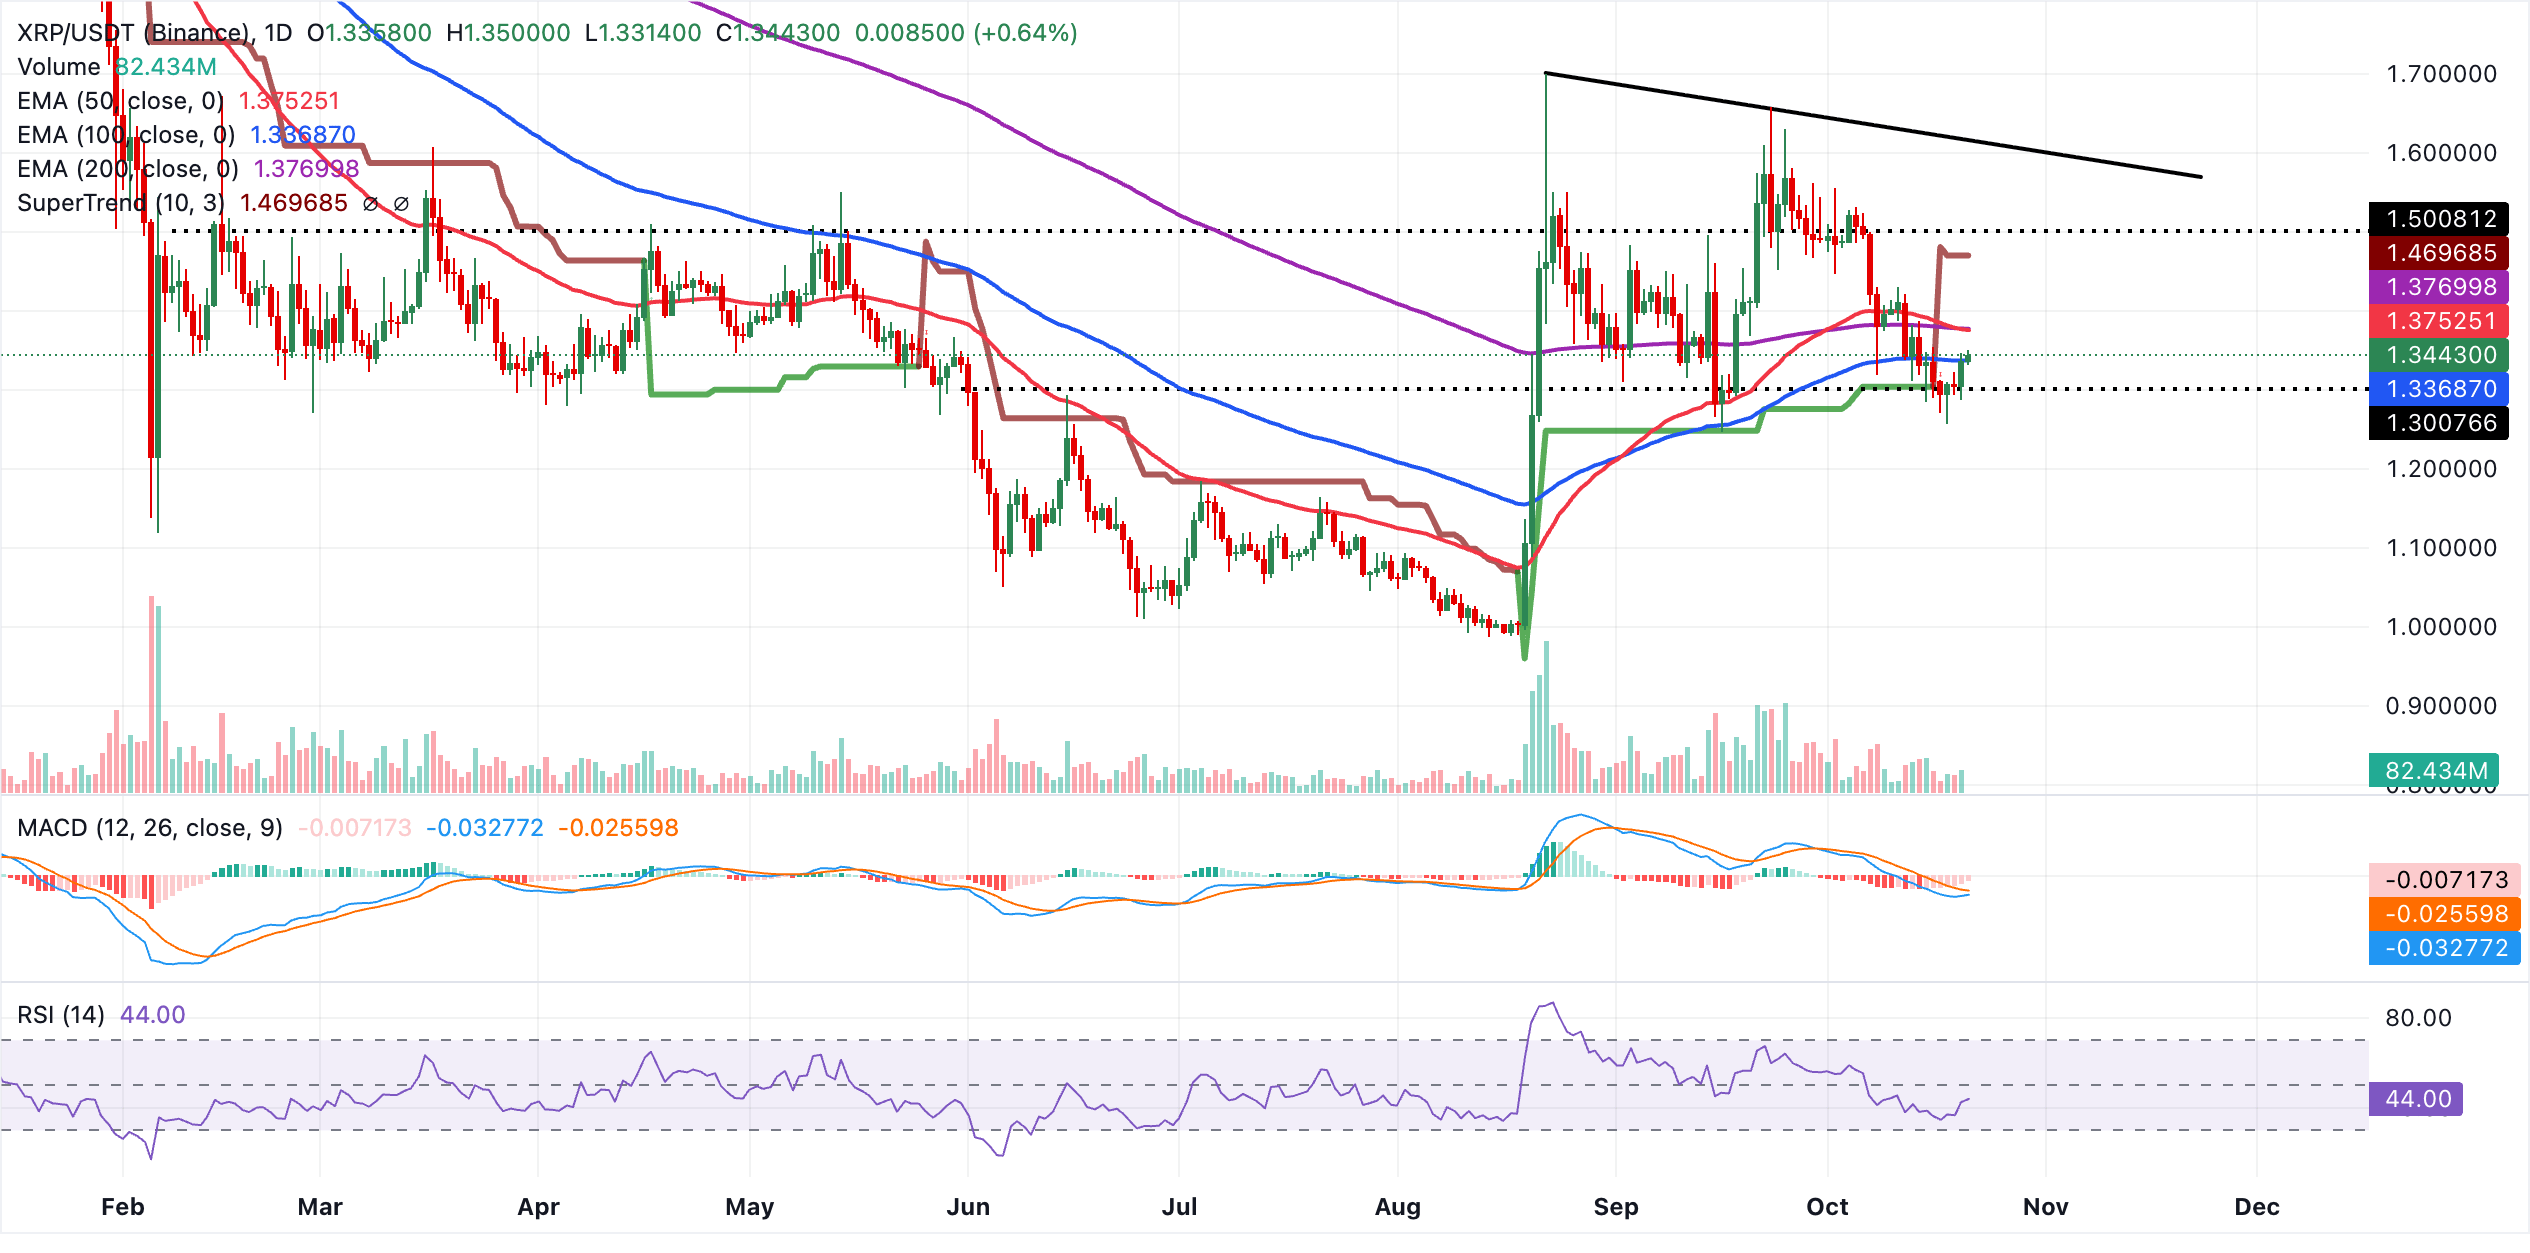
Initial resistance sits at the 50-day EMA at $1.38, followed closely by the 200-day EMA at $1.38, forming a tight barrier cluster that must be cleared to open the way toward the SuperTrend resistance at $1.47 and, eventually, the broader descending trendline cap above that zone.
On the downside, immediate support is provided by the 100-day EMA at $1.34. A daily close below this level would expose deeper consolidation and reinforce the bearish bias as long as price continues to trade beneath the higher EMAs and the dominant downtrend line.
(The technical analysis of this story was written with the help of an AI tool. Know more.)
Cryptocurrency prices FAQs
Token launches influence demand and adoption among market participants. Listings on crypto exchanges deepen the liquidity for an asset and add new participants to an asset’s network. This is typically bullish for a digital asset.
A hack is an event in which an attacker captures a large volume of the asset from a DeFi bridge or hot wallet of an exchange or any other crypto platform via exploits, bugs or other methods. The exploiter then transfers these tokens out of the exchange platforms to ultimately sell or swap the assets for other cryptocurrencies or stablecoins. Such events often involve an en masse panic triggering a sell-off in the affected assets.
Macroeconomic events like the US Federal Reserve’s decision on interest rates influence crypto assets mainly through the direct impact they have on the US Dollar. An increase in interest rate typically negatively influences Bitcoin and altcoin prices, and vice versa. If the US Dollar index declines, risk assets and associated leverage for trading gets cheaper, in turn driving crypto prices higher.
Halvings are typically considered bullish events as they slash the block reward in half for miners, constricting the supply of the asset. At consistent demand if the supply reduces, the asset’s price climbs.
Recommended Articles


