



Cardano Price Forecast: ADA holds above EMAs as recovery builds

Source Fxstreet
  • Cardano takes back the 200-day EMA at $0.241 after a 2.85% correction last week.
  • Improving derivatives positioning among ADA traders assists a constructive bias.
  • The technical outlook supports a recovery if ADA continues to hold above the EMA cluster.

Cardano (ADA) reclaims trading above the key support zone on Monday after a 2.85% correction last week. Improving derivatives positioning and constructive technical outlook support a recovery for ADA.

Improving derivatives sentiment

Derivatives data shows an improving sentiment among Cardano traders. CoinGlass’ long-to-short ratio for ADA reads 1.01 on Monday, flipping into green territory. A ratio above one indicates bullish sentiment, as traders bet that asset prices will rise.
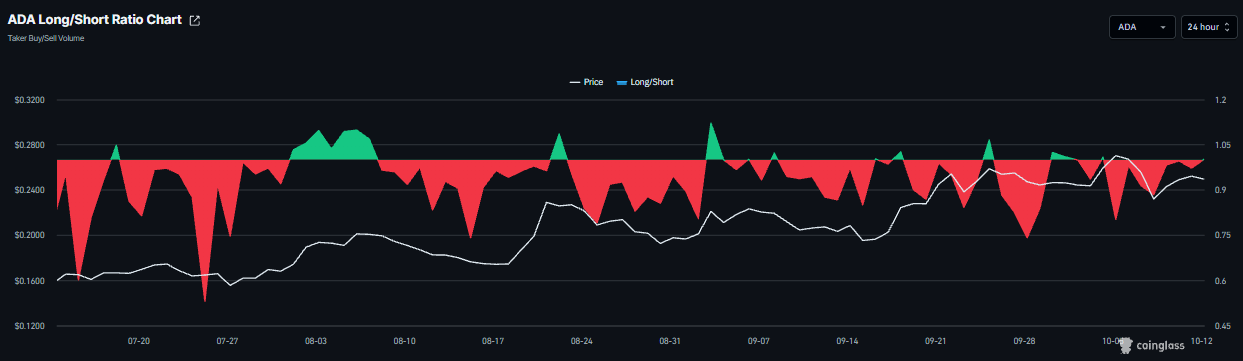
ADA long-to-short ratio chart. Source: Coinglass

In addition, Cardano’s funding rate flipped positive on Sunday and rose to 0.0061% on Monday. This indicates longs are paying shorts, reflecting a bullish outlook for ADA.
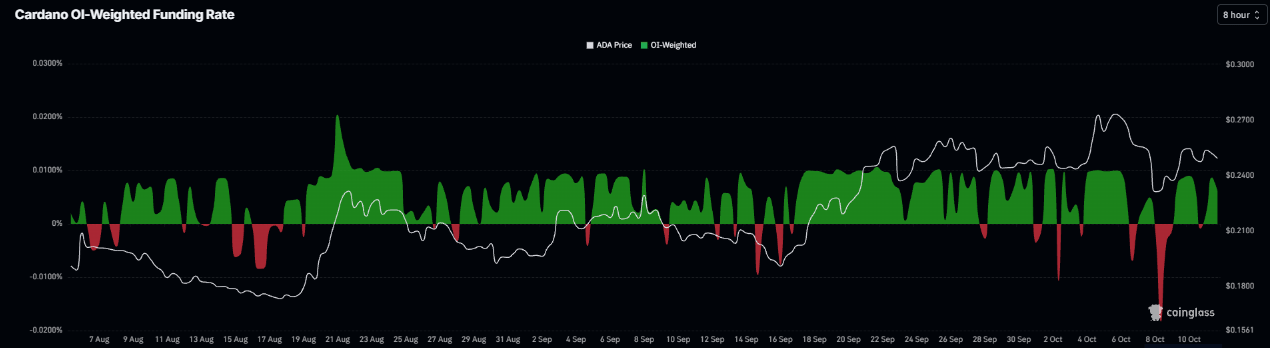
Cardano’s funding rates chart. Source: Coinglass

Some signs of concern

CryptoQuant’s summary data shows cautious signs. Cardano’s spot and futures markets show overheating conditions, with sell-side dominance, while the futures market shows large whale orders. This highlights a bearish, cautious sentiment bias among traders.
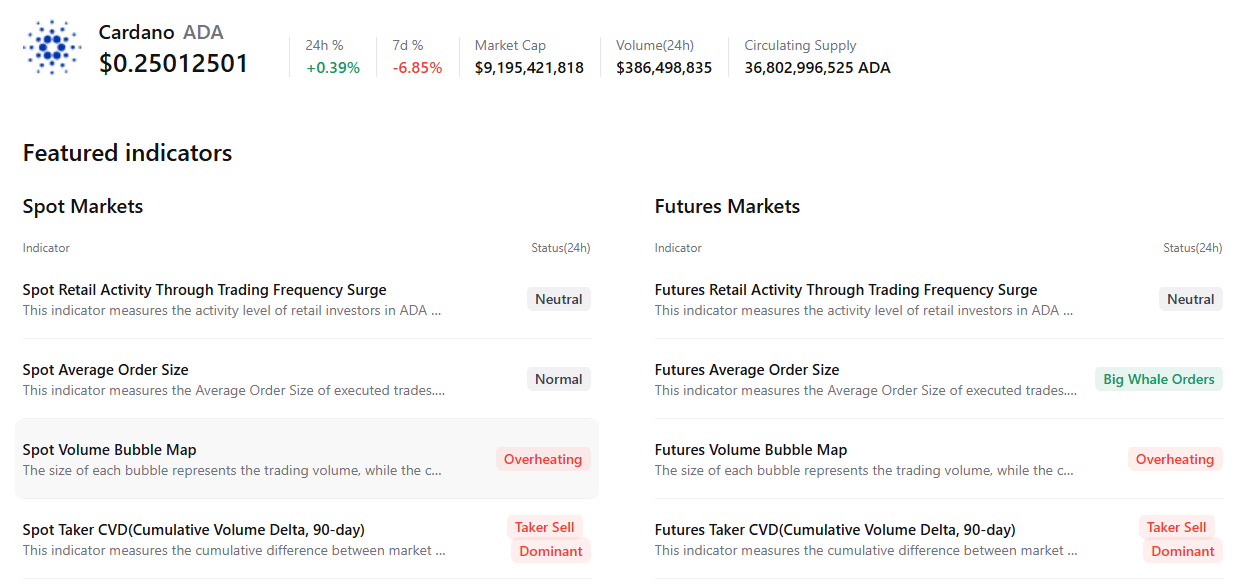
Cardano summary chart. Source: CryptoQuant

Cardano technical outlook: Holds above key EMAs

Cardano price trades at $0.250 on Monday, holding a constructive near‑term bias as it sits above a tight band of Exponential Moving Averages (EMAs) and recent structural floors. The 50-day EMA at $0.230, the 100-day EMA at $0.219, and the 200-day EMA at $0.241 all run below spot, hinting at a maturing bullish undertone while the horizontal line at $0.245 acts as immediate underlying demand.

Momentum is mixed but not hostile to further gains, with the Relative Strength Index (RSI) hovering around 54 in neutral-to-positive territory. At the same time, the Moving Average Convergence Divergence (MACD) indicator holds marginally below zero, suggesting upside attempts could remain gradual rather than impulsive.

On the downside, first support appears at the horizontal level of $0.245, followed by the 200-day EMA near $0.241 and additional horizontal support around $0.236. Below there, the 50-day EMA at $0.230 and the 100-day EMA at $0.219 guard a deeper retracement, ahead of the rising trendline support anchored around $0.206 and the more distant horizontal floor at $0.150.

On the topside, the next notable resistance does not emerge until the horizontal barrier at $0.299, where prior supply could encourage profit-taking if the current recovery leg extends.
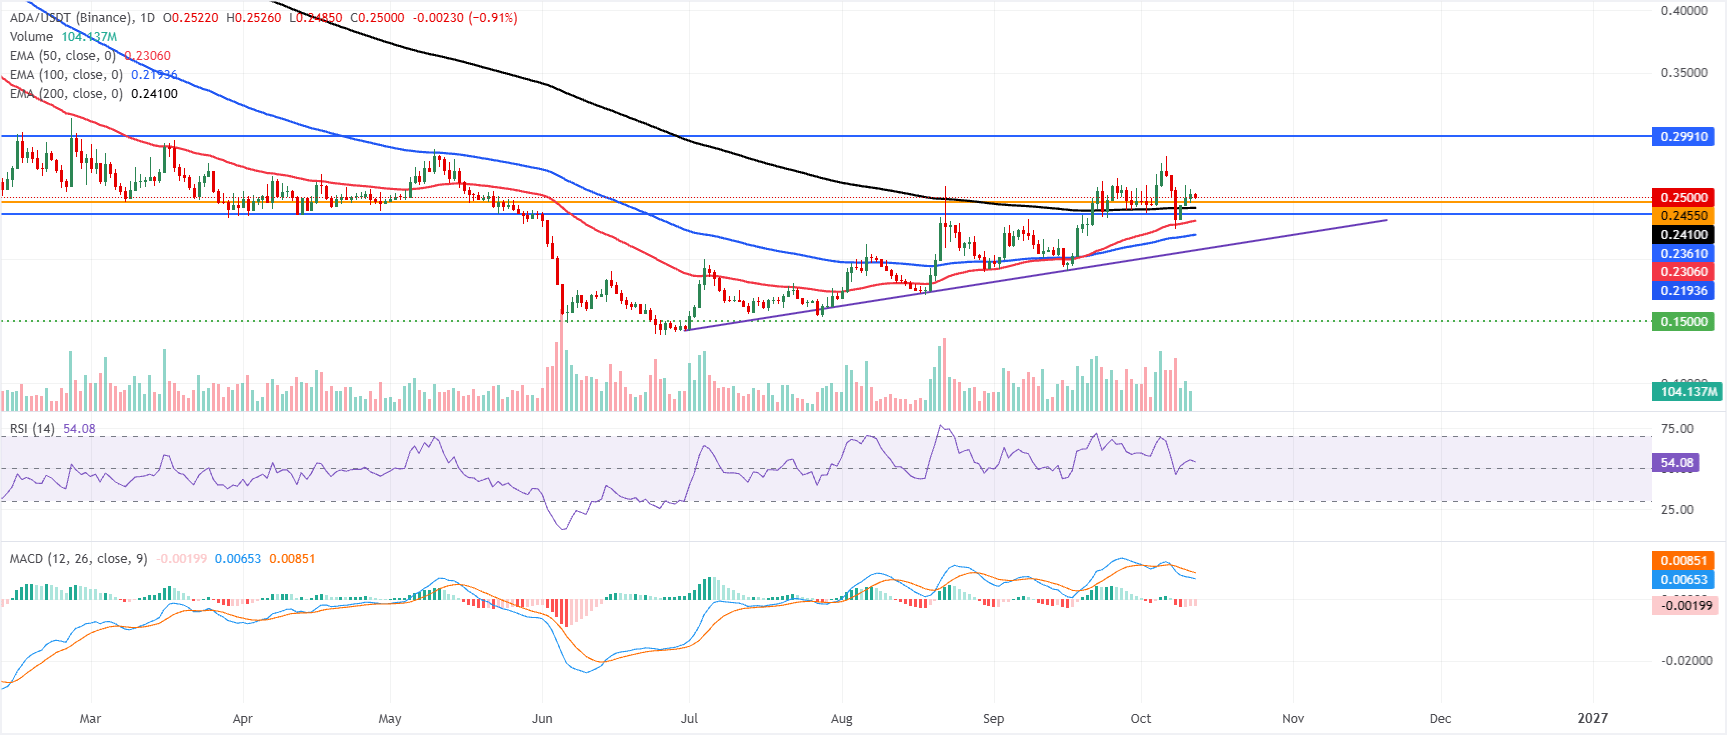
ADA/USDT daily chart

(The technical analysis of this story was written with the help of an AI tool. Know more.)

Disclaimer: For information purposes only. Past performance is not indicative of future results.
placeholder
Market News Today Australia: Oil Rallies, Gold Slips as US Dollar Hits 18-Month HighWTI crude rises as Middle East tensions support oil prices, while gold slips and US chip stocks weaken. Explore the latest market outlook for Australian CFD traders.
Author  Mitrade Team
16 hours ago
WTI crude rises as Middle East tensions support oil prices, while gold slips and US chip stocks weaken. Explore the latest market outlook for Australian CFD traders.
placeholder
Why Is the Korean Won Rising While Samsung and SK Hynix Fall?South Korean won climbed to a two-year high against the dollar on Monday. However, shares of the chipmakers whose dollar sales help support the currency traded in the red.The divergence emerged as Seo
Author  Beincrypto
18 hours ago
South Korean won climbed to a two-year high against the dollar on Monday. However, shares of the chipmakers whose dollar sales help support the currency traded in the red.The divergence emerged as Seo
placeholder
EUR/USD Hits 17-Month Low Near. Why the Euro Keeps Losing to the DollarThe euro has fallen to a 17-month low against the US dollar. EUR/USD touched 1.1161 on Oct. 5, its weakest level since May 2025.The pair has lost more than 3% in five weeks and traded near 1.1182 on M
Author  Beincrypto
18 hours ago
The euro has fallen to a 17-month low against the US dollar. EUR/USD touched 1.1161 on Oct. 5, its weakest level since May 2025.The pair has lost more than 3% in five weeks and traded near 1.1182 on M
placeholder
Top 3 Altcoins to Watch For the Second Week of October 2026Starknet (STRK), LayerZero (ZRO), and NEAR Protocol (NEAR) are the top 3 altcoins of the week by CoinGecko’s seven-day gains. However, the biggest gainer now shows the weakest chart.STRK rose 81.7% ov
Author  Beincrypto
18 hours ago
Starknet (STRK), LayerZero (ZRO), and NEAR Protocol (NEAR) are the top 3 altcoins of the week by CoinGecko’s seven-day gains. However, the biggest gainer now shows the weakest chart.STRK rose 81.7% ov
placeholder
US Dollar Hits 18-Month High: What It Means for Bitcoin and StocksThe US dollar is surging, and that could spell trouble for Bitcoin and Wall Street. The US Dollar Index (DXY) reached an 18-month high near 102.56 on Monday, while Bitcoin struggled around $83,000 and
Author  Beincrypto
18 hours ago
The US dollar is surging, and that could spell trouble for Bitcoin and Wall Street. The US Dollar Index (DXY) reached an 18-month high near 102.56 on Monday, while Bitcoin struggled around $83,000 and
Related Instrument
goTop
quote