



Solana Price Forecast: SOL nears triangle pattern breakout amid firm retail support

Source Fxstreet
  • Solana hovers around $75 on Friday, holding above a crucial support trendline despite easing bullish momentum.
  • SOL-focused ETFs with $403,890 in inflows on Thursday reflect easing institutional volatility earlier this week.
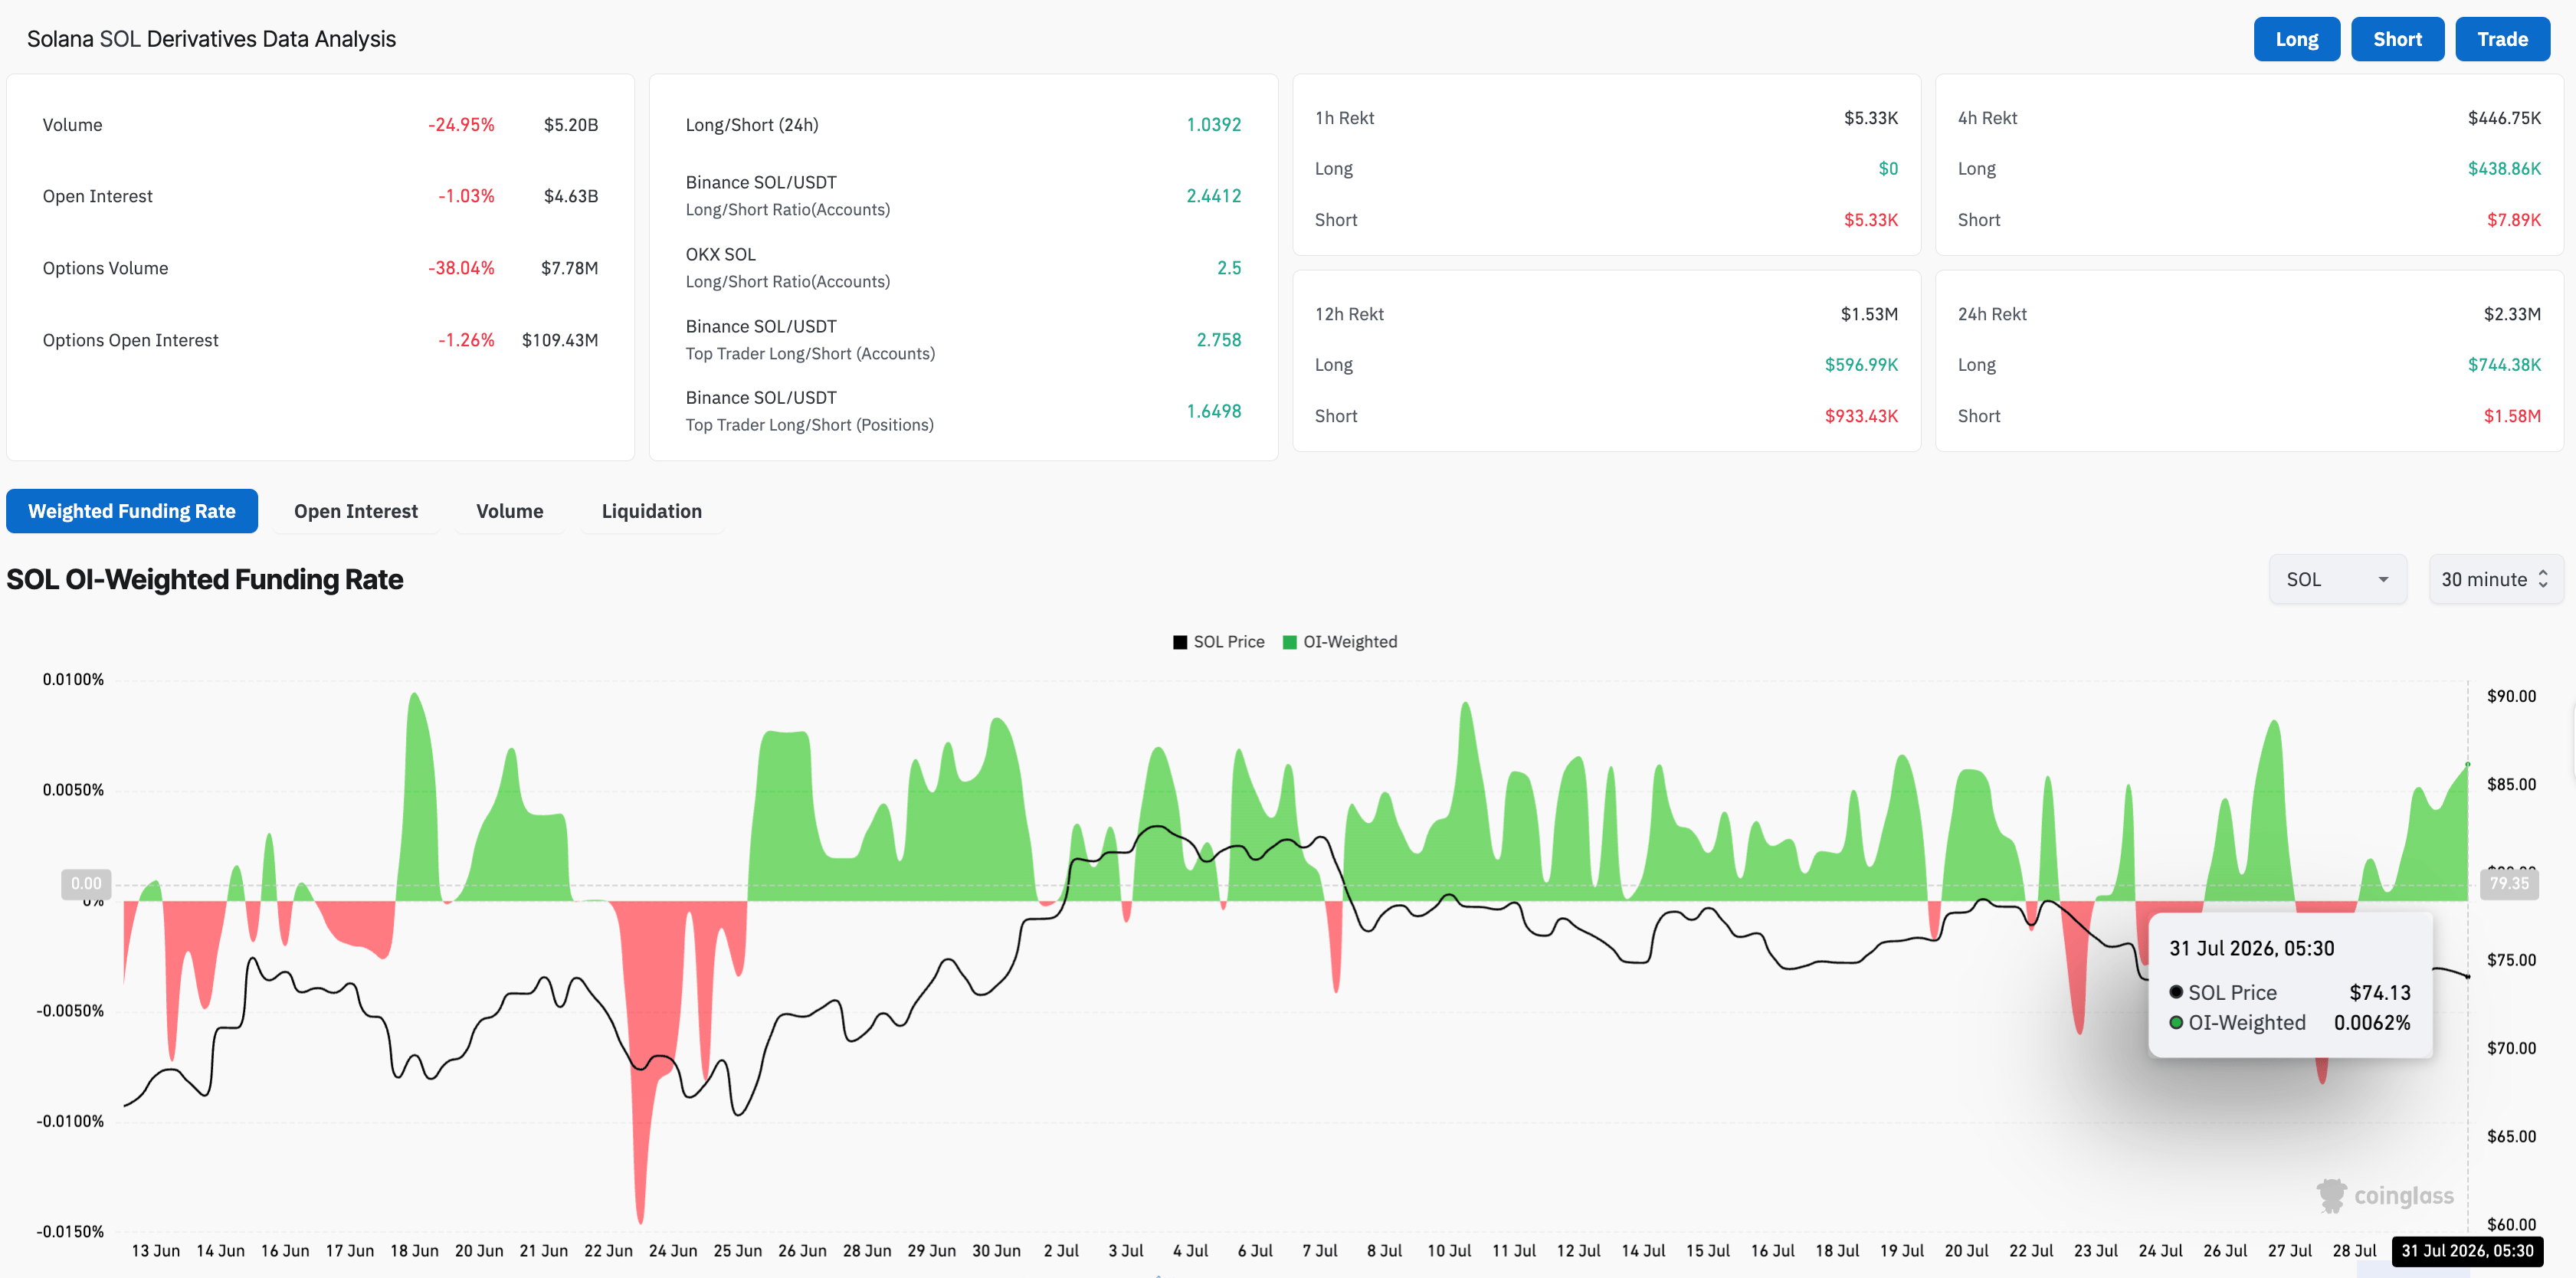
  • Retail demand holds firm with a positive funding rate and a mild contraction in SOL Open Interest.

Solana (SOL) is trading below $75.00 on Friday, testing a crucial support trendline of a symmetrical triangle pattern. SOL-focused Exchange Traded Funds (ETFs) recorded $403,890 in inflows on Thursday, while retail demand holds firm with rising funding rates. The technical outlook is mixed as SOL approaches a shift in bullish momentum. 

Rebound speculations rise despite mixed institutional interest

Solana is facing mixed institutional demand so far this week. SoSoValue data show that the SOL ETFs recorded $403,890 in inflows the previous day, following sharp fluctuations earlier this week. SOL ETFs recorded $18.07 million in outflows on Tuesday, which were later offset by $19.06 million in inflows on Wednesday. 

On the retail front, CoinGlass data shows the funding rate rose to 0.0062% on Friday, up from 0.0041% the previous day, signaling increased demand among buyers for long-position buildup. However, the roughly 25% decline in volume over the last 24 hours to $5.20 billion, combined with SOL futures Open Interest (OI) easing by around 1% to $4.36 billion, suggests reduced activity, while the notional value of active contracts remains stable.
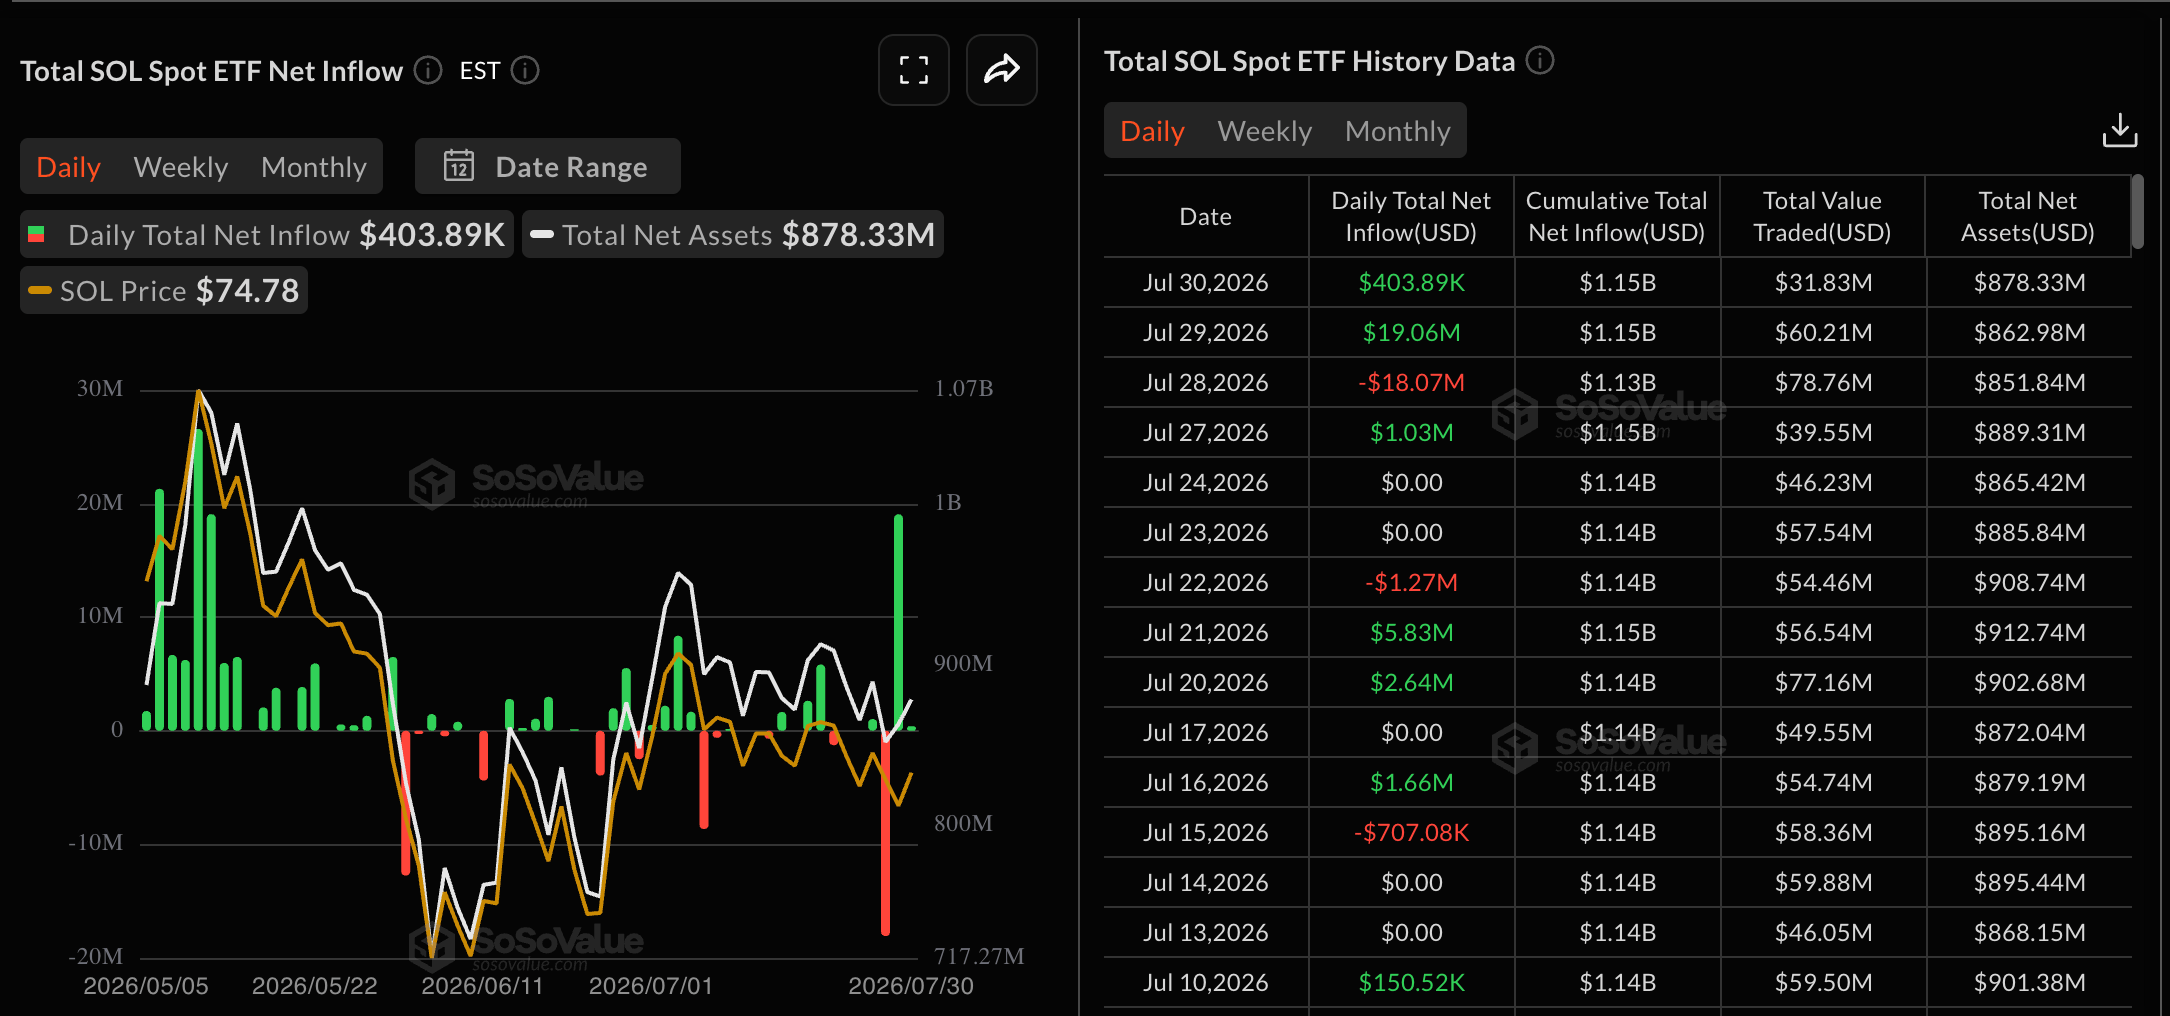
SOL ETFs data. Source: Sosovalue
SOL derivatives data. Source: CoinGlass

Technical outlook: Will Solana break above its 50-day EMA?

Solana keeps a mixed near-term bias as price approaches the apex of a symmetrical pattern on the daily chart. SOL price is supported by a rising trendline near $72.95, while the overhead trendline coincides with the 50-day Exponential Moving Average (EMA) at $76.07.

The Relative Strength Index (RSI) at 45 on the daily chart suggests only modest downside pressure, and the Moving Average Convergence Divergence (MACD) lingering below its signal line hints that rallies remain vulnerable.

On the topside, a sustained close above the overhead cluster near the 50-day EMA at around $76.09 could target the more distant barrier at the 200-day EMA at around $93.61.

Chart Analysis SOL/USDT (Binance)
SOL/USDT daily price chart.

Looking down, immediate support comes from the rising trendline around $72.95. A daily close below this area would expose additional weakness toward the February 6 low at $67.50.

(The technical analysis of this story was written with the help of an AI tool. Know more.)

Disclaimer: For information purposes only. Past performance is not indicative of future results.
placeholder
Why are prediction market traders suddenly bearish on Nvidia's stock?Nvidia (NASDAQ: NVDA) stock is still green for 2026, but the trade no longer looks clean from the company that outperformed every other company and country in 2024 and 2025. NND is up about 12% this year, yet they have slipped roughly 3% over the past month. The gap with the rest of the chip...
Author  Cryptopolitan
Jun 23, Tue
Nvidia (NASDAQ: NVDA) stock is still green for 2026, but the trade no longer looks clean from the company that outperformed every other company and country in 2024 and 2025. NND is up about 12% this year, yet they have slipped roughly 3% over the past month. The gap with the rest of the chip...
placeholder
Gold Price Outlook For July 2026Gold trades near $4,140 on Tuesday, down 26% from January’s record high of $5,598 per ounce. This gold price prediction for July 2026 examines why the metal keeps falling and where it could bottom.Fiv
Author  Beincrypto
Jul 08, Wed
Gold trades near $4,140 on Tuesday, down 26% from January’s record high of $5,598 per ounce. This gold price prediction for July 2026 examines why the metal keeps falling and where it could bottom.Fiv
placeholder
Alphabet’s AI Chip Surprise Revives Bull Case for Beaten-Down Semiconductor StocksAlphabet (GOOGL) stock climbed about 3% on Monday. The trigger was a report from The Information that Google is building a new AI chip, called Frozen v2, to run its Gemini models up to 10 times more e
Author  Beincrypto
Jul 21, Tue
Alphabet (GOOGL) stock climbed about 3% on Monday. The trigger was a report from The Information that Google is building a new AI chip, called Frozen v2, to run its Gemini models up to 10 times more e
placeholder
Citadel Sees Surprise Fed Rate Hike as Odds Hit 37.9%Citadel Securities expects the Federal Reserve to raise interest rates on Wednesday. The firm’s case centers on a quarter-point increase, against a market consensus favoring a hold.Frank Flight, the f
Author  Beincrypto
Jul 29, Wed
Citadel Securities expects the Federal Reserve to raise interest rates on Wednesday. The firm’s case centers on a quarter-point increase, against a market consensus favoring a hold.Frank Flight, the f
placeholder
AI Memory Stocks on Rocky Ground: 3 Reasons SK Hynix Fell 13%SK Hynix fell near 13% on Tuesday, July 28, in early trading. Samsung Electronics also dropped over 12% as the sell-off swept across Asian markets.The sell-off erased billions in market value across K
Author  Beincrypto
Jul 29, Wed
SK Hynix fell near 13% on Tuesday, July 28, in early trading. Samsung Electronics also dropped over 12% as the sell-off swept across Asian markets.The sell-off erased billions in market value across K
Related Instrument
goTop
quote