



Crypto Market Overview: Zcash, Worldcoin sustain gains while Bitcoin loses steam

Source Fxstreet
  • Bitcoin edges lower on Monday, slipping below $63,000 as price remains capped below the 50-day EMA at around $65,000.
  • Crypto market sentiment remains mixed as the US-Iran dispute over the Strait of Hormuz continues.
  • Zcash and Worldcoin sustain gains over the last 24 hours, emerging as top performers.

Bitcoin (BTC) trades below $63,000 on Monday, edging lower as price remains capped below its 50-day Exponential Moving Average (EMA) at $65,212. Market sentiment remains on edge as geopolitical tensions between the US and Iran stay elevated over the Strait of Hormuz. Zcash (ZEC) and Worldcoin (WLD) sustain gains over the last 24 hours, emerging as top performers.

CoinMarketCap’s Fear and Greed Index at 30 on Monday holds steady in the “Fear” zone, ranging from 20 to 40. 
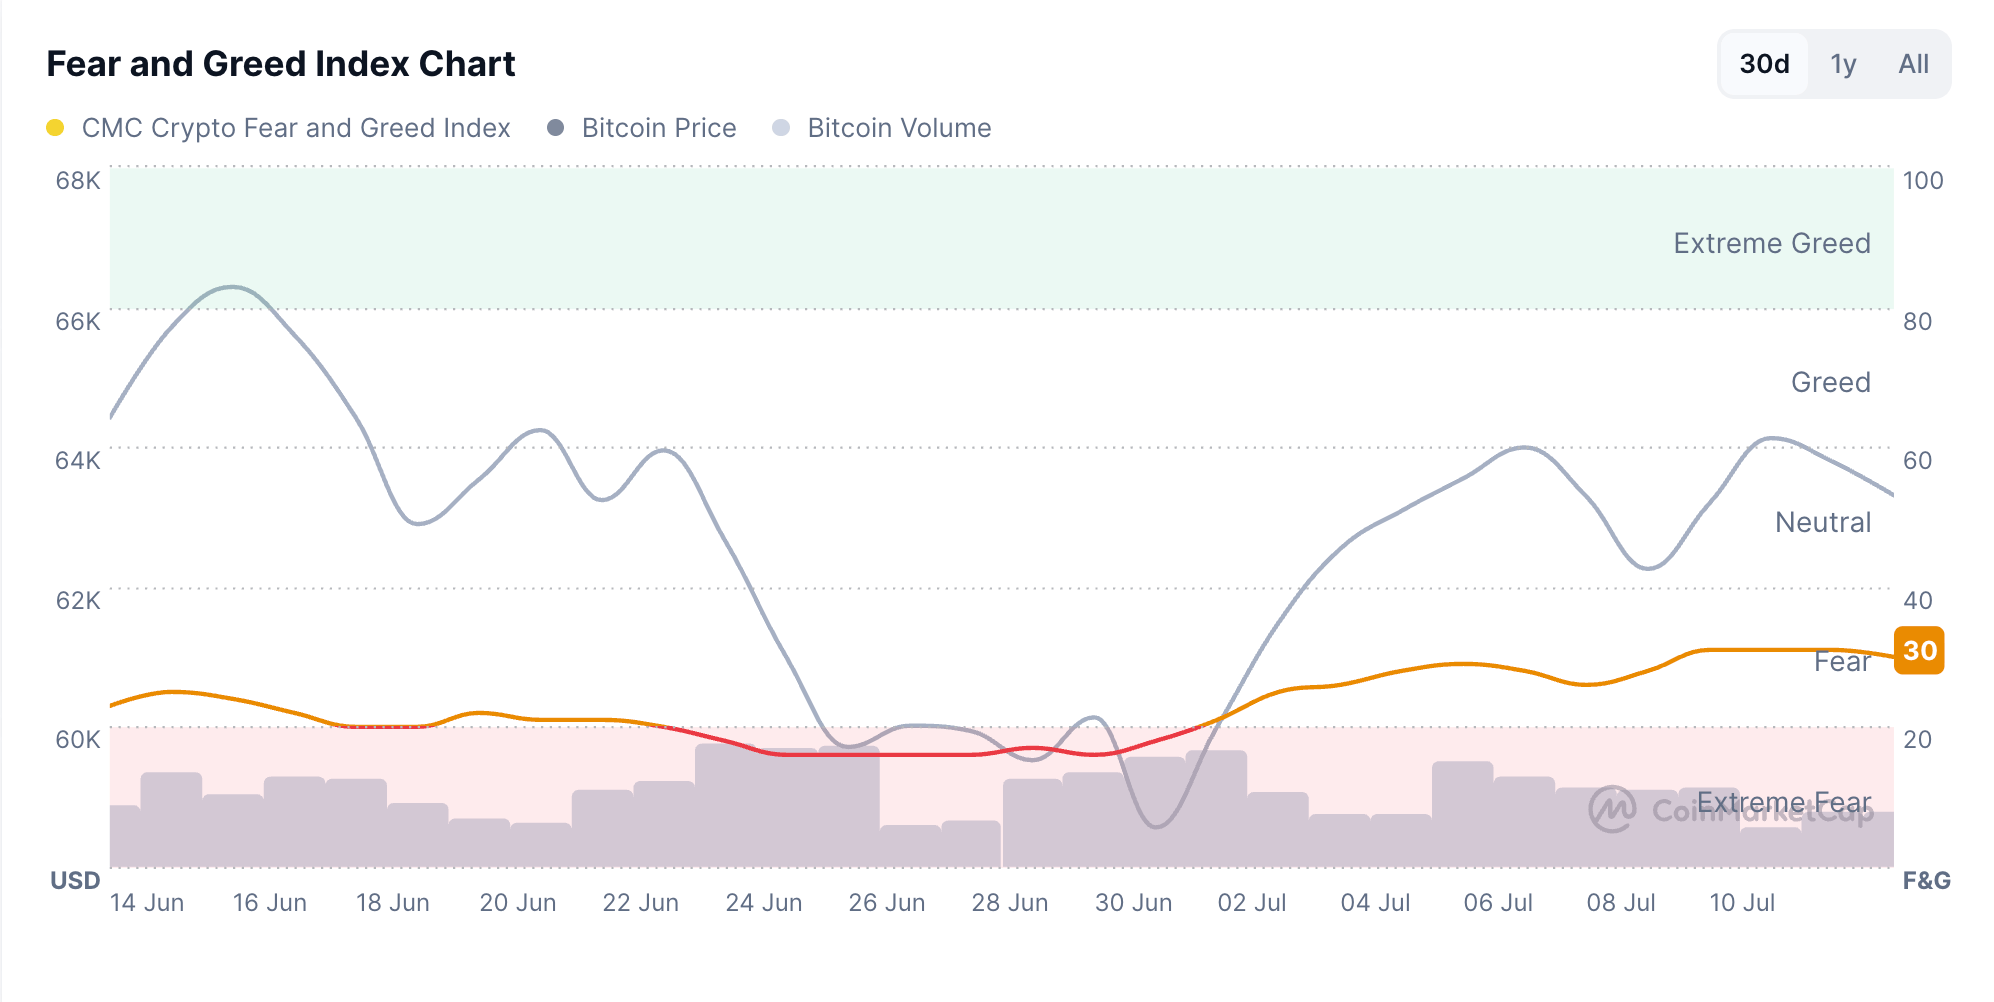
Fear and Greed Index. Source: CoinMarketCap

Bitcoin loses steam, vulnerable to deeper losses

Bitcoin maintains a capped bias below its 50-day EMA near $65,194 and well under the 200-day EMA around $75,692. From a technical perspective, the path of least resistance suggests a steeper correction in BTC toward the $60,000 psychological support.

The Moving Average Convergence Divergence (MACD) histogram remains in positive territory and above its signal line, hinting at improving short-term momentum, while the Relative Strength Index (RSI) dips to 48, below the 50 mark, suggesting only modest directional conviction despite the broader downside structure.
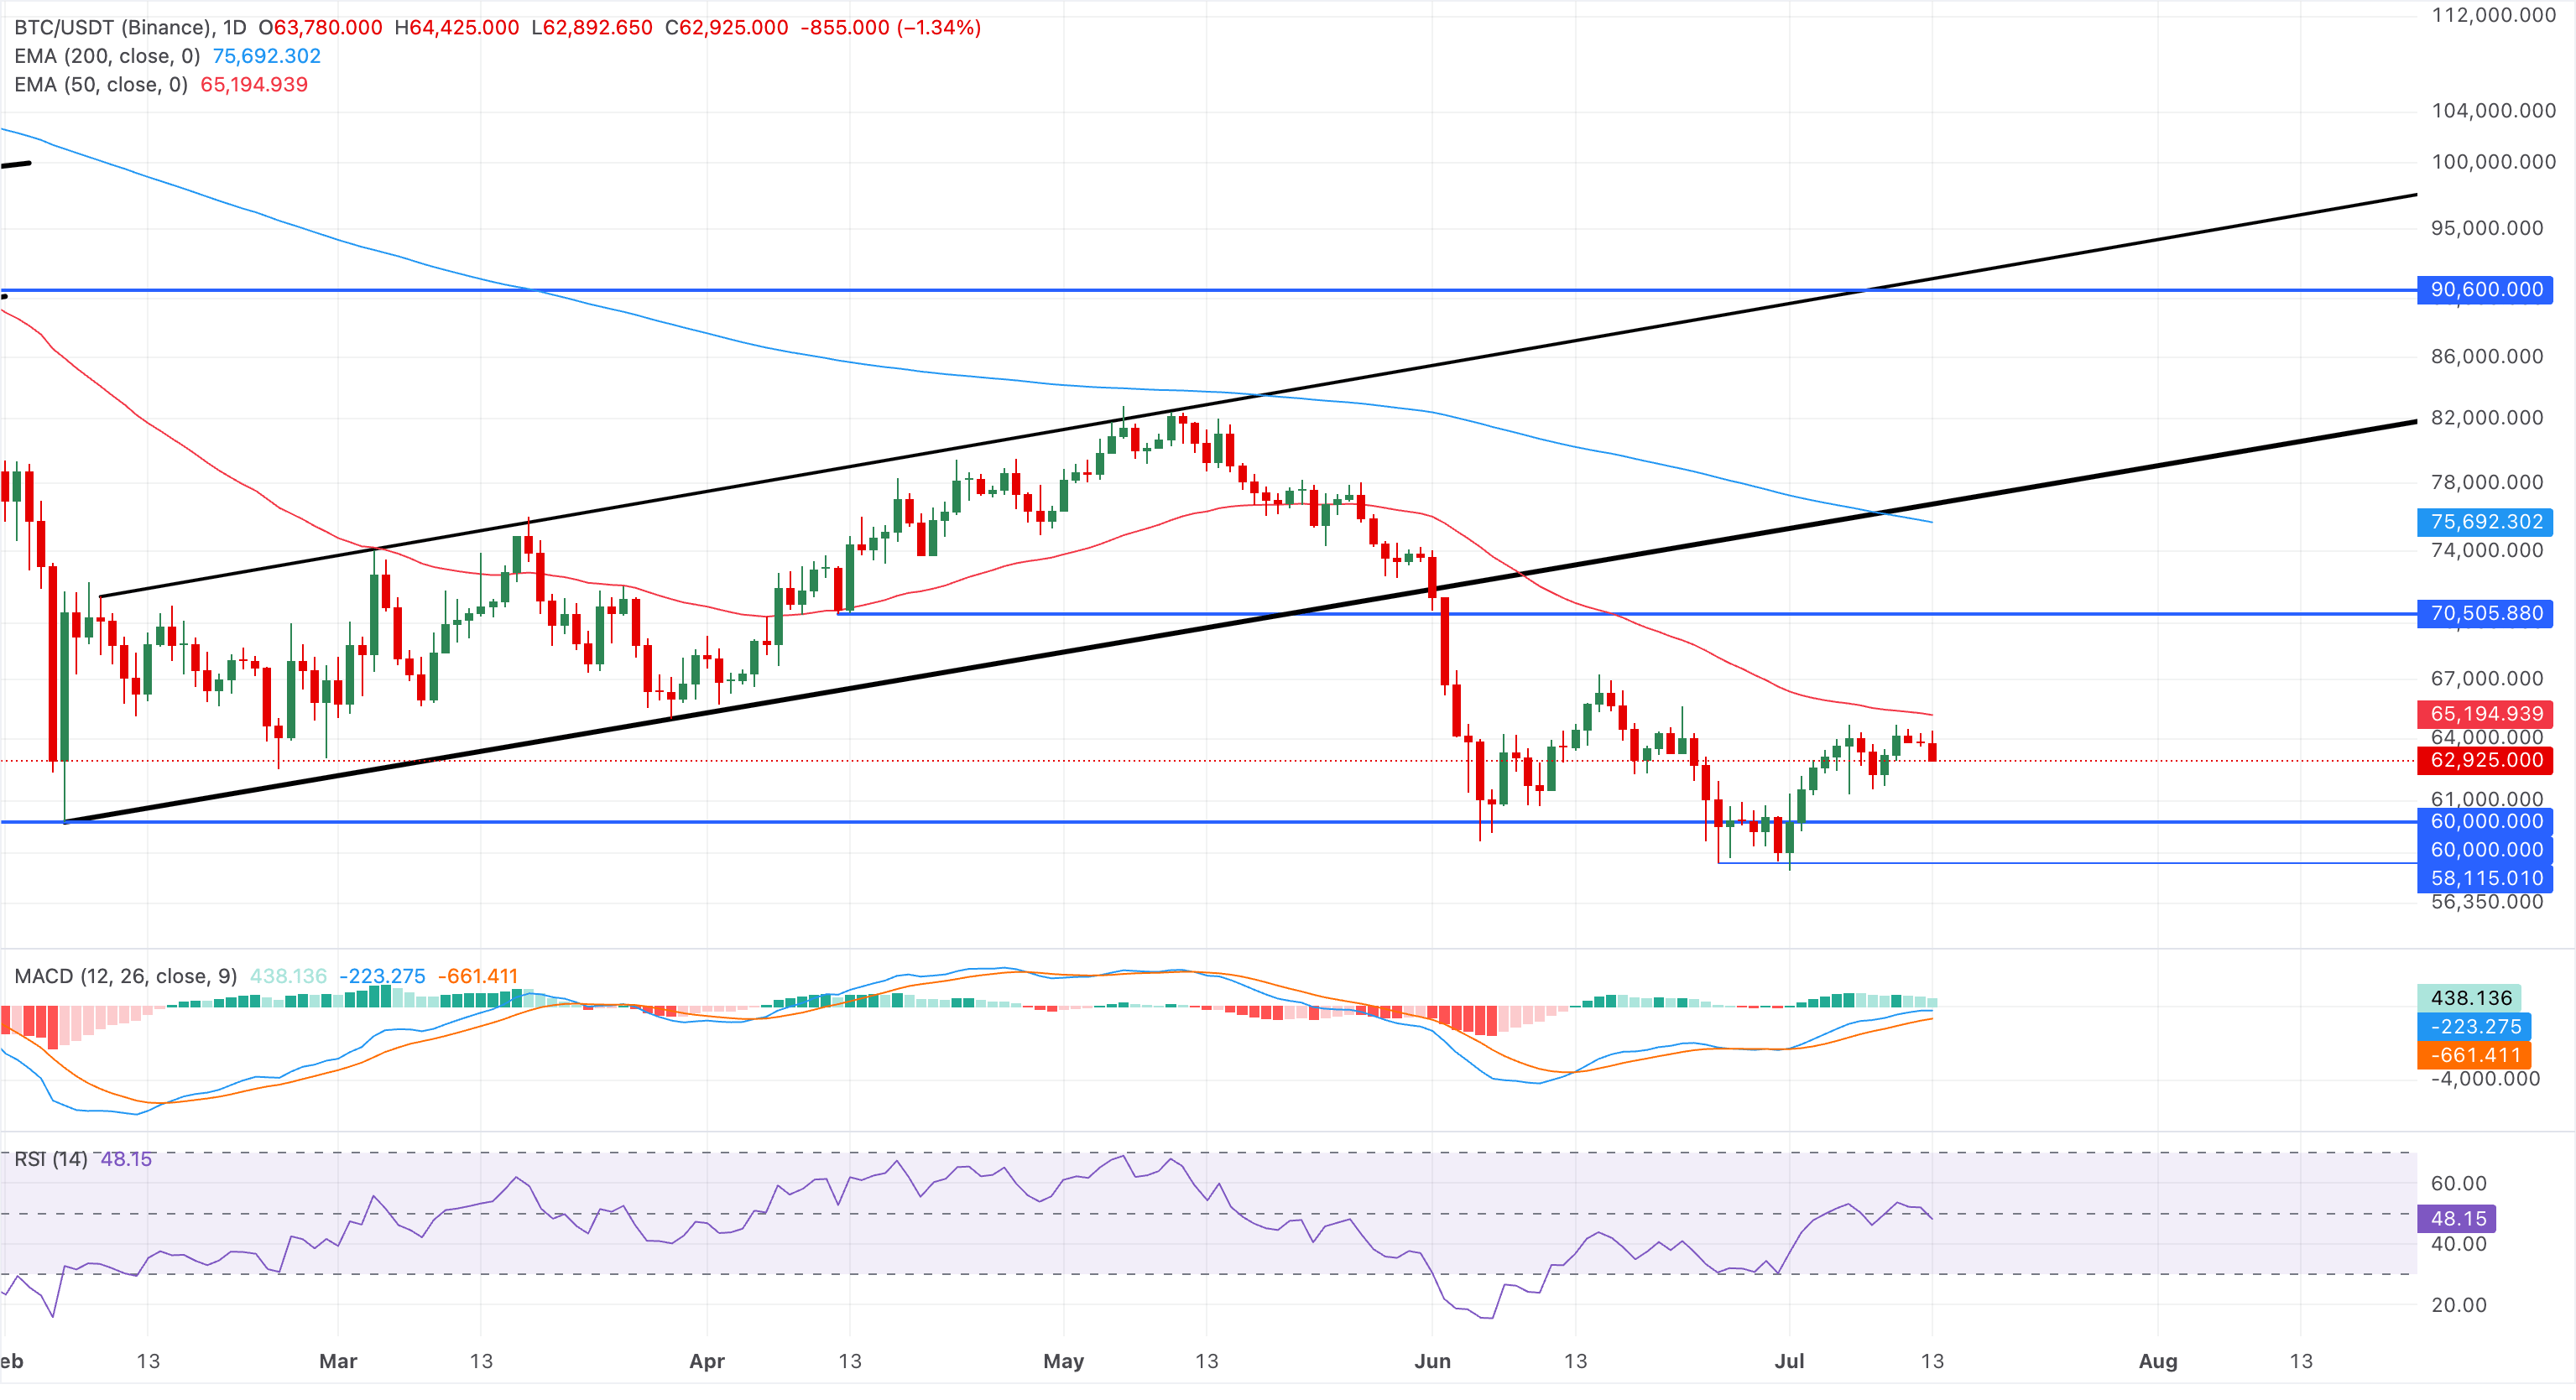
BTC/USDT daily price chart.

On the topside, initial resistance is seen at the 50-day EMA around $65,194, with a more substantial barrier at the $70,000 round figure.

Zcash and Worldcoin recovery at risk

Zcash trades above $500 at press time on Monday, after four consecutive days of recovery. The privacy coin maintains a constructive bullish tone as price holds well above the 50-day EMA near $465 and the 200-day EMA around $393.

The bounce above the 78.6% Fibonacci retracement at $520, measured from the $184 to $690 upswing, reinforces an ongoing recovery. If buying pressure sustains, ZEC could test the previous all-time high around $690.

That said, the RSI remains firm near 63, suggesting persistent buying pressure, while the MACD stays in positive territory with the line above its signal and an expanding histogram, hinting that upside momentum remains in play even as the advance starts to stretch.
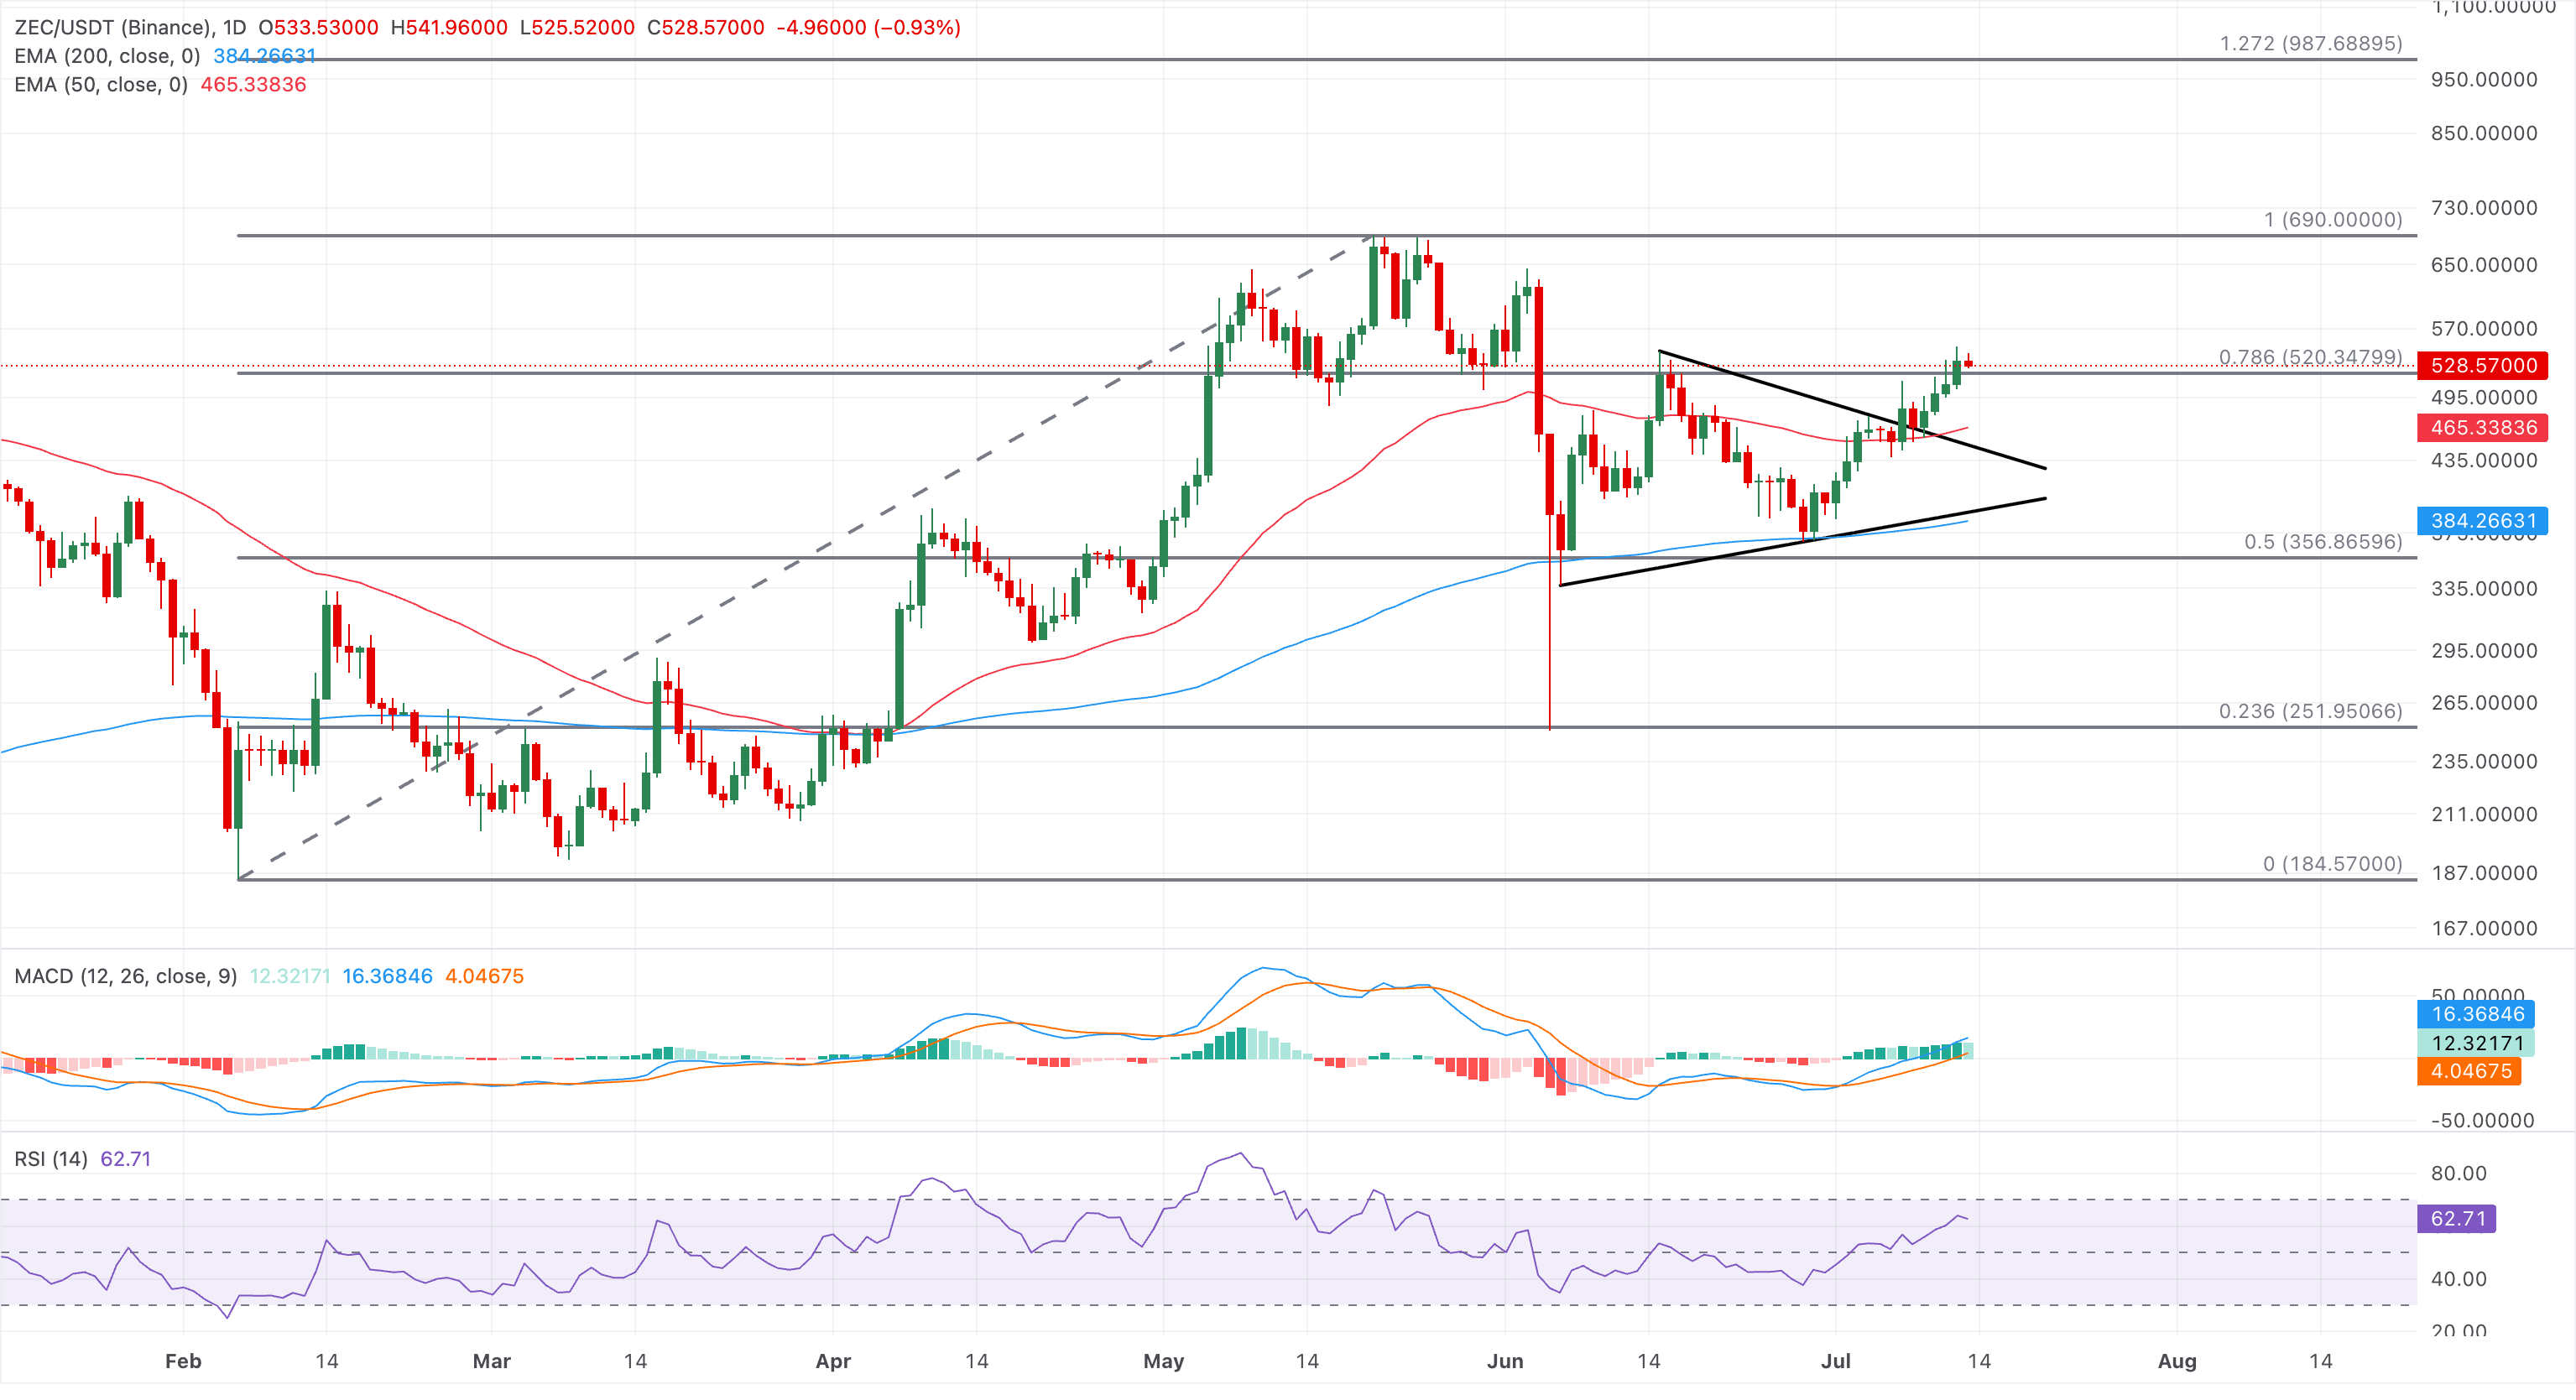
ZEC/USDT daily price chart.

On the downside, immediate support is seen at the 50-day EMA at $465 and the prior descending trendline break zone near $450, followed by the 200-day EMA at $393 and the 50% retracement at $356, which together offer deeper structural cushions.

Worldcoin holds a mildly bearish bias as it tests the 50-day EMA at $0.4294, around the 50% retracement at $0.4048, measured over the $0.2267 to $0.7229 upswing. A decisive close above $0.4294 could test the 200-day EMA near $0.4722, where a daily close above could challenge the 78.6% Fibonacci retracement at $0.5640.

Momentum readings back this cautious tone, with the RSI lingering around 47 in neutral-to-soft territory and the MACD line marginally below the signal line, hinting that downside pressure has eased but not reversed.
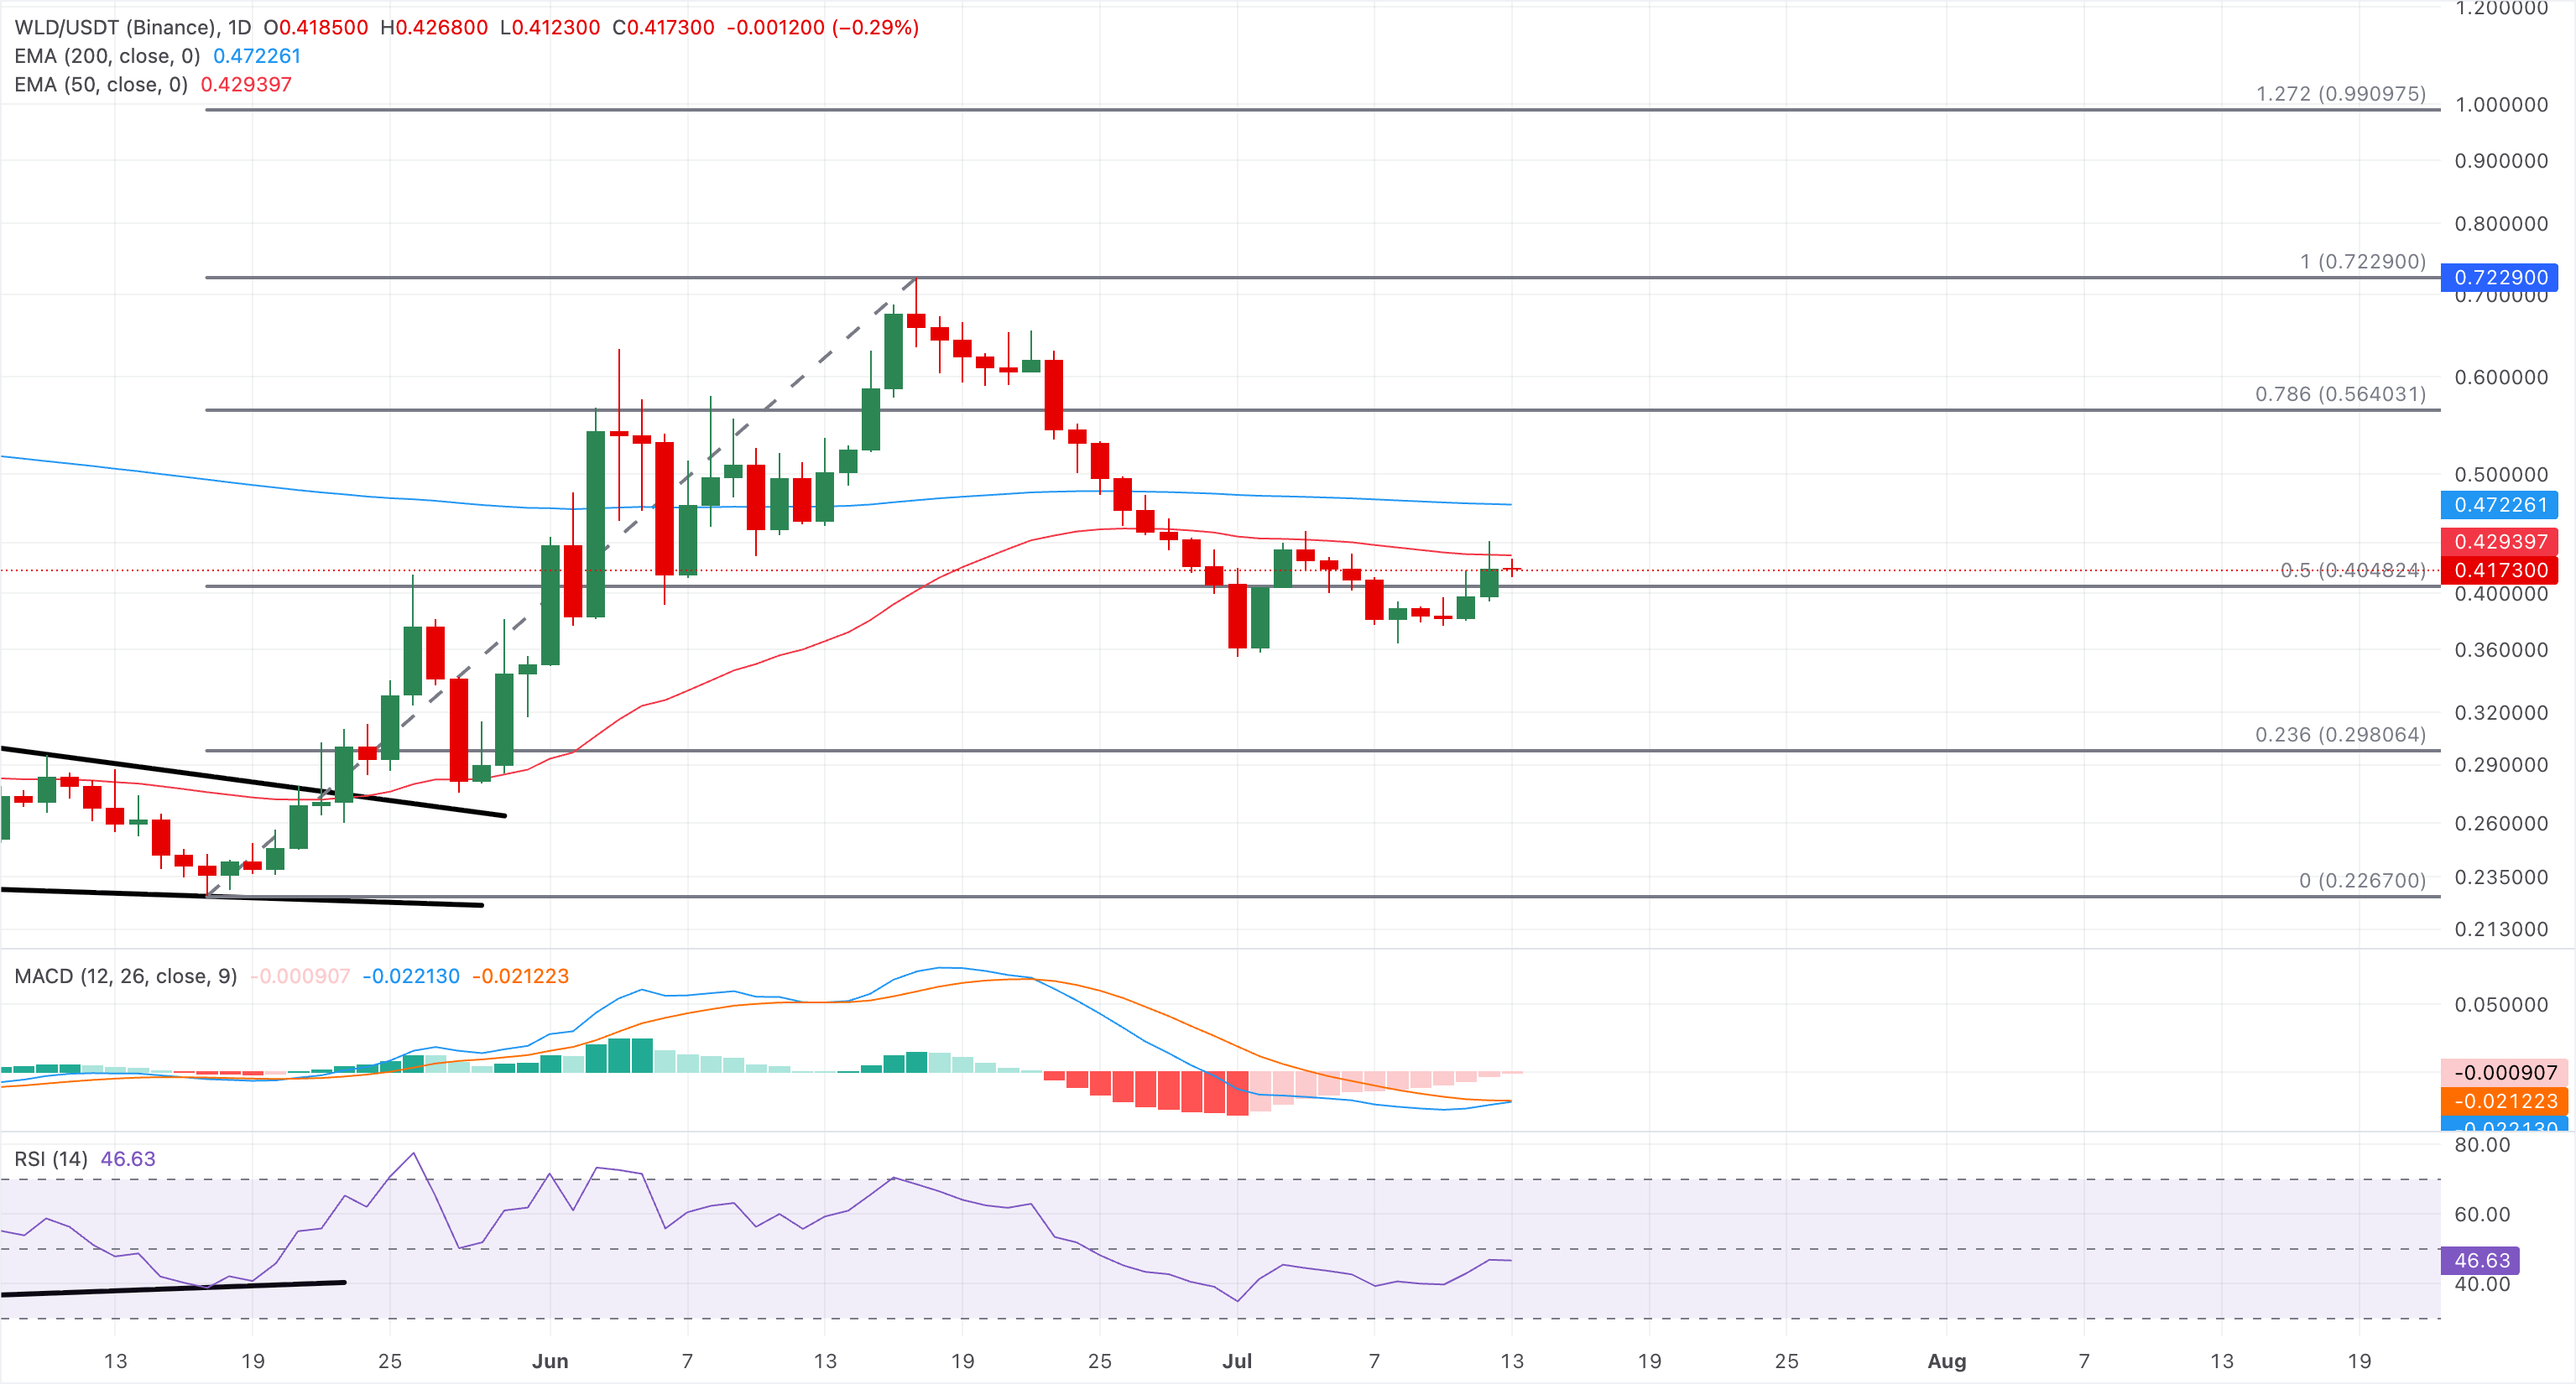
WLD/USDT daily price chart.

On the downside, immediate support is seen at the 50% Fibonacci retracement near $0.4048, where a sustained break would expose the deeper 23.6% retracement at roughly $0.2980.

(The technical analysis of this story was written with the help of an AI tool. Know more.)

Disclaimer: For information purposes only. Past performance is not indicative of future results.
placeholder
Is the world even ready for a petroyuan?The Petroyuan is no longer some fringe idea people throw around, thanks to the war Israel and America started with Iran. But we aren’t here to talk about that, nor about whether China/Jinpingwants a bigger role for the yuan in oil deals or not (It clearly does, duh). We’re here to understand whether the market, […]
Author  Cryptopolitan
Mar 20, Fri
The Petroyuan is no longer some fringe idea people throw around, thanks to the war Israel and America started with Iran. But we aren’t here to talk about that, nor about whether China/Jinpingwants a bigger role for the yuan in oil deals or not (It clearly does, duh). We’re here to understand whether the market, […]
placeholder
All hope seems lost for a Bitcoin recovery this year. Is it really over?Bitcoin is back in the danger zone, as prices fell to their lowest level since January on Thursday after selling pressure got worse across the crypto market. Bitcoin’s price is currently at $63,300, down by over 16% for the week. Over the past seven days, Bitcoin has lost about 13% and slipped into the $67,000...
Author  Cryptopolitan
Jun 04, Thu
Bitcoin is back in the danger zone, as prices fell to their lowest level since January on Thursday after selling pressure got worse across the crypto market. Bitcoin’s price is currently at $63,300, down by over 16% for the week. Over the past seven days, Bitcoin has lost about 13% and slipped into the $67,000...
placeholder
Gold Price Outlook For July 2026Gold trades near $4,140 on Tuesday, down 26% from January’s record high of $5,598 per ounce. This gold price prediction for July 2026 examines why the metal keeps falling and where it could bottom.Fiv
Author  Beincrypto
Jul 08, Wed
Gold trades near $4,140 on Tuesday, down 26% from January’s record high of $5,598 per ounce. This gold price prediction for July 2026 examines why the metal keeps falling and where it could bottom.Fiv
placeholder
Alibaba Stock Jumped 11%, Yet Wall Street Cut Its Price TargetsAlibaba stock (NYSE: BABA) jumped about 11% on July 8 to nearly $109, its best single day in 10 months.The pop followed a pre-earnings update showing its cash-losing delivery business improving and pr
Author  Beincrypto
Jul 10, Fri
Alibaba stock (NYSE: BABA) jumped about 11% on July 8 to nearly $109, its best single day in 10 months.The pop followed a pre-earnings update showing its cash-losing delivery business improving and pr
placeholder
TSMC, Samsung and SK Hynix now make up nearly 30% of emerging marketsTaiwan Semiconductor Manufacturing Co. (NYSE: TSM), Samsung Electronics (KRX: 005930) and SK Hynix (KRX: 000660) now make up more than 30% of the MSCI Emerging Markets Index. Their combined share is close to the Magnificent Seven’s weight in the S&P 500. Technology now covers about 45% of the emerging-market gauge. These three chipmakers are worth...
Author  Cryptopolitan
3 hours ago
Taiwan Semiconductor Manufacturing Co. (NYSE: TSM), Samsung Electronics (KRX: 005930) and SK Hynix (KRX: 000660) now make up more than 30% of the MSCI Emerging Markets Index. Their combined share is close to the Magnificent Seven’s weight in the S&P 500. Technology now covers about 45% of the emerging-market gauge. These three chipmakers are worth...
goTop
quote