




Crypto Today: Bitcoin, Ethereum, XRP advance amid renewed capital inflows
- Bitcoin extends gains above $61,000 amid ETF inflows and a broader crypto market recovery.
- Ethereum ticks up for the second consecutive day, supported by the resurgence of capital inflows and improving sentiment.
- XRP’s rebound tests the $1.11 resistance level, with a MACD buy signal and a rising RSI strengthening the technical outlook.
Bitcoin (BTC) maintains its upward momentum, holding above the $61,000 mark at the time of writing on Friday. Major altcoins such as Ethereum (ETH) and Ripple (XRP) are also posting gains, signaling a modest uptick in market sentiment and renewed risk appetite among investors.
Risk appetite boosts capital inflows
For several weeks, risk sentiment in the crypto market was subdued, weighed down by macroeconomic headwinds, geopolitical uncertainties, and a dearth of clear catalysts.
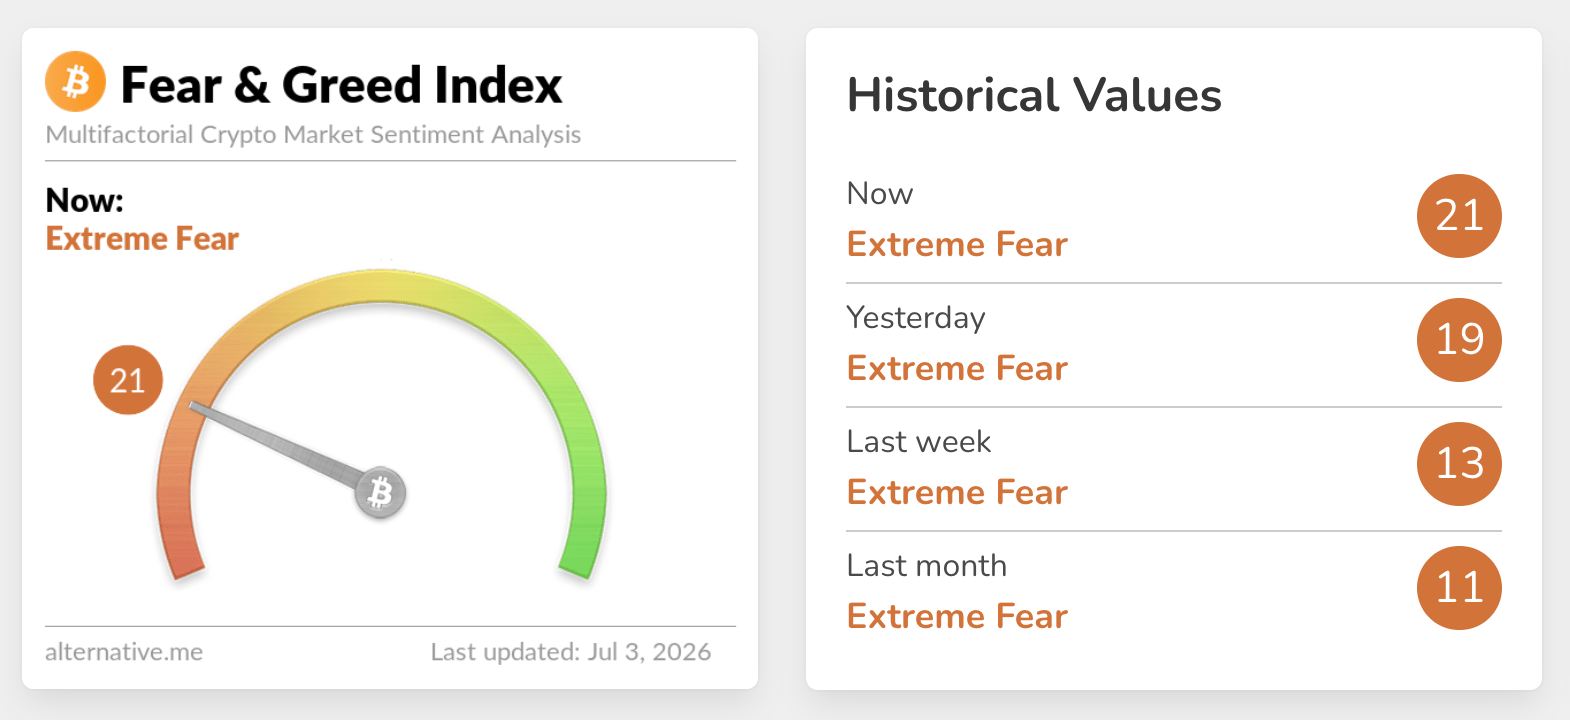
However, sentiment is now showing tentative signs of recovery, as evidenced by the Crypto Fear & Greed Index, which ticked up to 21 on Friday from 19 the previous day, still deep in ‘Extreme Fear’ territory. Should this trend persist, we could see further capital inflows as investors gradually regain confidence in risk assets.
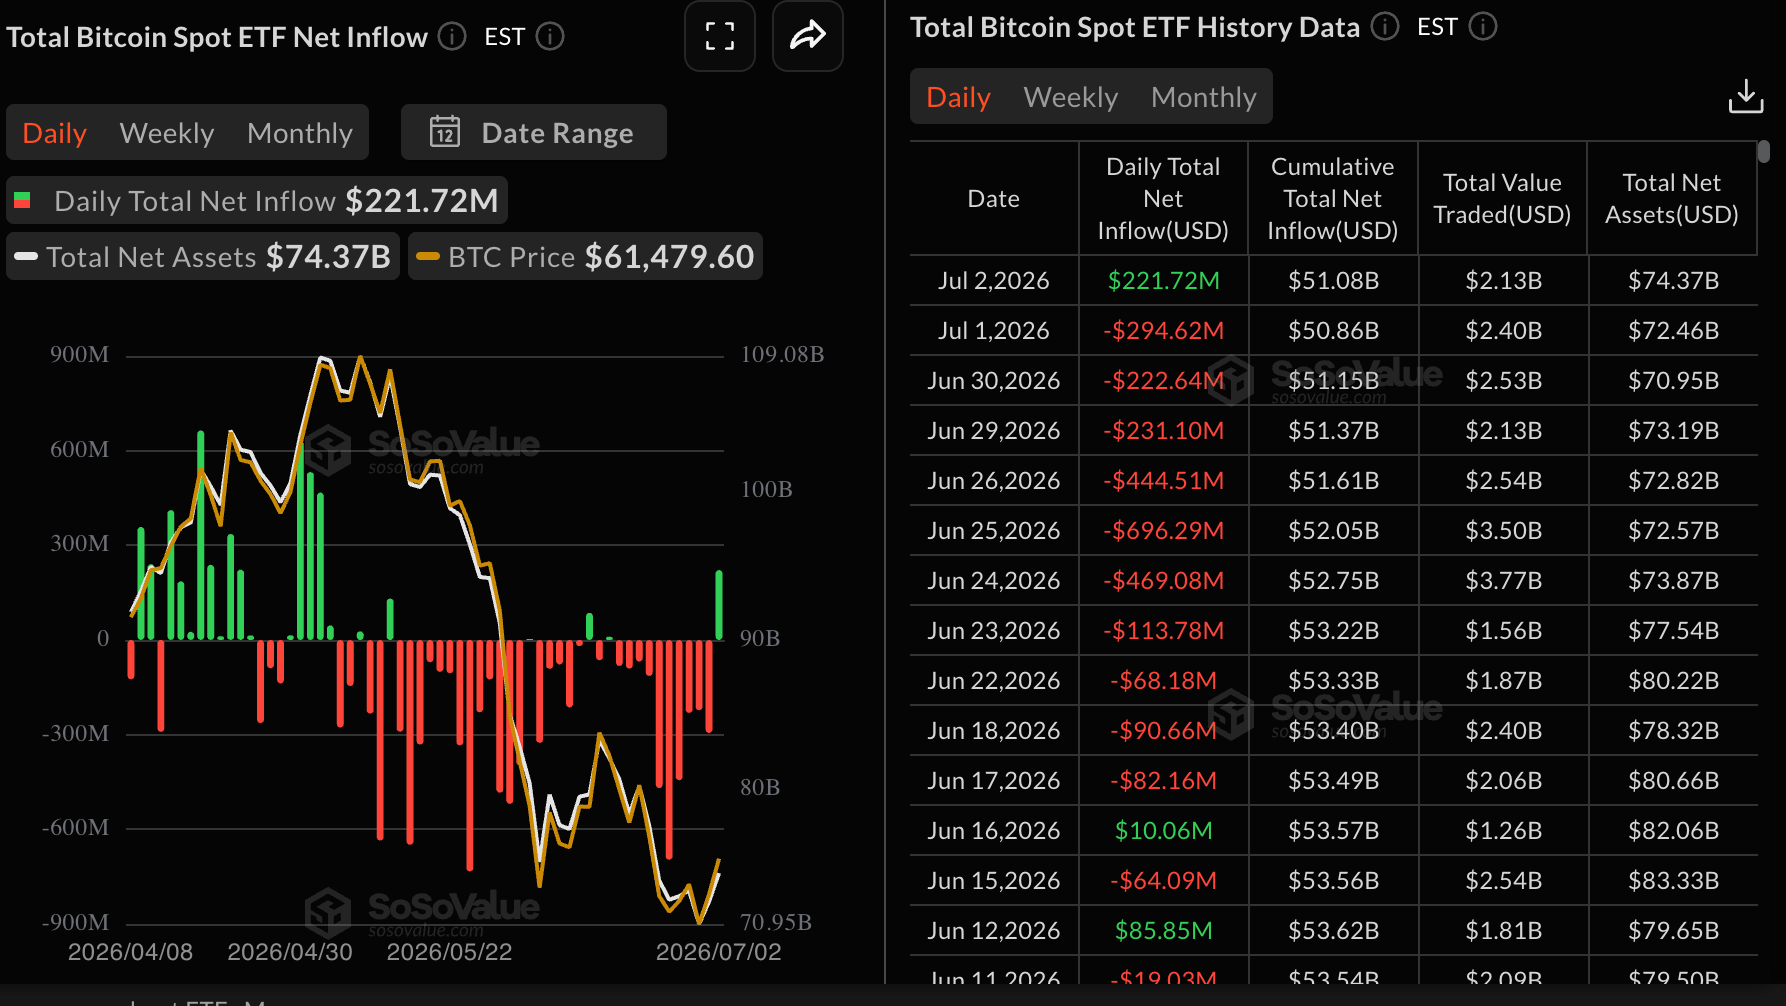
Institutional investors are making a notable return to Bitcoin, as evidenced by Thursday’s spot BTC Exchange-Traded Fund (ETF) inflows of $221 million, the first significant uptick since mid-June and a clear break from a nine-day stretch of outflows.
SoSoValue data highlight cumulative ETF inflows of $51 billion and average net assets of $74 billion. This resurgence of institutional capital signals growing confidence and is lending crucial support to Bitcoin’s ongoing recovery.
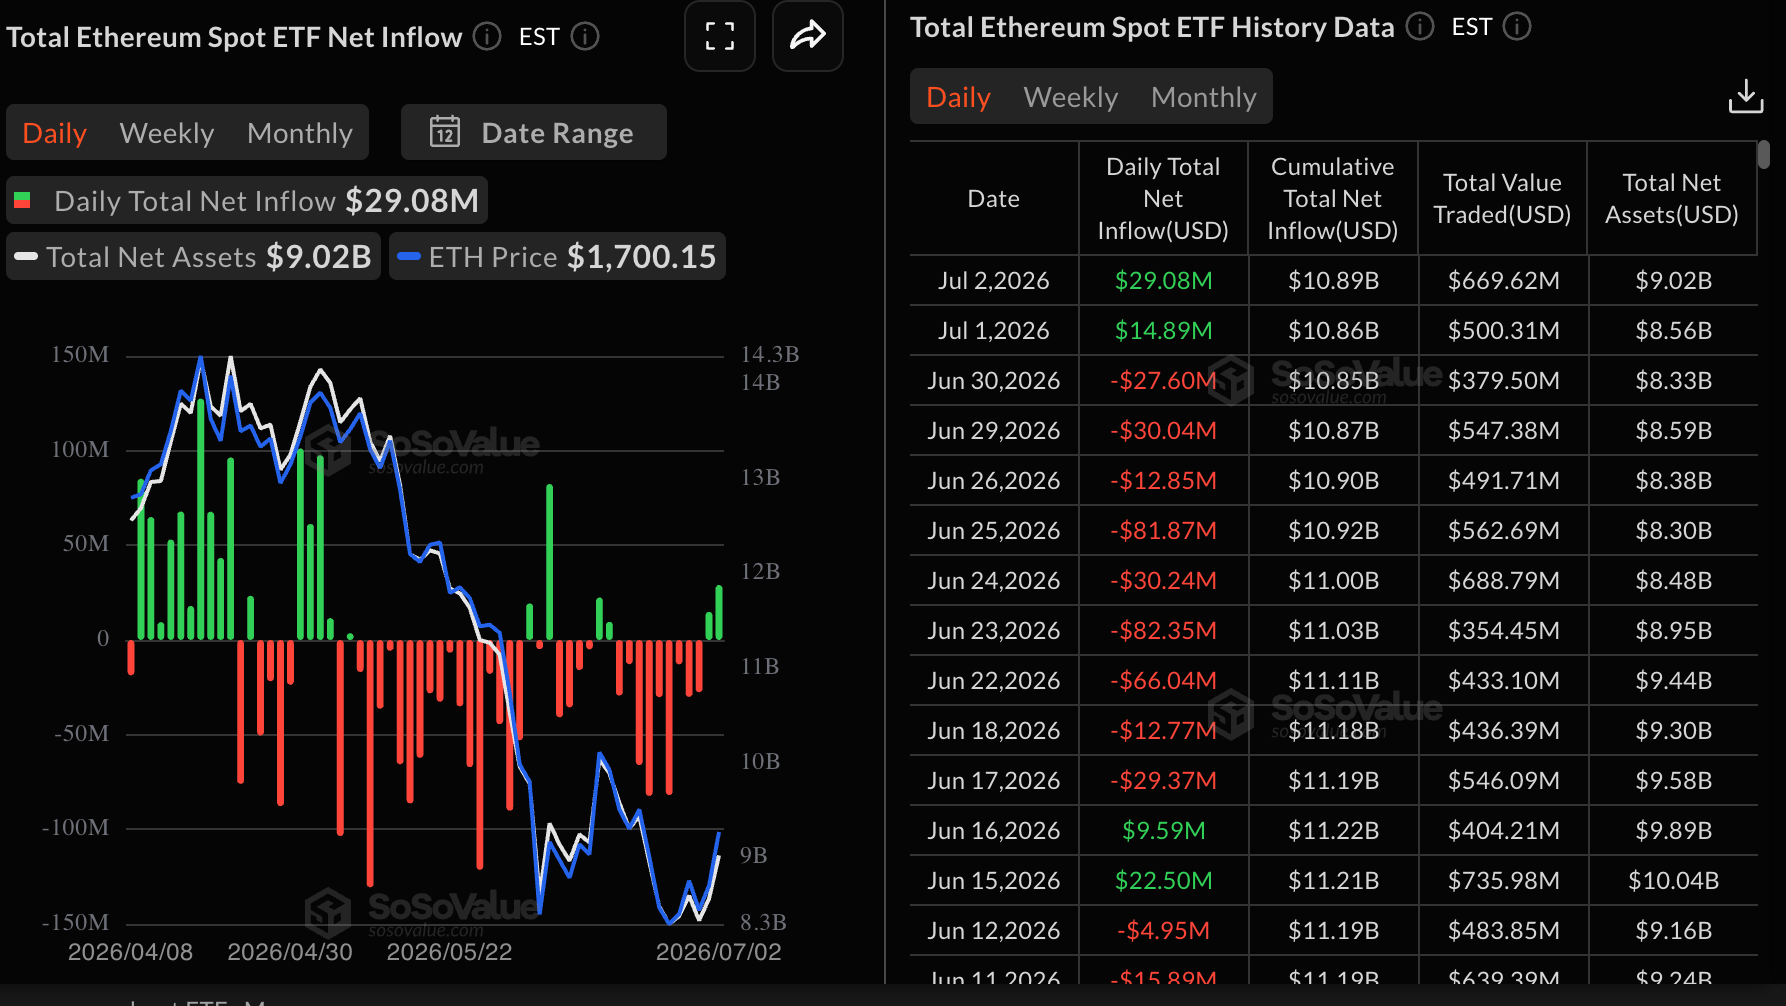
Ethereum spot ETFs posted a second consecutive day of inflows, with $29 million recorded on Thursday, nearly doubling Wednesday’s $15 million. If sustained, the inflow momentum would back the ongoing recovery and cement investor confidence amid renewed market optimism. Cumulative inflows average $11 billion with net assets under management at $9 billion.
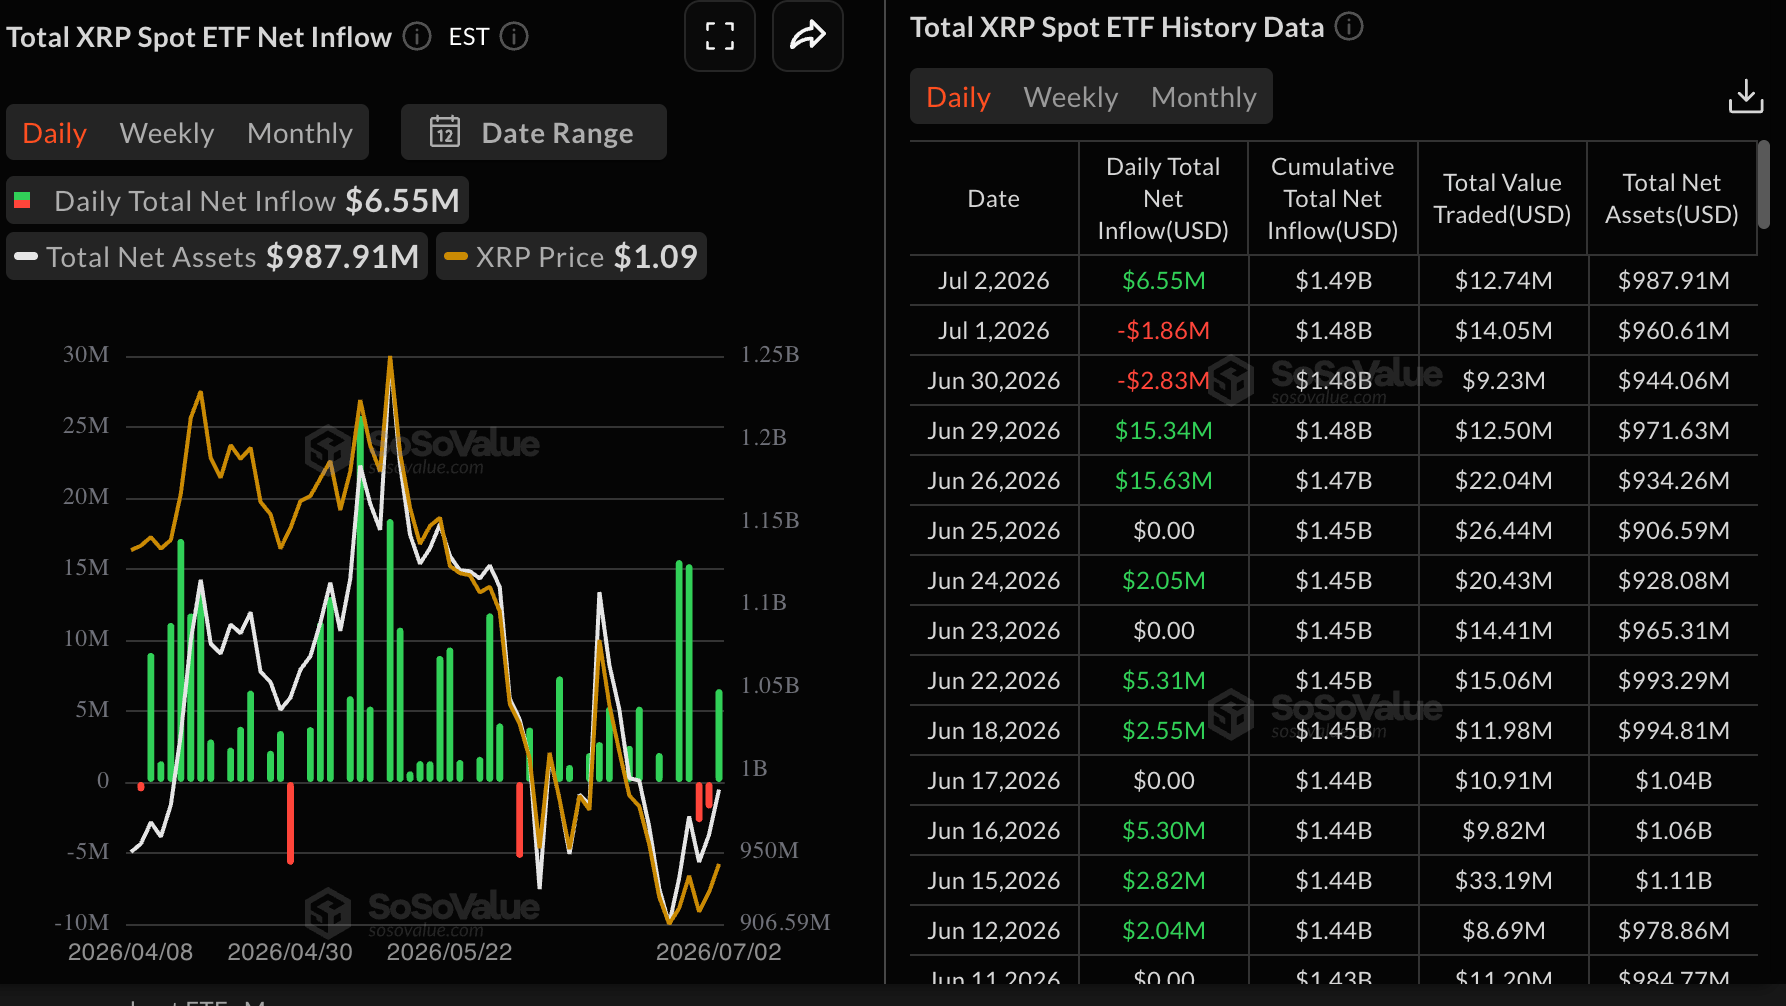
US-listed XRP spot ETFs attracted inflows of nearly $7 million on Thursday, breaking two consecutive days of outflows. Despite withdrawals on Tuesday and Wednesday, cumulative outflows remain steady at $1.48 billion, with net assets under management averaging $988 million.
Price analysis: Bitcoin buyers tighten grip as recovery gains momentum
Bitcoin trades at $61,725, extending its rebound for the third consecutive day. Still, the Crypto King sustains a bearish near-term tone as it sits well below the 50-day, 100-day and 200-day Exponential Moving Averages (EMAs). The 50-day EMA at roughly $66,025, the 100-day EMA near $69,818 and the 200-day EMA around $75,952 all fan out above spot, suggesting the broader downtrend remains in place despite the recent stabilization.
The Parabolic SAR at about $62,200 also hovers just above price, reinforcing overhead pressure, while the Relative Strength Index (RSI) lingering in the mid-40s hints at only modest, corrective upside momentum rather than a decisive reversal.
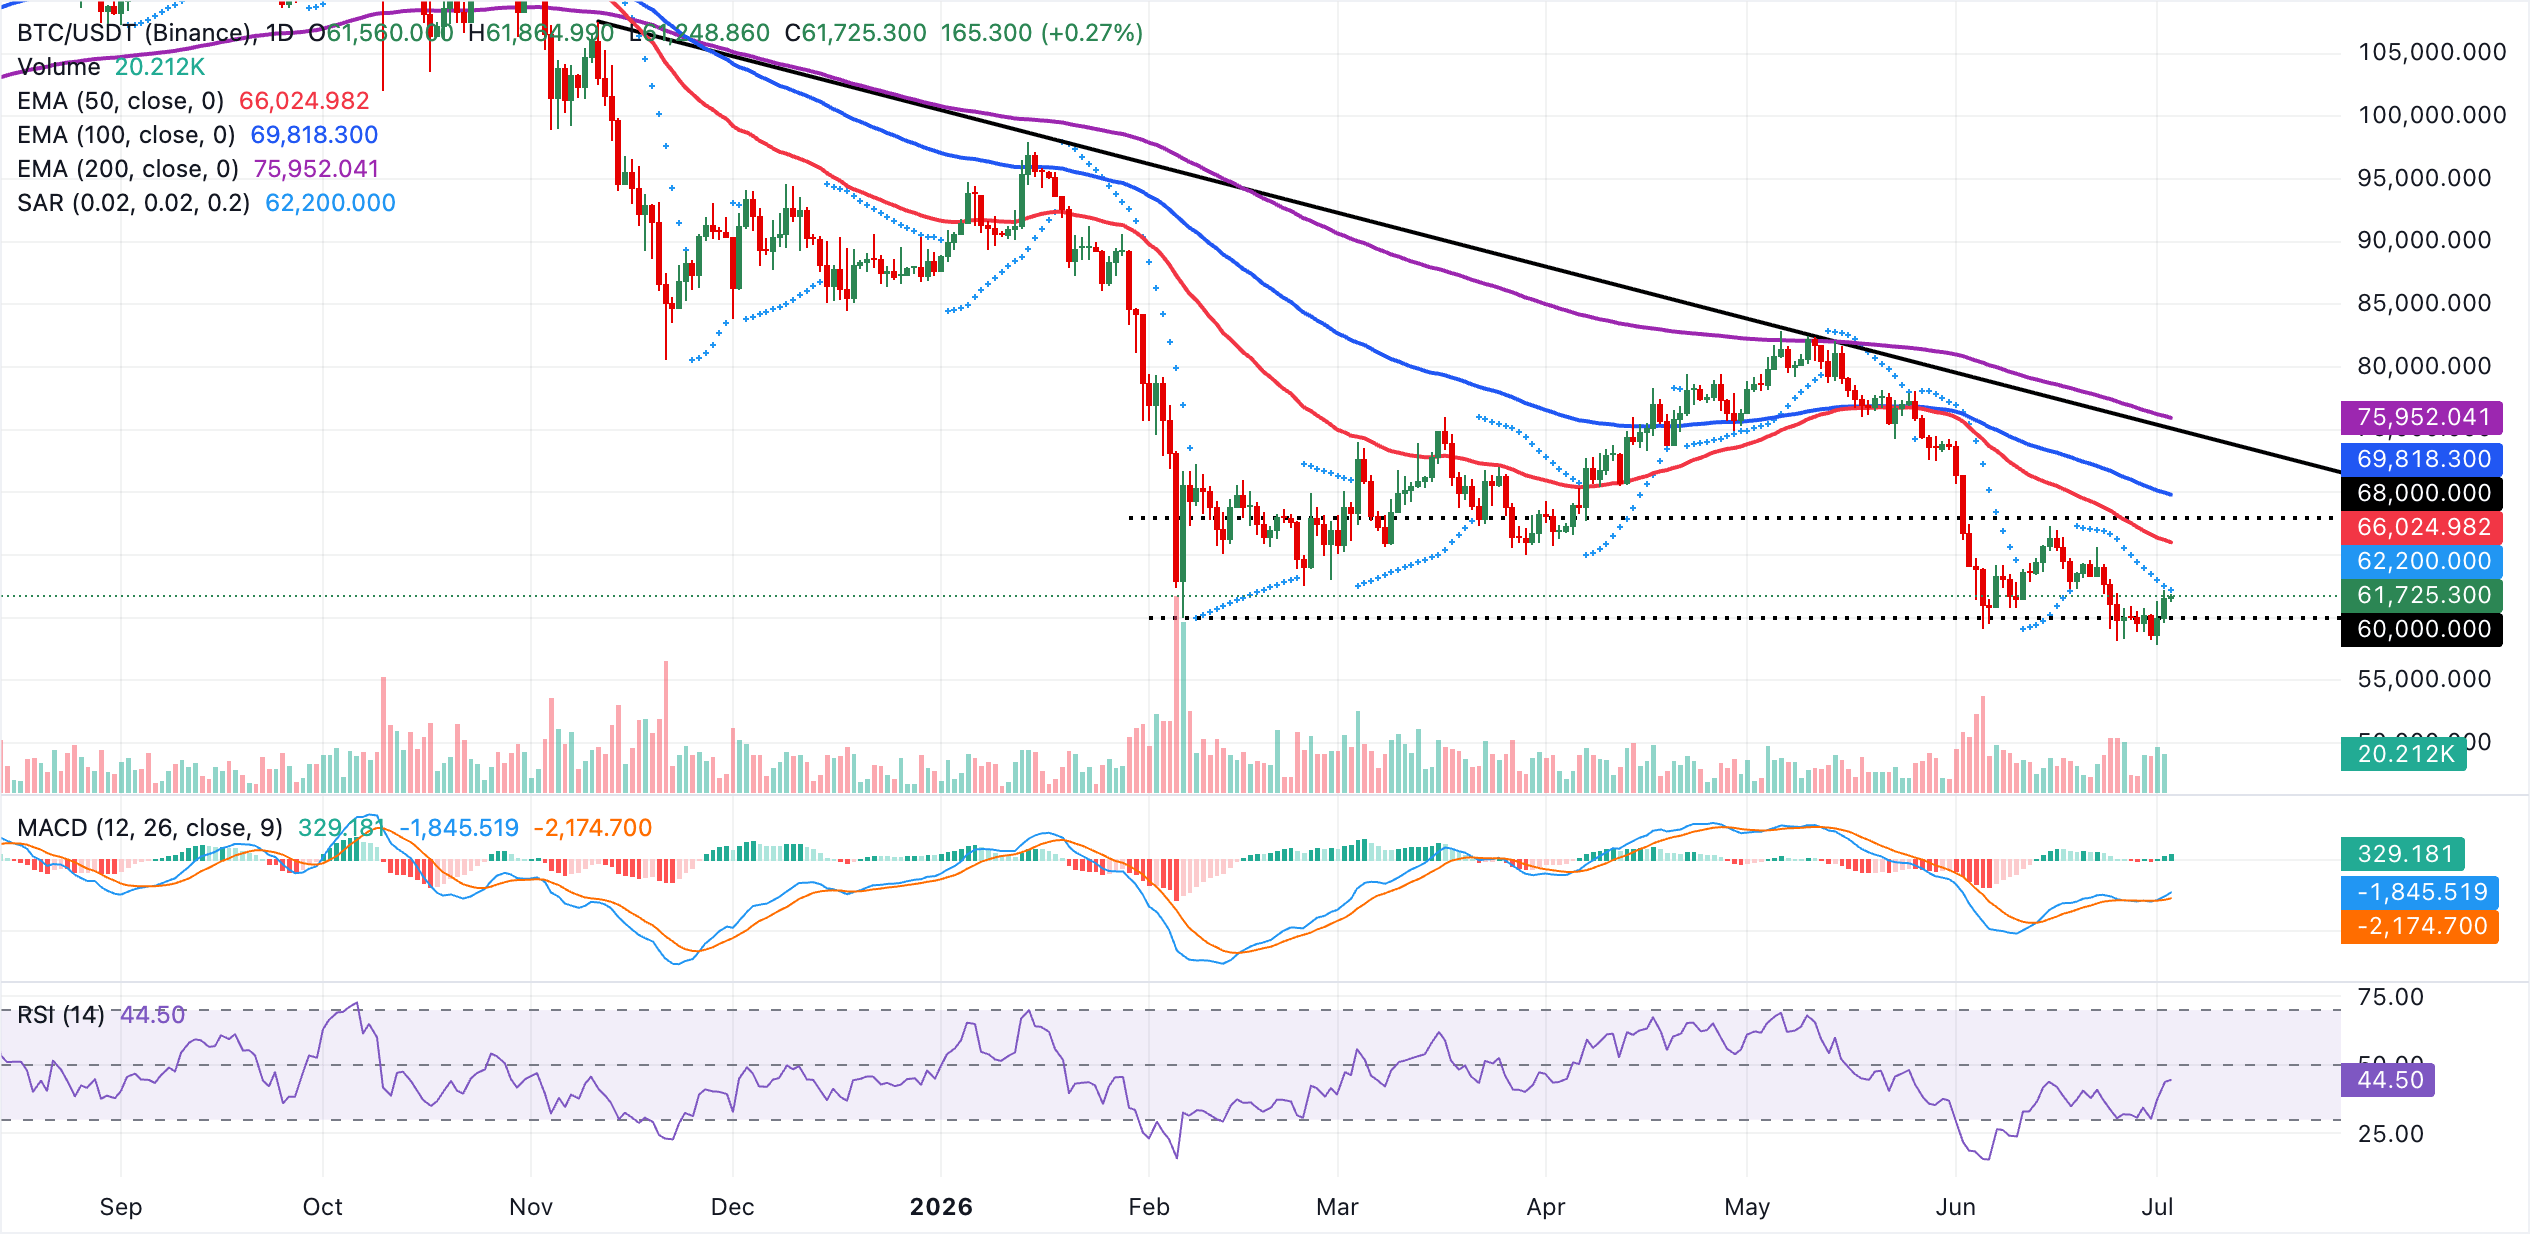
On the topside, immediate resistance is defined first by the Parabolic SAR at $62,200, with the 50-day EMA at $66,025 acting as the next significant barrier. Beyond these key barriers, the 100-day EMA at $69,818 and the downward resistance trendline break price near $75,072 converge with the 200-day EMA to create a broader supply zone that would need to be reclaimed to weaken the prevailing bearish structure.
On the flip side, immediate support is highlighted by psychological round-number levels at $60.000 and $58,000, respectively. Trading below this demand range would leave Bitcoin vulnerable to renewed selling toward a new yearly floor.
Altcoins technical outlook: Ethereum and XRP extend modest gains
Ethereum edges higher above $1,700, marking three straight days of gains. Momentum has improved as reflected in the RSI, which hovers just above 50 on the daily chart and the Moving Average Convergence Divergence (MACD), with its histogram in positive territory, hinting that selling pressure is easing.
Despite the upswing, the several structural levels cap ETH's upside. Trading below the 50-day, 100-day and 200-day EMAs reinforces a broader downtrend.
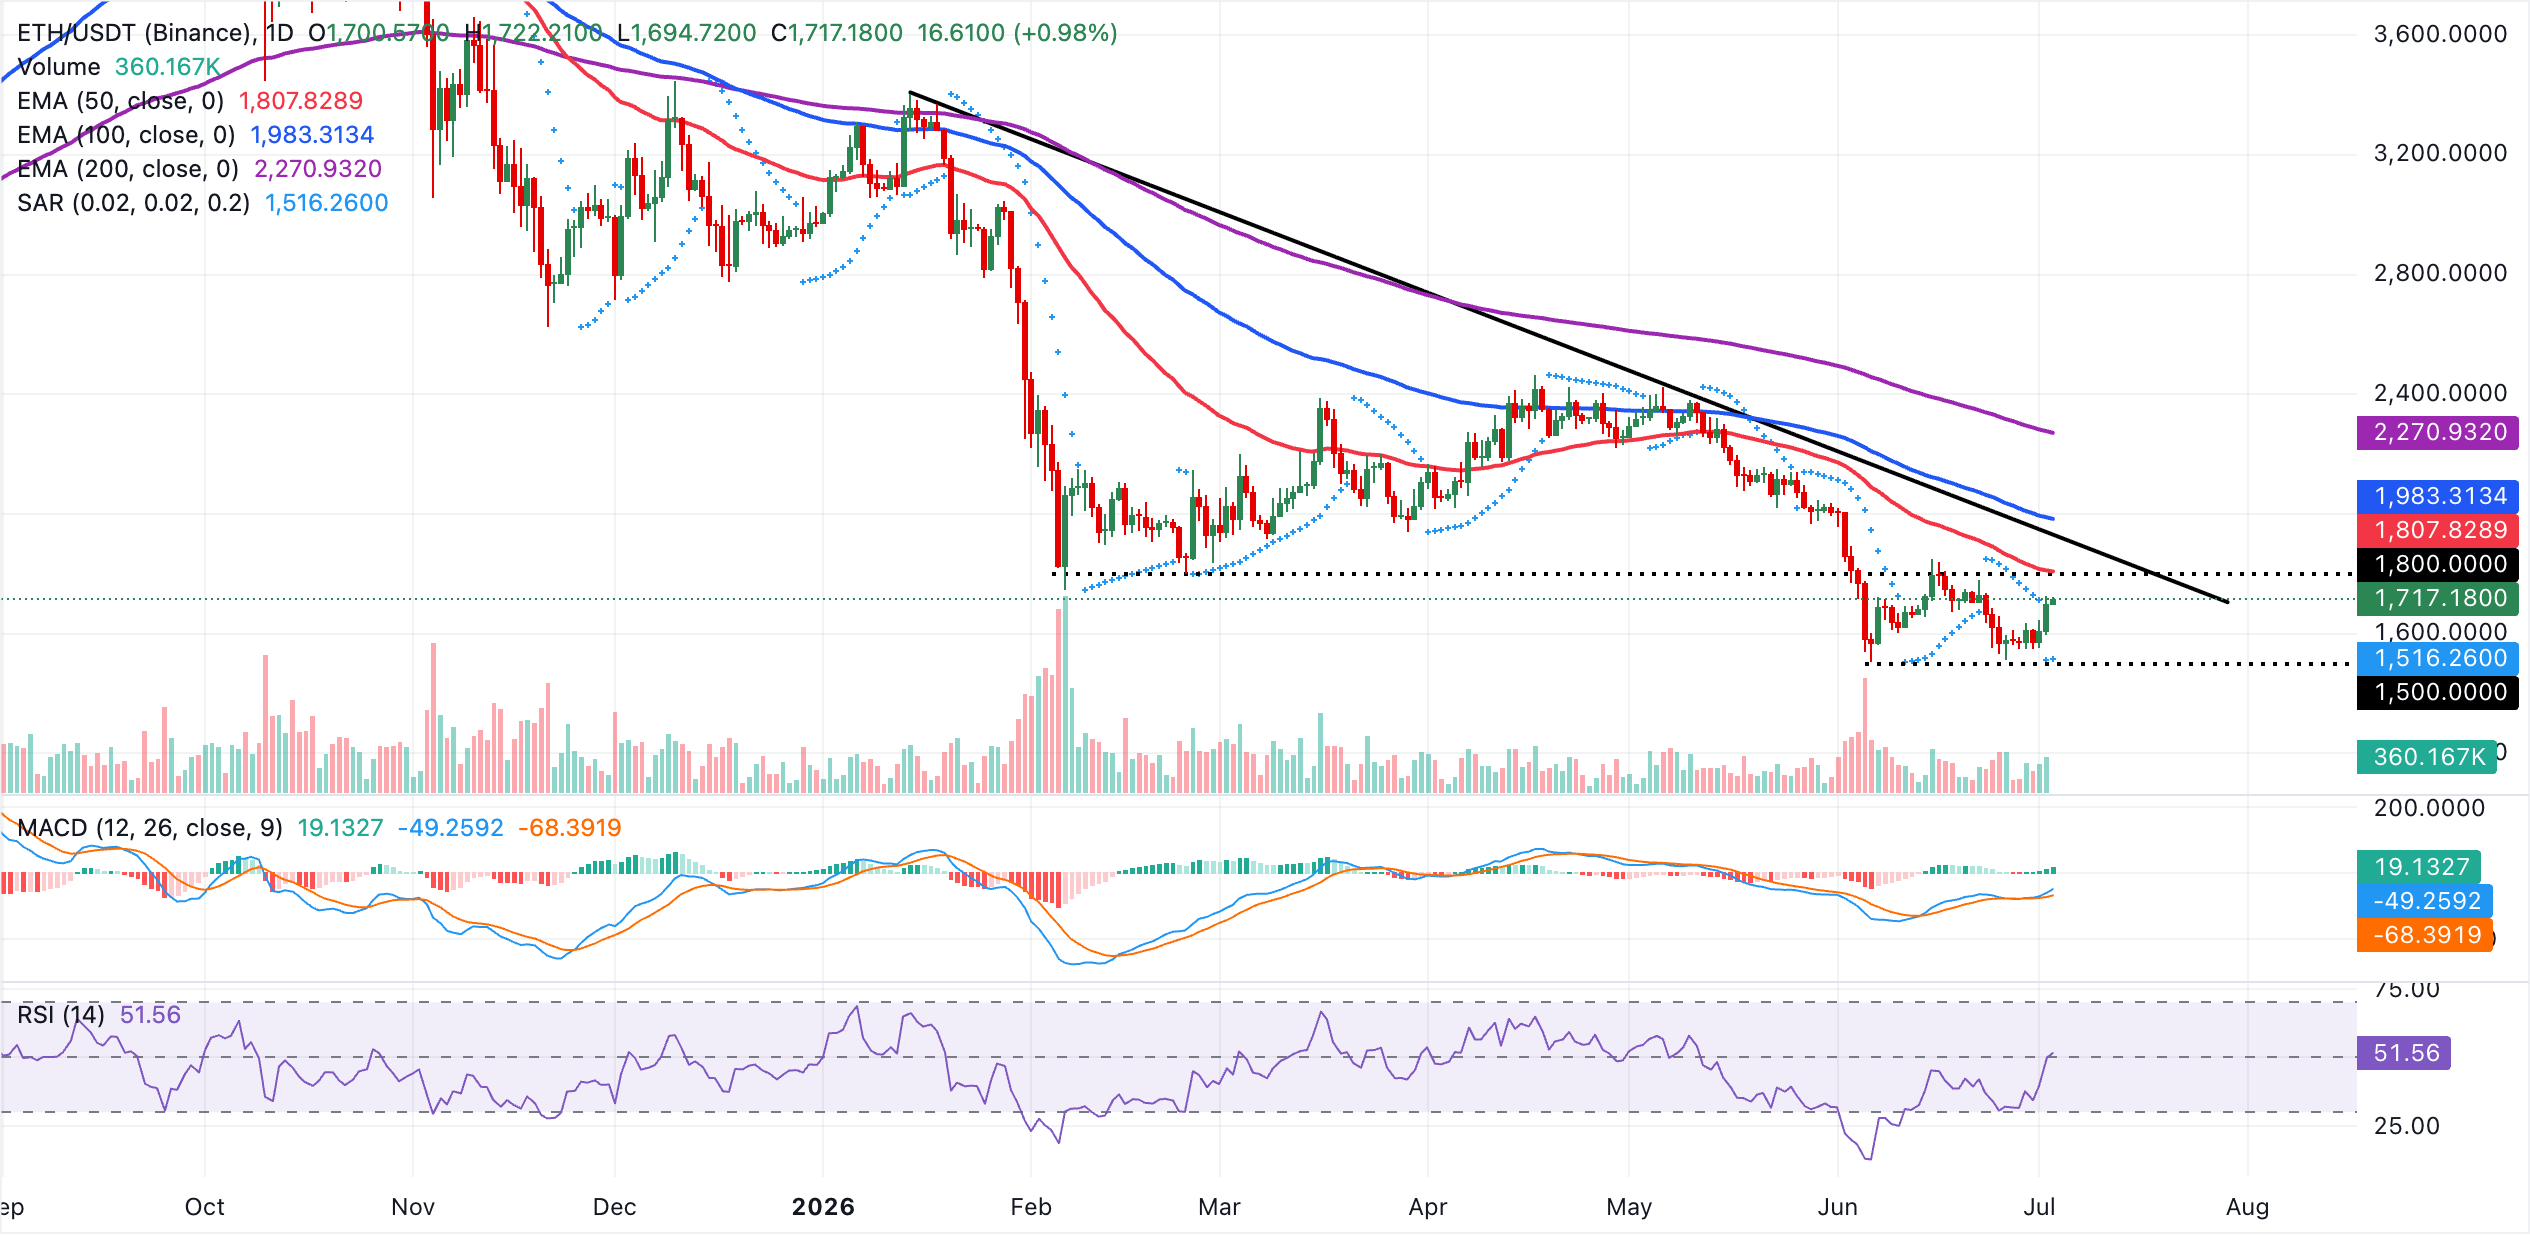
On the topside, immediate resistance is seen at the 50-day EMA around $1,808, followed by the descending resistance trendline region referenced near $1,928. Further north, the 100-day EMA at about $1,983 and the 200-day EMA close to $2,271 define a broader supply band that would need to be reclaimed to shift the medium-term tone. Looking down, initial support is provided by the Parabolic SAR around $1,516, where a daily close below would likely reopen the path toward lower lows despite the currently improving momentum backdrop.
XRP trades at $1.10, as bulls tighten their grip. The psychological support at $1.03 allowed buyers to reengage, aligning with the broader crypto market's short-term positive outlook. Momentum is improving, backed by the RSI's recovery toward a neutral 46 on the daily chart and the MACD histogram, which has recently turned slightly positive. Together, both indicators hint at modest upside momentum within a broader downtrend.
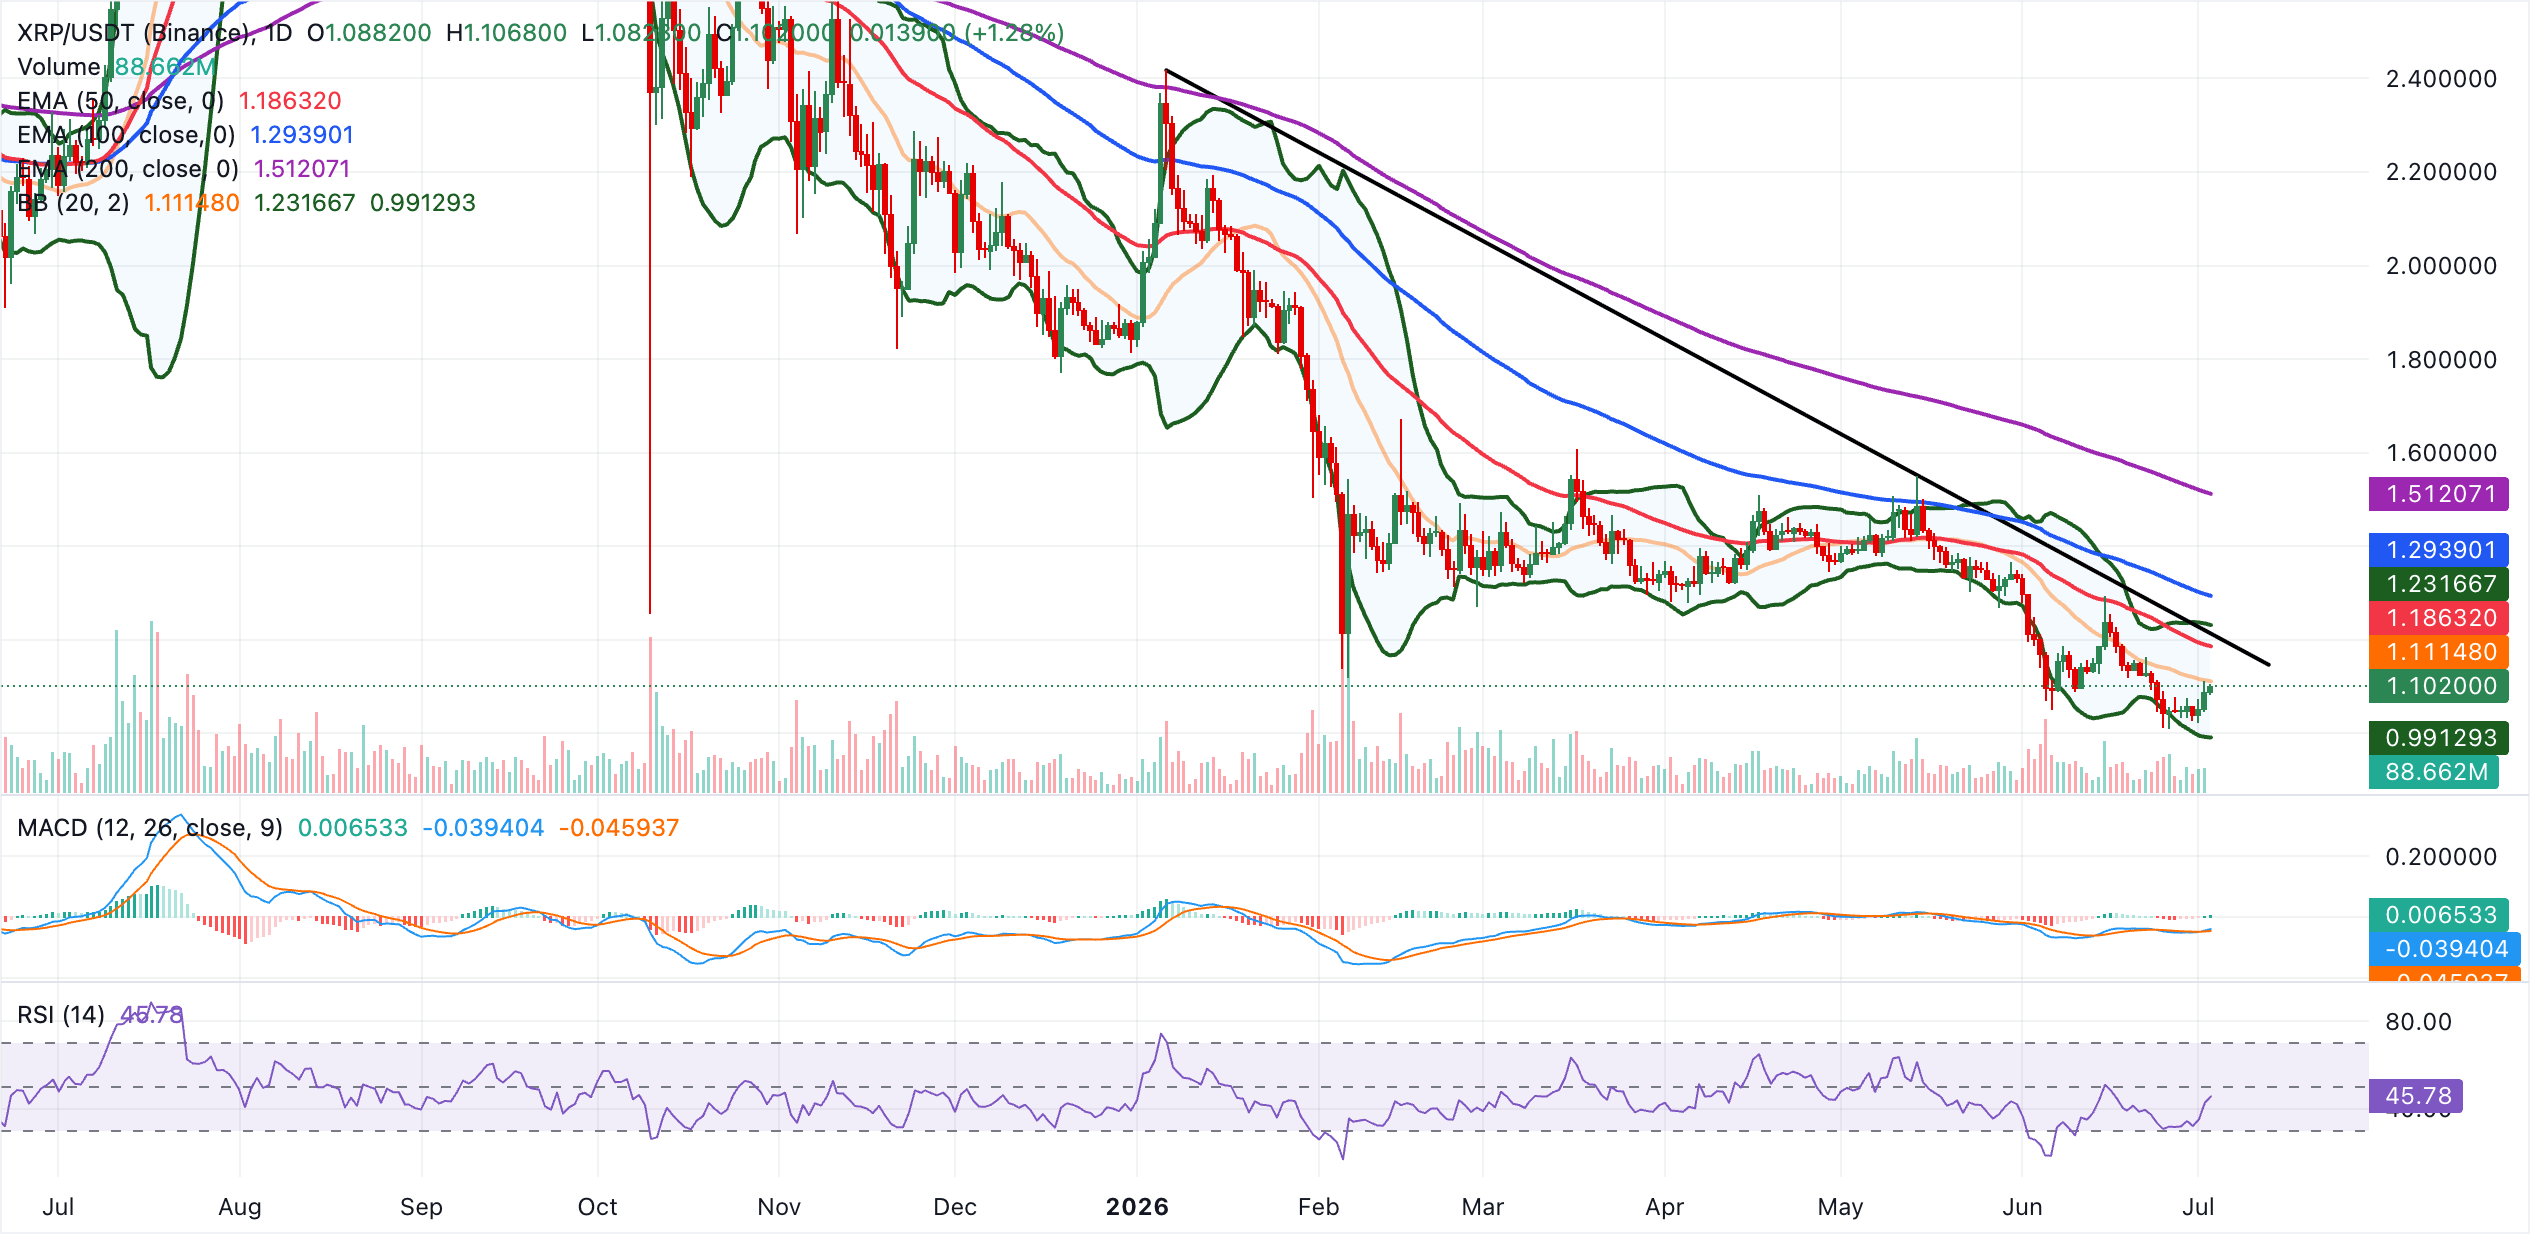
On the topside, initial resistance emerges at the 20-day Bollinger middle band around $1.11, followed by the downtrend resistance trendline break area near $1.21 and then the 50-day EMA close to $1.19, forming a dense supply zone before the upper Bollinger band near $1.23. Higher up, the 100-day EMA around $1.29 and the 200-day EMA near $1.51 mark more substantial barriers.
Conversely, the lone nearby structural cushion is the Bollinger lower band, now around $0.99, where buyers could attempt to slow any further decline.
(The technical analysis of this story was written with the help of an AI tool.)
Crypto ETF FAQs
An Exchange-Traded Fund (ETF) is an investment vehicle or an index that tracks the price of an underlying asset. ETFs can not only track a single asset, but a group of assets and sectors. For example, a Bitcoin ETF tracks Bitcoin’s price. ETF is a tool used by investors to gain exposure to a certain asset.
Yes. The first Bitcoin futures ETF in the US was approved by the US Securities & Exchange Commission in October 2021. A total of seven Bitcoin futures ETFs have been approved, with more than 20 still waiting for the regulator’s permission. The SEC says that the cryptocurrency industry is new and subject to manipulation, which is why it has been delaying crypto-related futures ETFs for the last few years.
Yes. The SEC approved in January 2024 the listing and trading of several Bitcoin spot Exchange-Traded Funds, opening the door to institutional capital and mainstream investors to trade the main crypto currency. The decision was hailed by the industry as a game changer.
The main advantage of crypto ETFs is the possibility of gaining exposure to a cryptocurrency without ownership, reducing the risk and cost of holding the asset. Other pros are a lower learning curve and higher security for investors since ETFs take charge of securing the underlying asset holdings. As for the main drawbacks, the main one is that as an investor you can’t have direct ownership of the asset, or, as they say in crypto, “not your keys, not your coins.” Other disadvantages are higher costs associated with holding crypto since ETFs charge fees for active management. Finally, even though investing in ETFs reduces the risk of holding an asset, price swings in the underlying cryptocurrency are likely to be reflected in the investment vehicle too.
Recommended Articles


