


Ethereum Price Forecast: Network activity drops as prices stay muted
Ethereum price today: $2,290
- Ethereum active addresses have failed to fuel network activity, with transaction counts falling by 1 million over the past week.
- Staking inflows dropped by more than 80%, in line with a broader weakness across other key onchain metrics.
- ETH recovers the 50-day EMA but faces resistance at the near-term moving average.
Ethereum (ETH) is attempting to recover above the $2,300 level on Thursday, following a week of declining network activity.
Active addresses, which track the number of wallets sending and receiving tokens or interacting with smart contracts, have risen over the past week after a steady decline the previous week.
-1778793205500.png)
While the growth appears positive on the surface, it wasn't accompanied by a subsequent rise in transaction counts, which measure the volume of user activity on the blockchain. Transaction counts fell sharply over the past week by roughly 1 million, before slightly picking up in the past few days.
The divergence between active addresses and transaction counts indicates a quiet network where the active user base isn't driving network usage.
The weakened network activity is also evident in Ethereum's proof-of-stake participation. Staking inflows have dropped by more than 80% over the past week, with the total value staked declining by roughly 100K ETH to 39.01 million ETH.
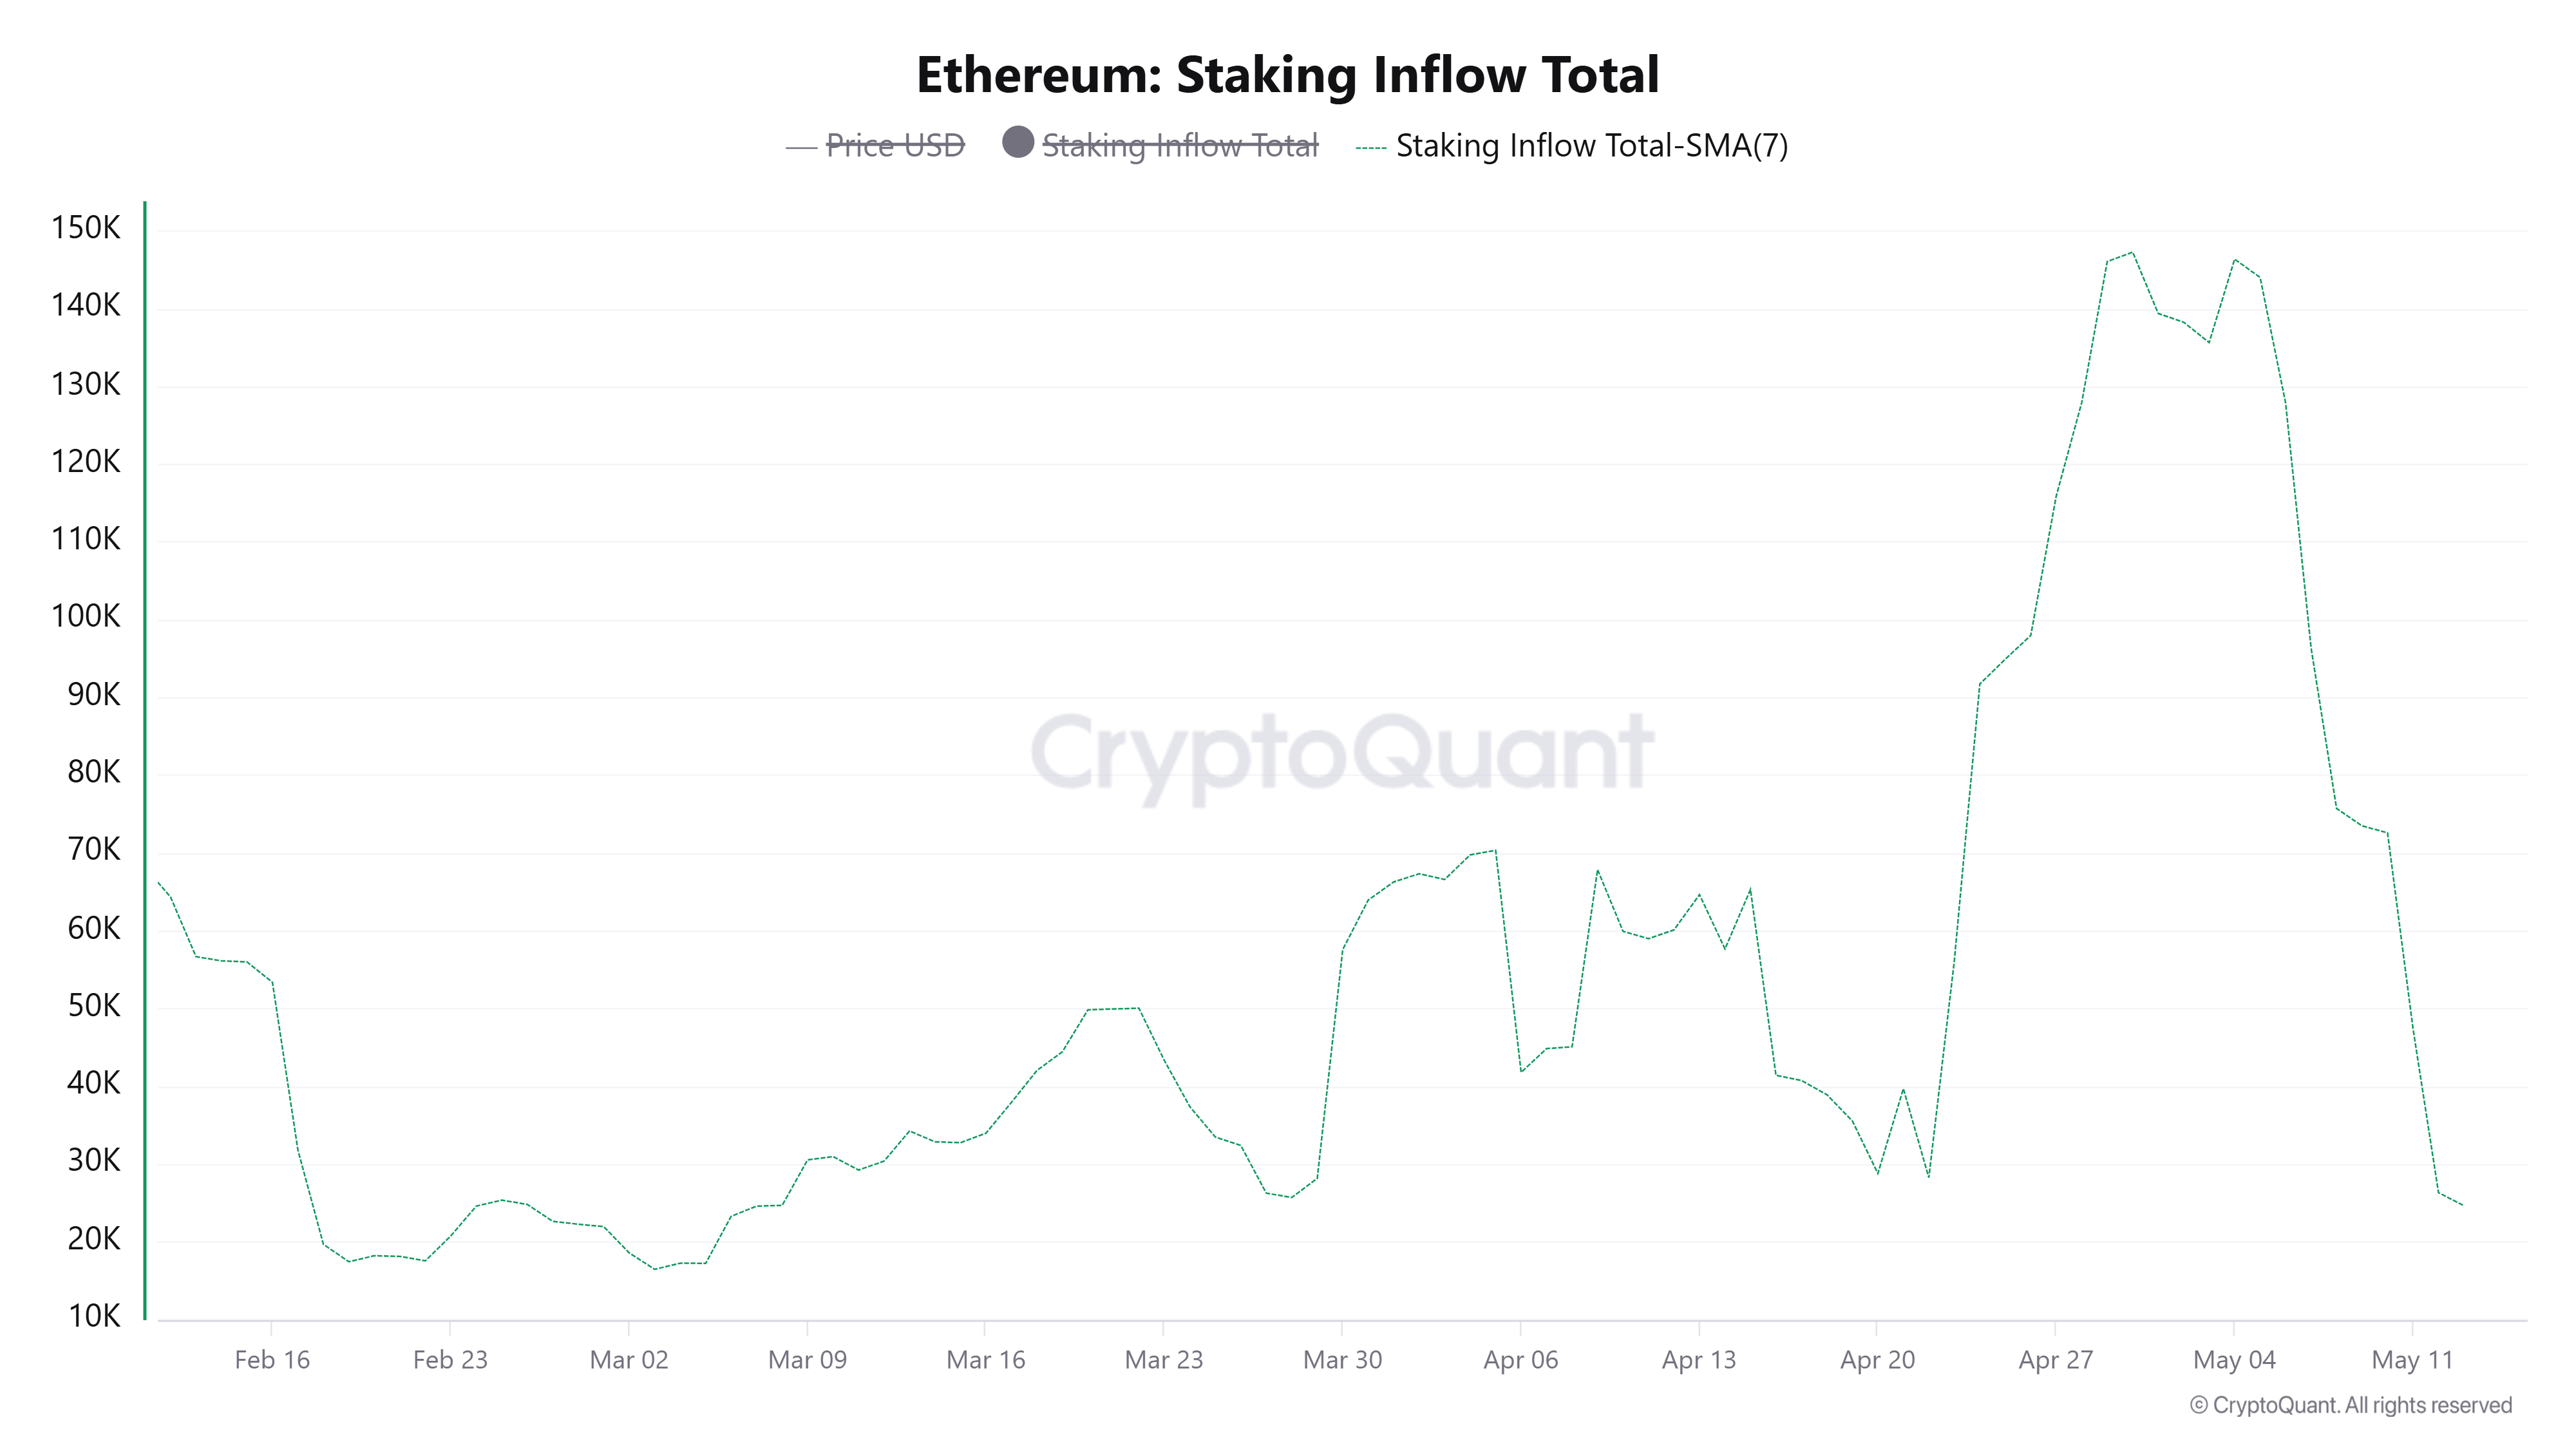
The drop comes amid community discussions around a potential reduction in staking rewards. Grayscale's Head of Research, Zach Pandl, recommended rewarding staked ETH only up to a certain point to reduce ETH's net issuance and boost scarcity.
Meanwhile, onchain data shows ETH faced selling pressure over the past week amid rising exchange deposits and exchange-traded fund (ETF) outflows, while derivatives traders pounced on the dip.
Ethereum Price Forecast: ETH recovers 50-day EMA
Ethereum saw $43.8 million in liquidations over the past 24 hours, led by $23.4 million in short liquidations.
On the daily chart, ETH is holding a neutral to slightly capped tone as it consolidates between key moving averages. Price stands above the 50-day Exponential Moving Average (EMA) at around $2,274, which lends nearby support, but remains below the 20-day EMA near $2,306 and the longer-term 100-day EMA around $2,351, signaling overhead supply limiting upside attempts.
Momentum is mixed, with the Relative Strength Index (RSI) hovering around 49 and the Stochastic Oscillator (Stoch) slipping toward the oversold band, which suggests waning bullish pressure but not yet a decisive bearish breakdown.
On the downside, initial support is seen at the 50-day EMA, followed by a more solid horizontal floor around $2,211 and then $2,108 if selling deepens. Further south, broader structural cushions align at $1,909 and $1,741.
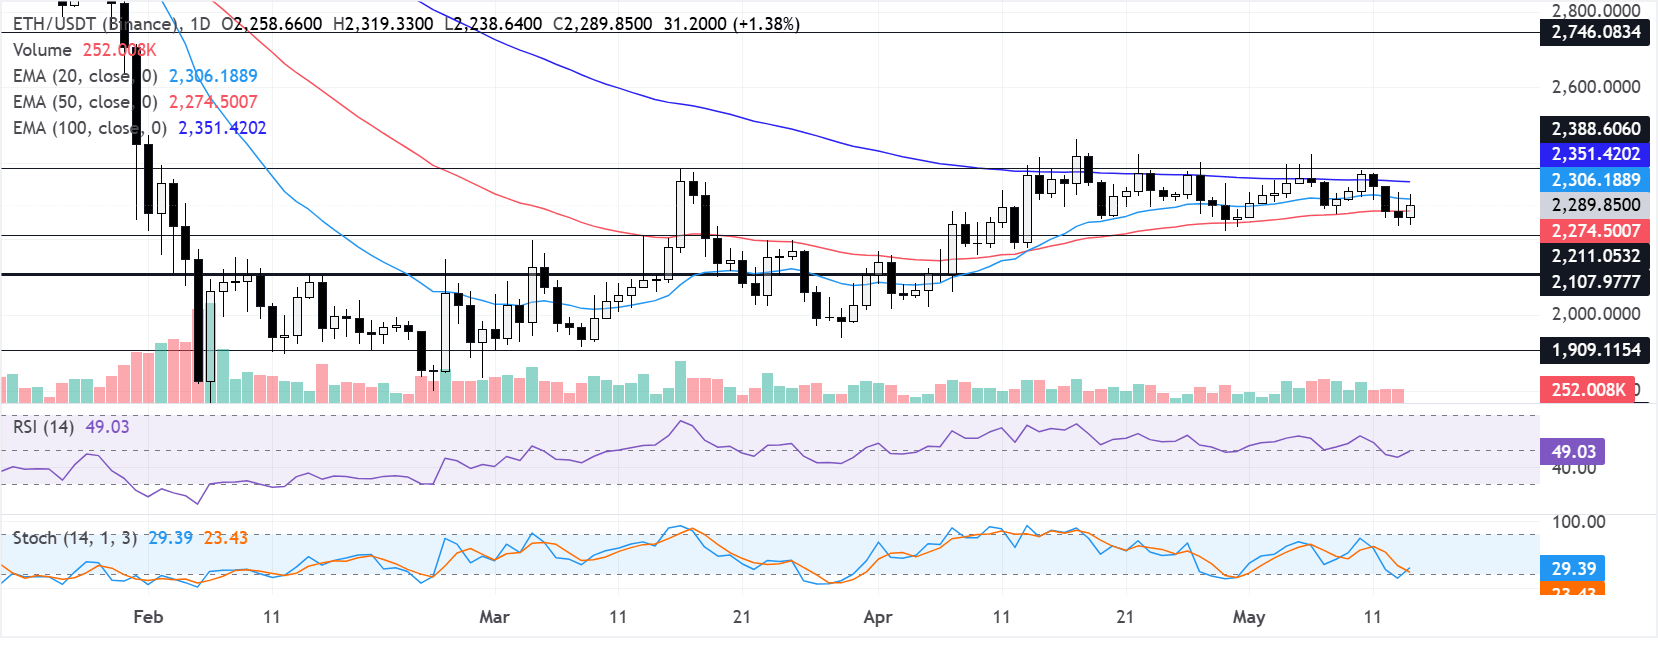
On the topside, immediate resistance lies at the 20-day EMA around $2,306, followed by the 100-day EMA near $2,351 and the horizontal cap at roughly $2,389. A daily close above this cluster would be needed to ease the current cap and open the way toward the higher resistance band at $2,746.
(The technical analysis of this story was written with the help of an AI tool.)
Recommended Articles


