




Crypto Today: Bitcoin, Ethereum hold key support, XRP stays weak as Iran war dampens sentiment
- Bitcoin steadies above $68,000, but its upside remains largely capped amid war-driven risk-off sentiment.
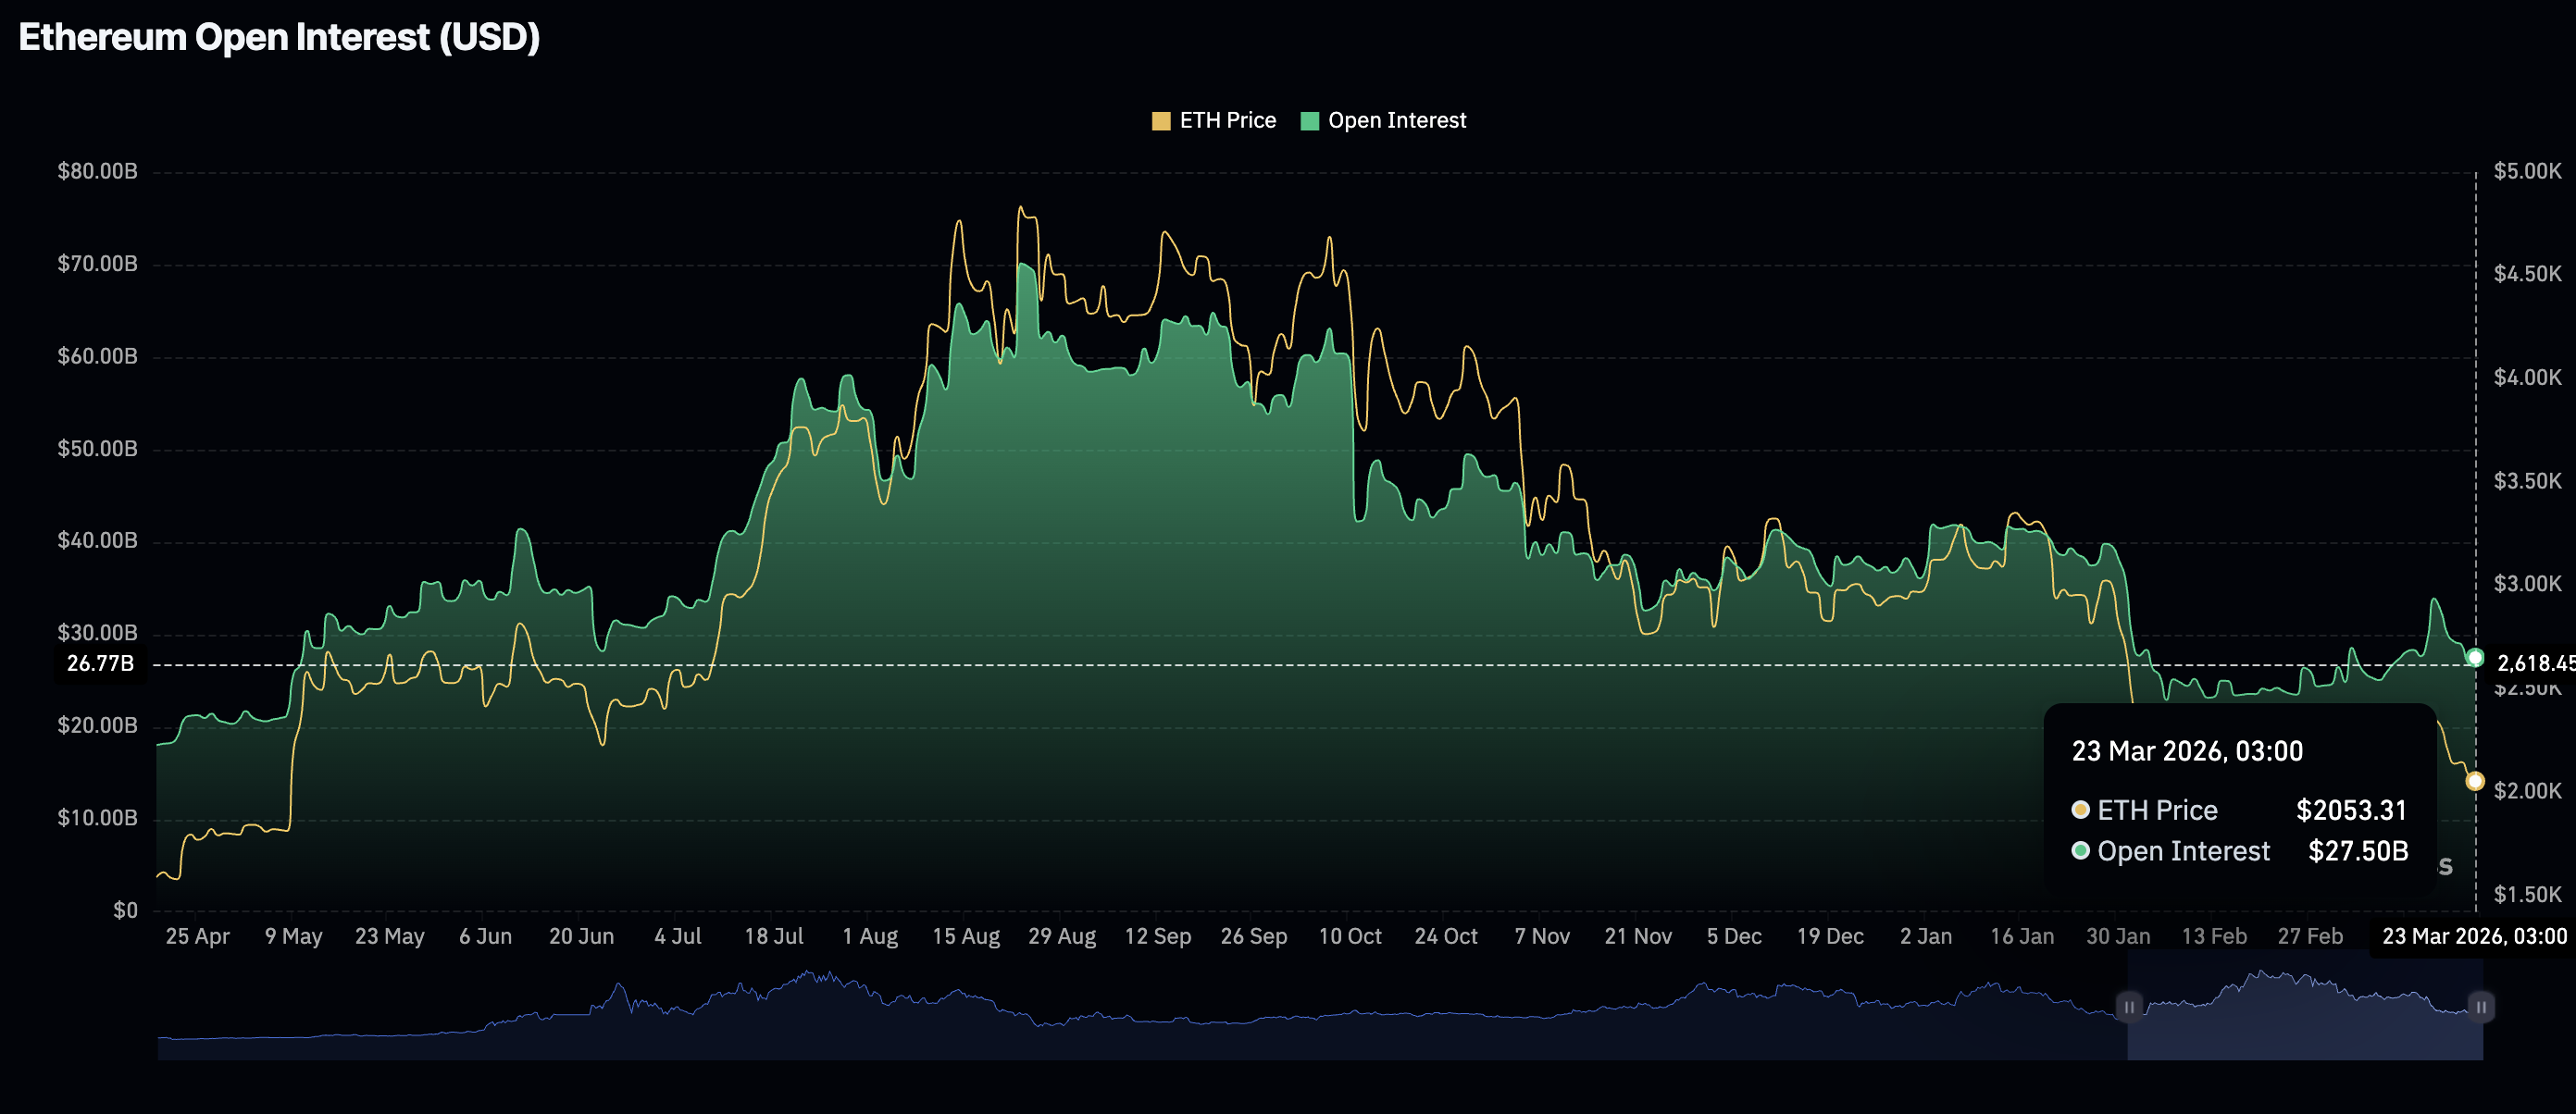
- Ethereum remains in the lower $2,000, weighed down by low retail activity, with futures Open Interest averaging $27.5 billion.
- XRP extends its decline from its March peak of $1.61, trading above $1.37 on Monday.
The cryptocurrency market remains under pressure, with Bitcoin (BTC) trading in the lower $68,000s at the time of writing on Monday, after correcting from its March peak of around $76,000.
Altcoins, including Ethereum (ETH) and Ripple (XRP), are struggling to attract retail interest amid war-driven volatility and risk-off sentiment. Nonetheless, Ethereum holds support at $2,000, while XRP trades around $1.37.
Risk-off sentiment persists, weakening Bitcoin, Ethereum and XRP outlook
Pressure on global markets continues to mount as the United States (US)-Israel-Iran rages on despite US President Donald Trump's warning that Iranian power plants will be destroyed if the Strait of Hormuz is not opened. The oil chokepoint remains in place as countries worldwide face shortages and prices hover near $100 per barrel.
In response, the Iranian regime has warned that it will launch direct attacks on Israel’s power plants and water desalination plants serving Gulf countries, according to a Reuters report. The impact on stocks and Oil prices could be long-lasting. The International Monetary Fund (IMF) also warned that sustained high Oil and energy prices could fuel global inflation and slow economic growth.
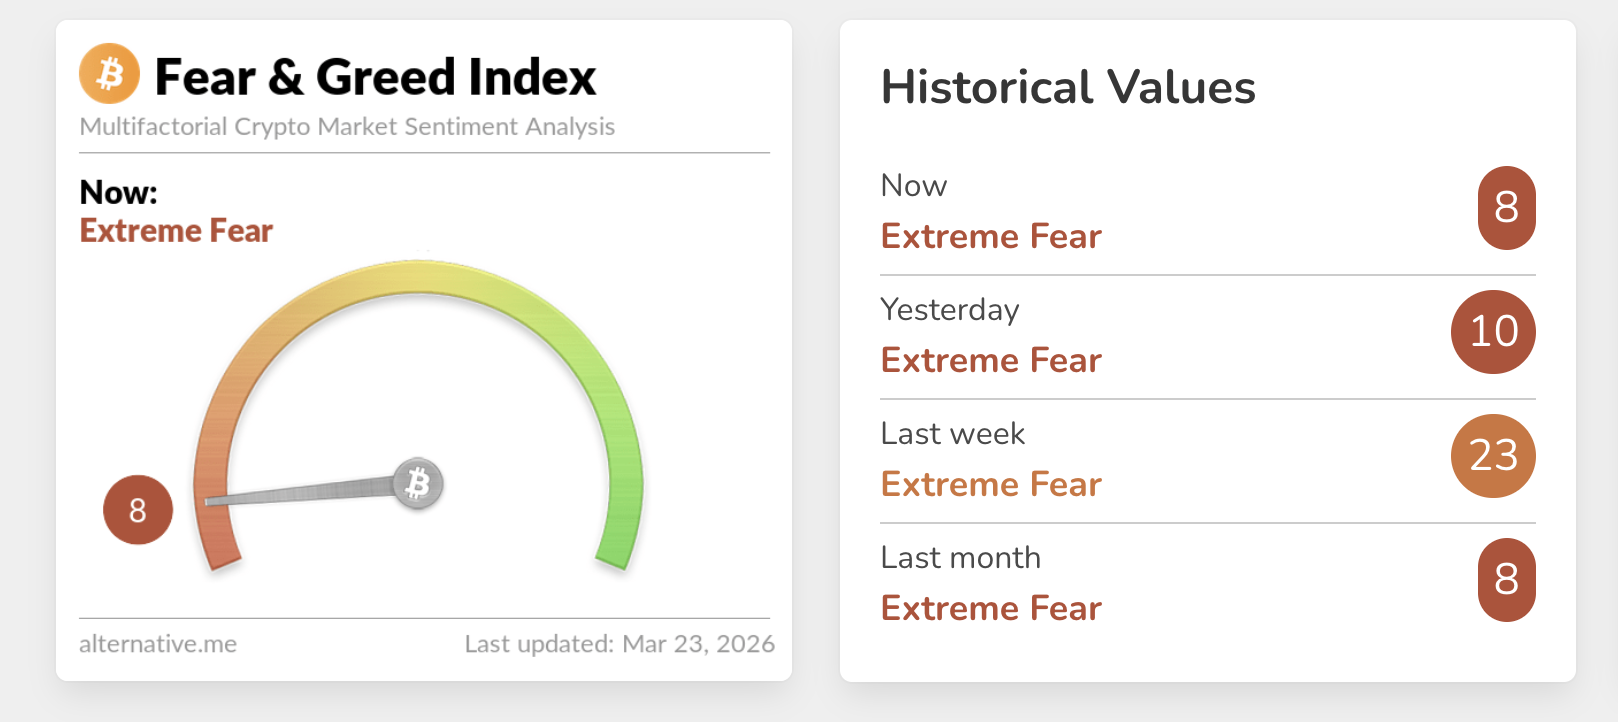
Meanwhile, interest in crypto assets remains on the back foot, as observed in the Fear & Greed Index, which fell to 8 (extreme fear) on Monday from 10 the previous day and from last week’s 23 level.
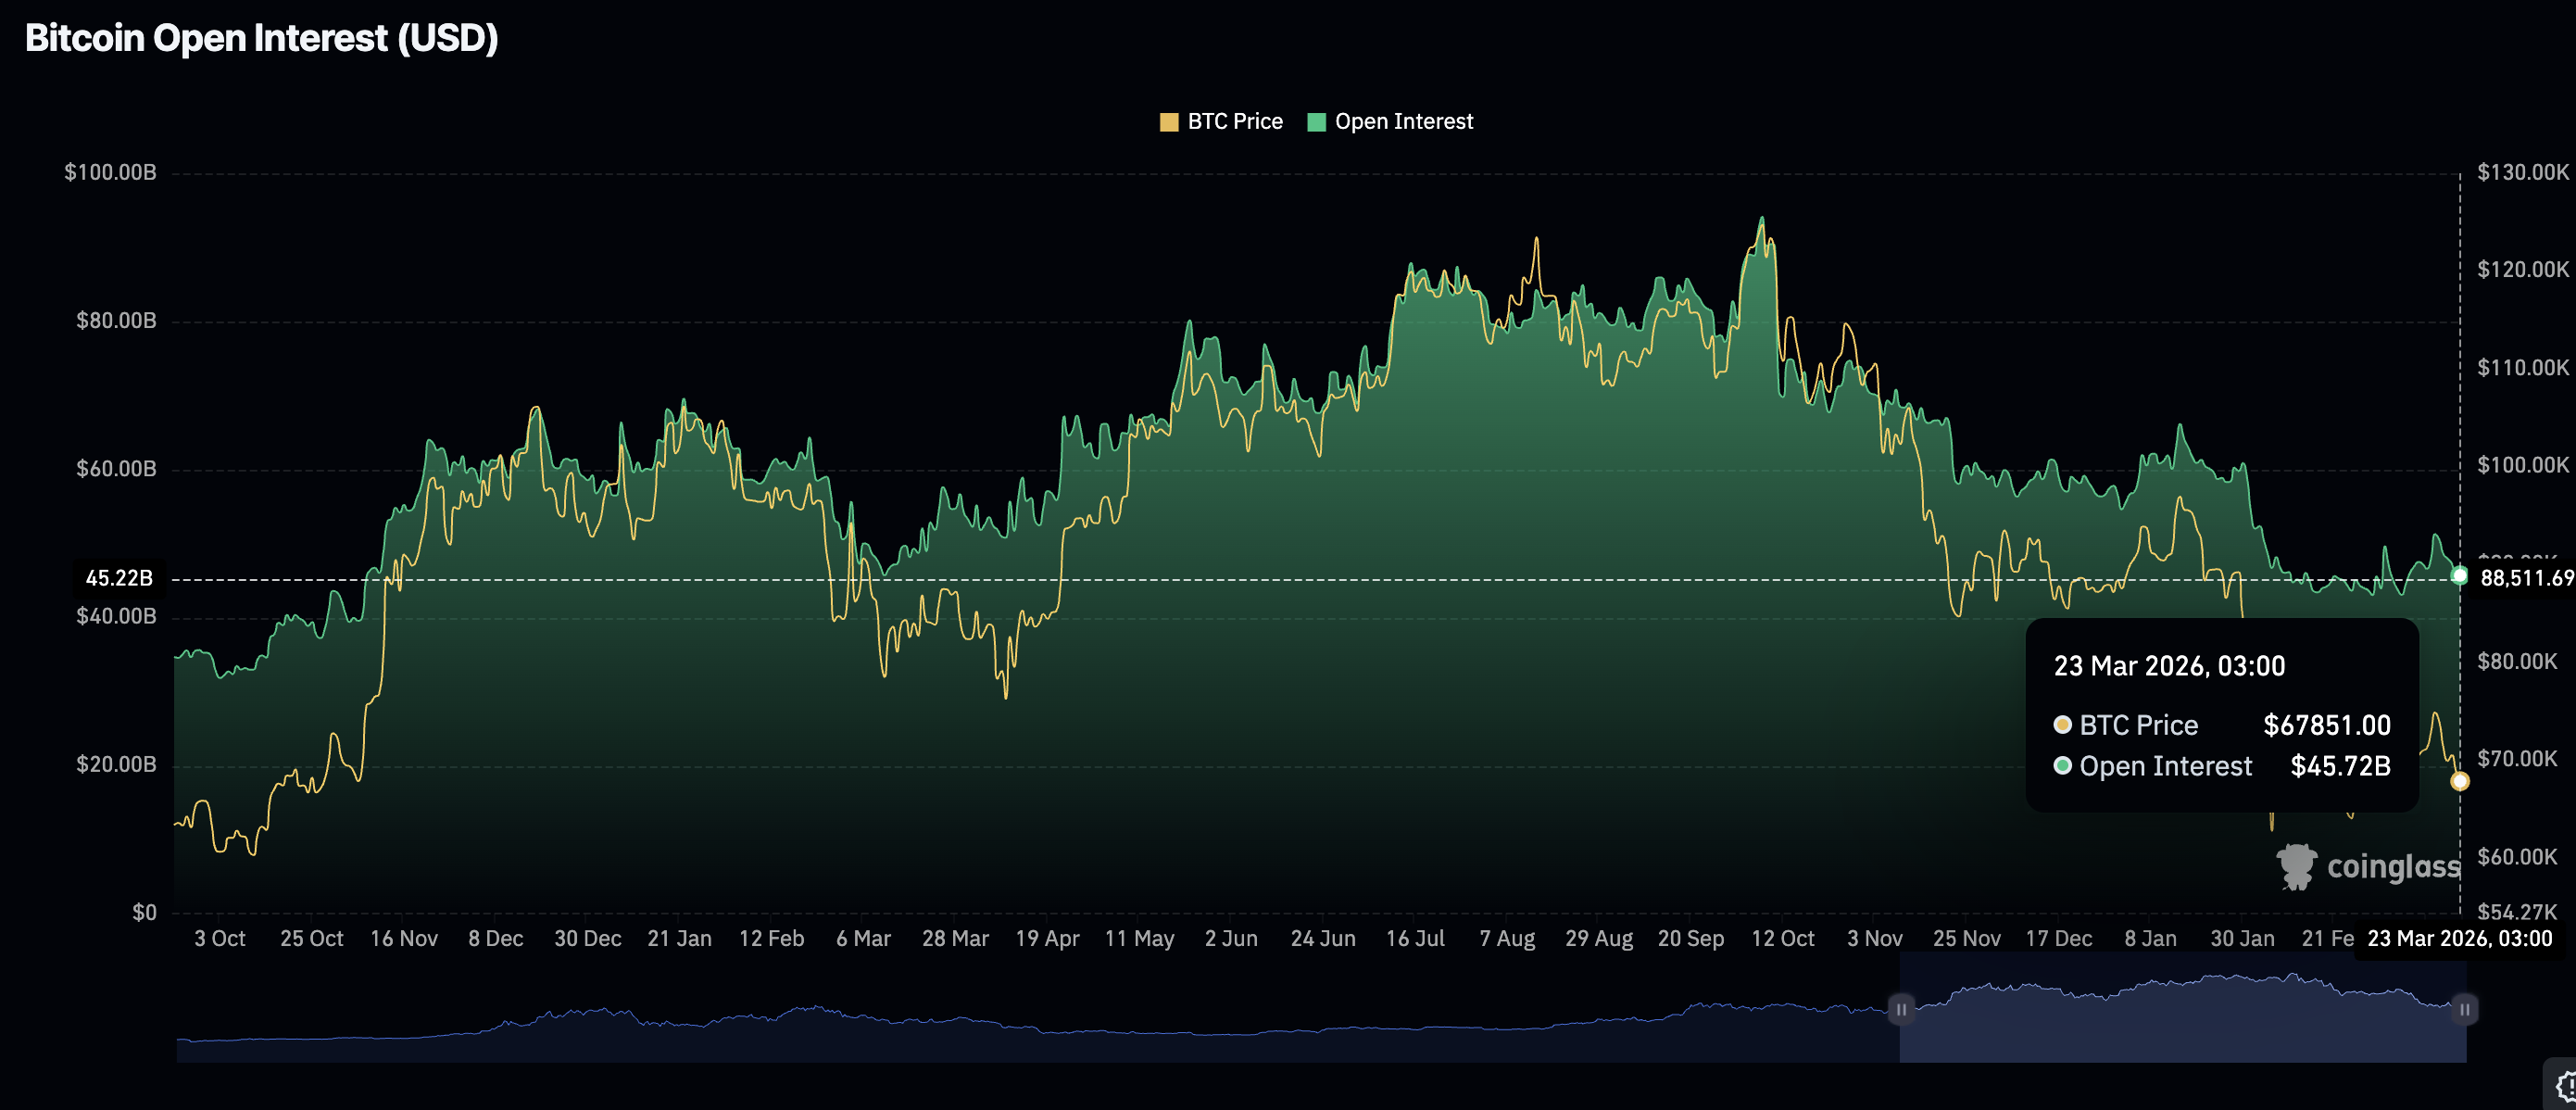
The notional value of outstanding futures contracts is shrinking, as reflected by Bitcoin’s Open Interest (OI) falling to $45.73 billion on Monday, from last week’s peak of $51.29 billion.
A persistent decline in futures OI suggests traders are not convinced BTC can sustain the uptrend. Therefore, they reduce exposure and are unwilling to open new positions. This outlook mirrors weak sentiment with the Fear & Greed Index currently sinking into extreme fear territory.
Ethereum similarly faces a weak derivatives market, as futures OI dropped to $27.5 billion from last week’s $33.89 peak. If OI extends weakness, a steady recovery could remain a pipe dream, leaving Ethereum at risk of falling below the pivotal $2,000 level.
Retail interest in XRP also weakened, as evidenced by futures OI dropping sharply to $2.33 billion on Monday, down from $2.47 the previous day and last week’s top at $2.87 billion. The XRP derivatives market has persistently weakened since the OI record high of $10.94 billion in July.
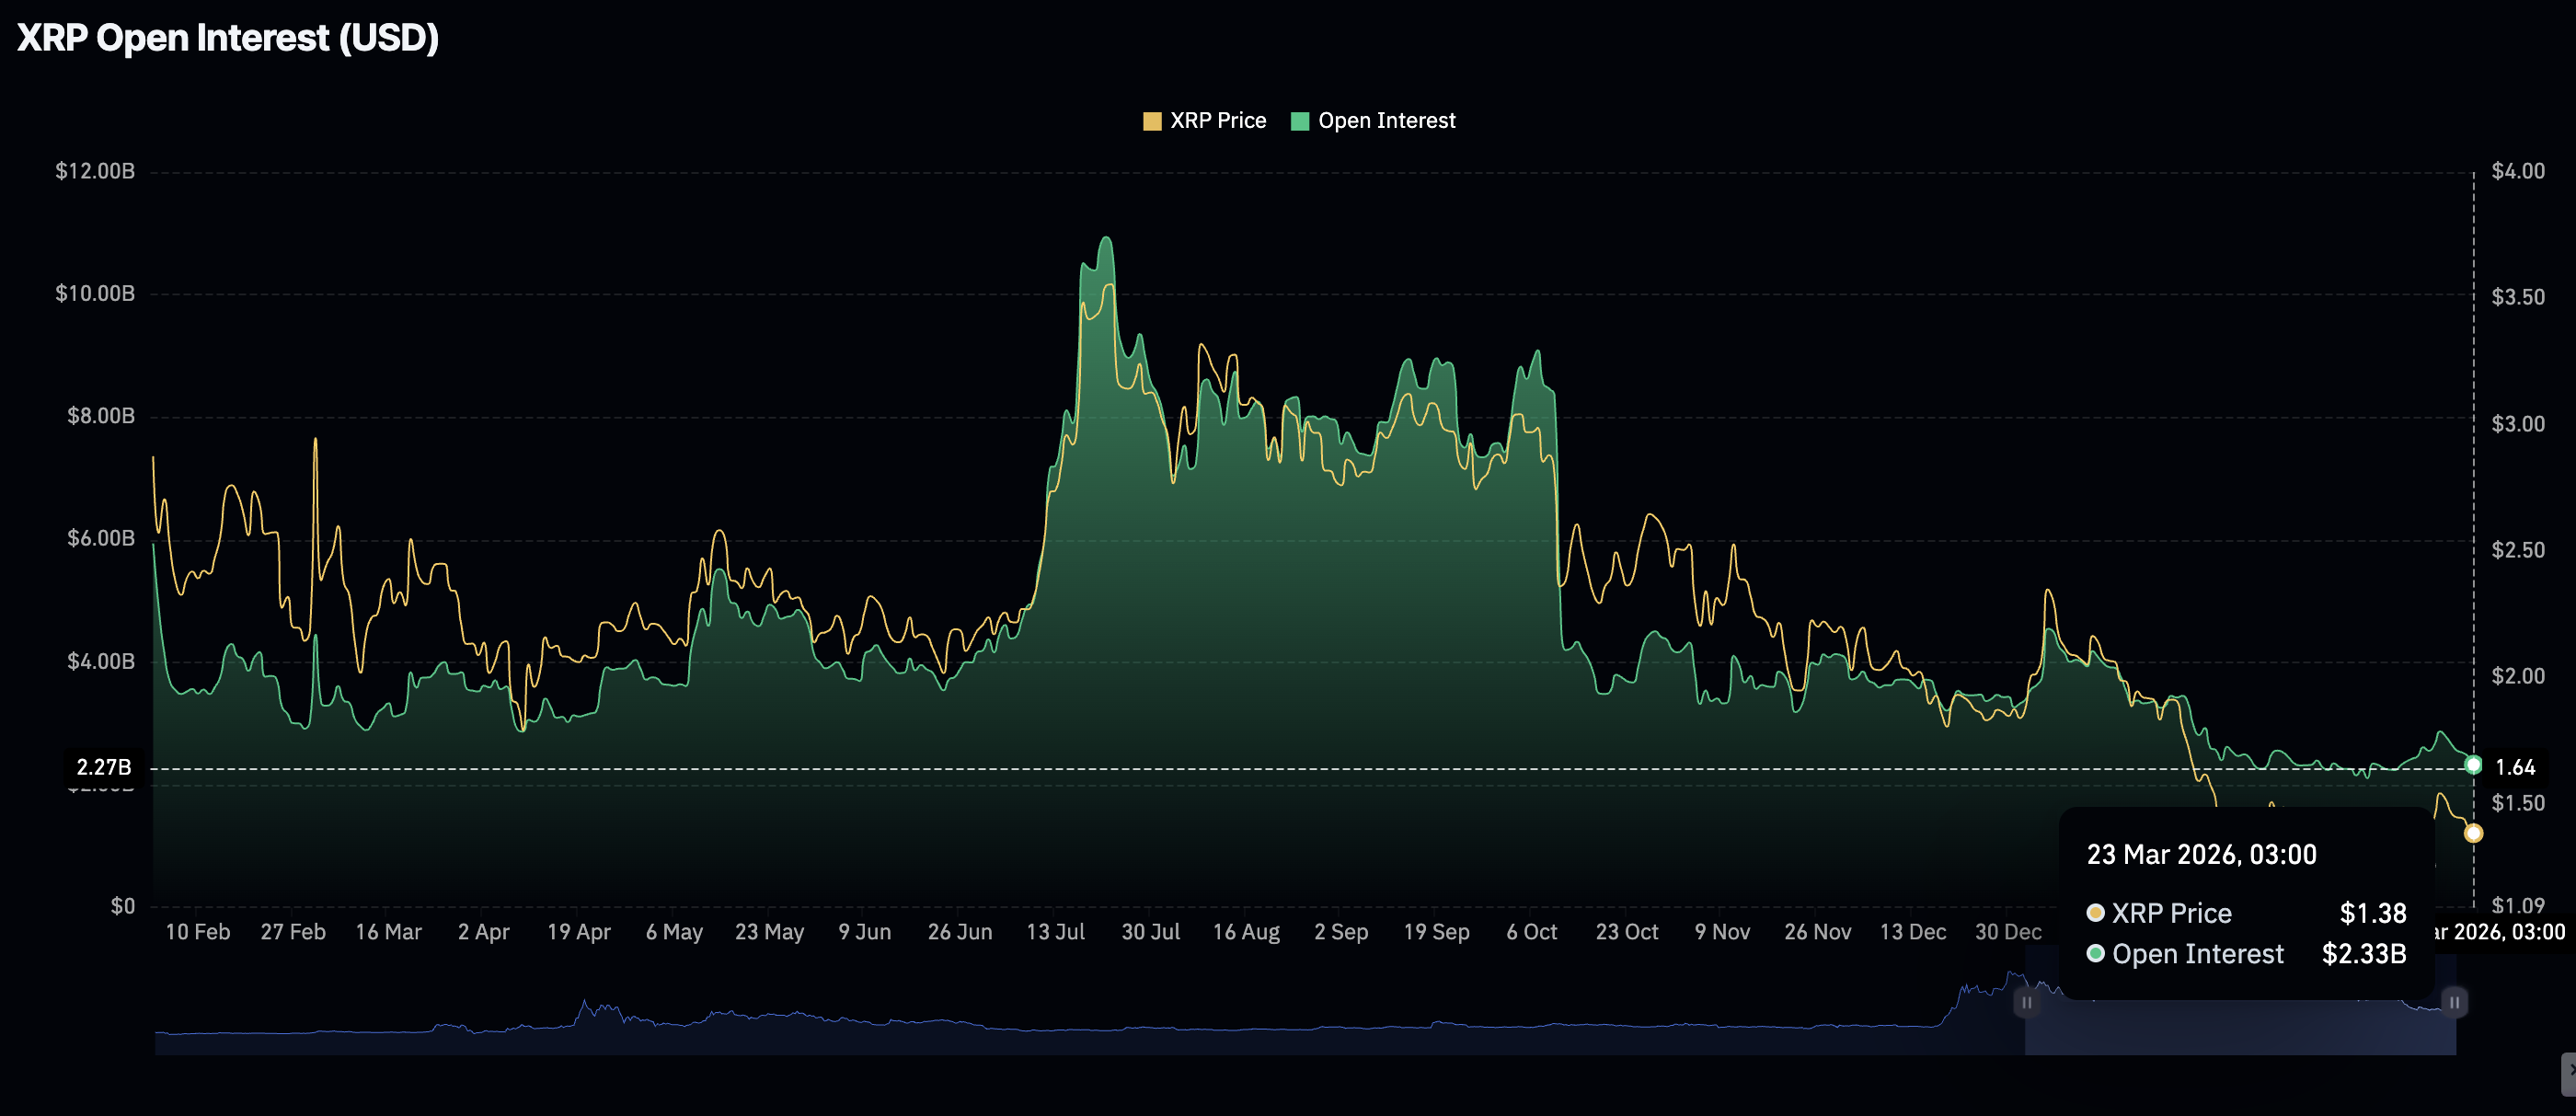
Chart of the day: Bitcoin holds $68,000 as support
Bitcoin is trading above $68,500, with a neutral near-term bias and a technical downside tilt. The price holds well below the clustered 50-day, 100-day, and 200-day Exponential Moving Averages (EMAs), which all sit above $72,000 and frame an entrenched higher-timeframe downtrend.
The Moving Average Convergence Divergence (MACD) indicator is below its signal line on the daily chart and has slipped into negative territory, suggesting renewed bearish momentum after last week's push that touched $76,000.
Immediate resistance emerges at $69,900, followed by the 50-day EMA at $72,182 and then the $74,465 area. A daily close above the 50-day EMA would be needed to reopen the upside toward $76,000.
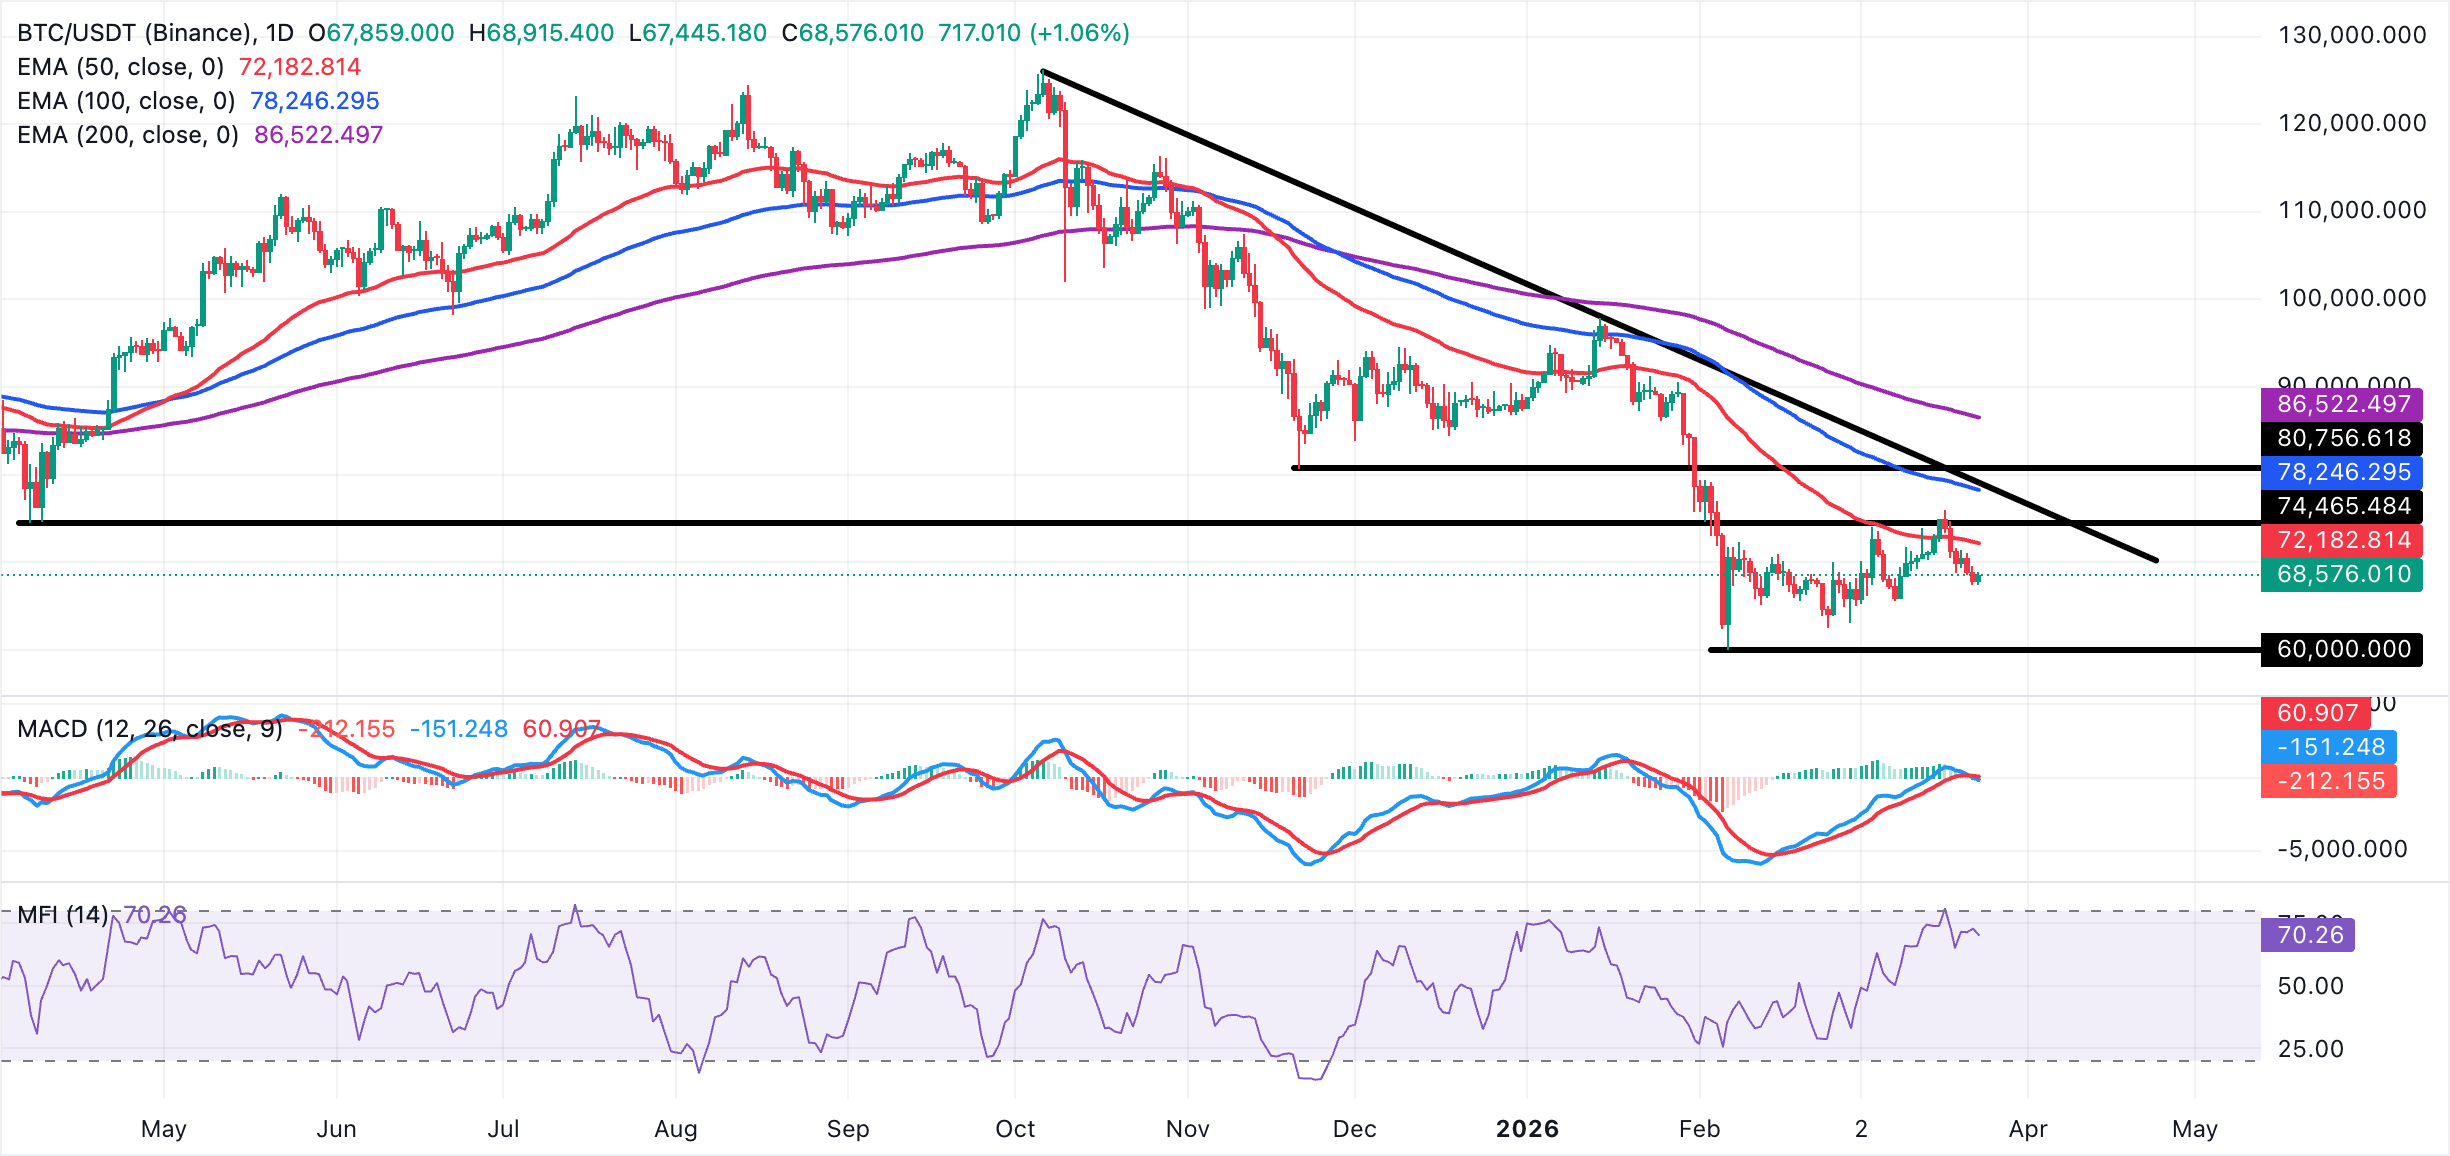
On the downside, initial support is seen at $67,900, ahead of $65,900, both of which align with recent swing lows. A break below $65,900 would expose deeper retracement toward the $64,700–$64,100 band, where the early-month lows sit, and a failure there would confirm a stronger bearish extension.
Altcoins technical outlook: Ethereum and XRP hold key support
Ethereum is trading near support at $2,000 but holds well below the descending resistance trend line that has capped recovery attempts from the $4,700 area, and it remains entrenched under the 50-day, 100-day, and 200-day EMAs.
Momentum has since faded from last week's rejection at $2,386, with the MACD indicator on the daily chart slipping below its signal line. The Money Flow Index (MFI) on the same chart has retreated from overbought territory, suggesting waning buying pressure after the recent rebound.
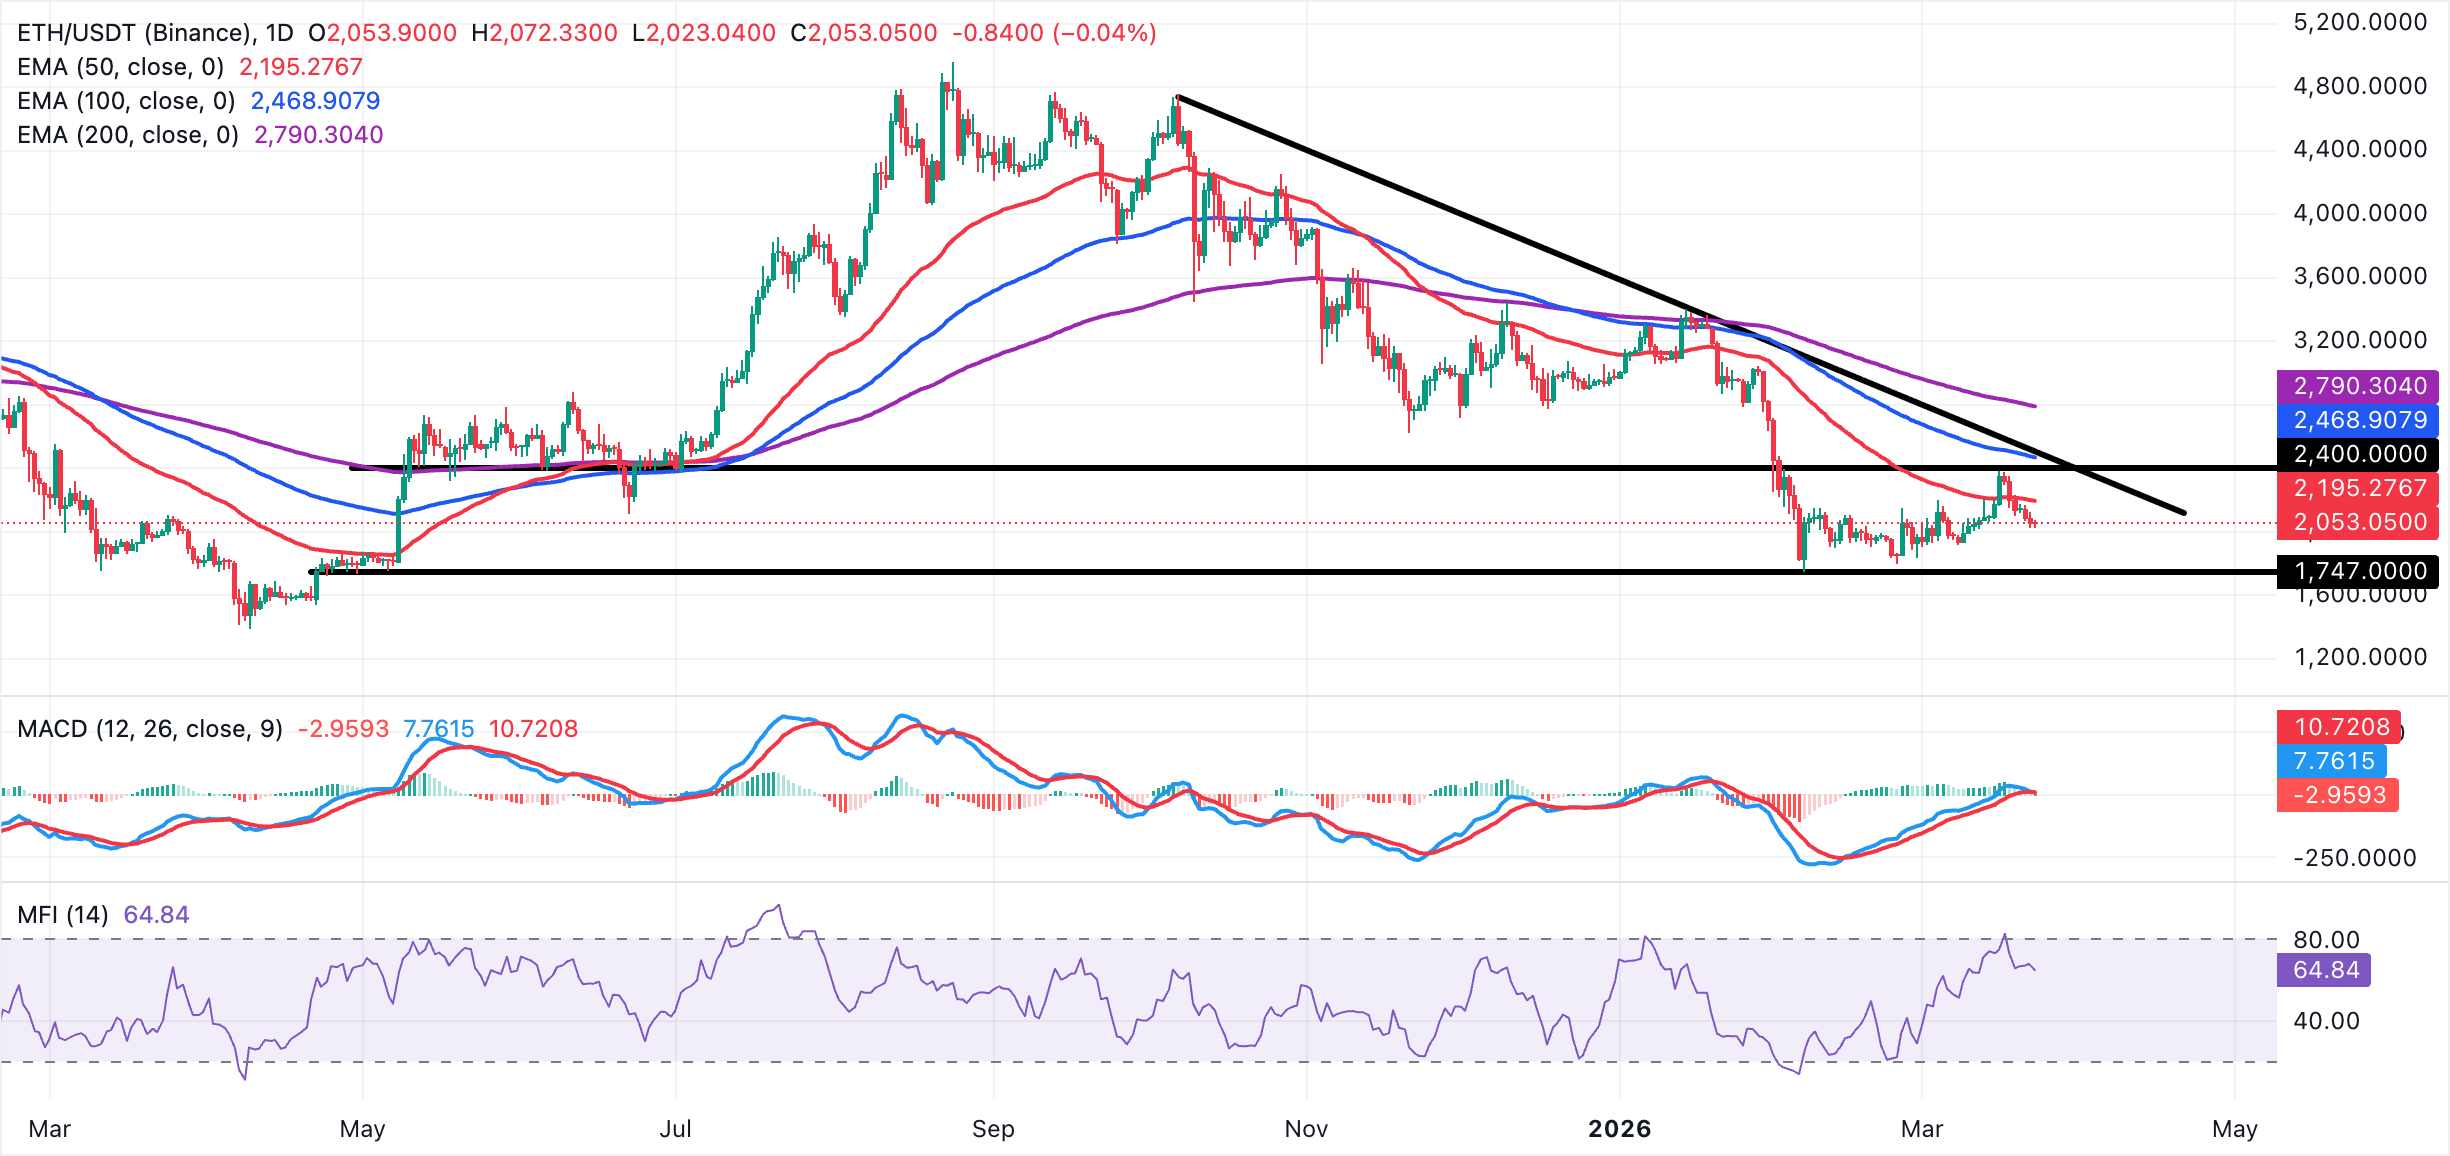
Initial resistance emerges around $2,150, where recent highs align with the underside of the short-term moving average cluster, followed by the $2,386 zone, which marked the latest rejection within the broader descending trend structure. On the downside, immediate support is seen near $2,000, protecting the recent swing lows around $1,930. A clear break below $1,930 would expose the next bearish target toward $1,850.
As for XRP, the near-term bias is mildly bearish as price continues to hover well below the descending trendline. The remittance token is trading under the 50-day, 100-day, and 200-day EMAs, which all slope downward and cap the upside. The MACD indicator has slipped below its signal line on the daily chart, while the MFI retreats from overbought territory above 80 toward the low-50s. Together, these indicators suggest fading upside momentum and a market vulnerable to further corrective pressure.
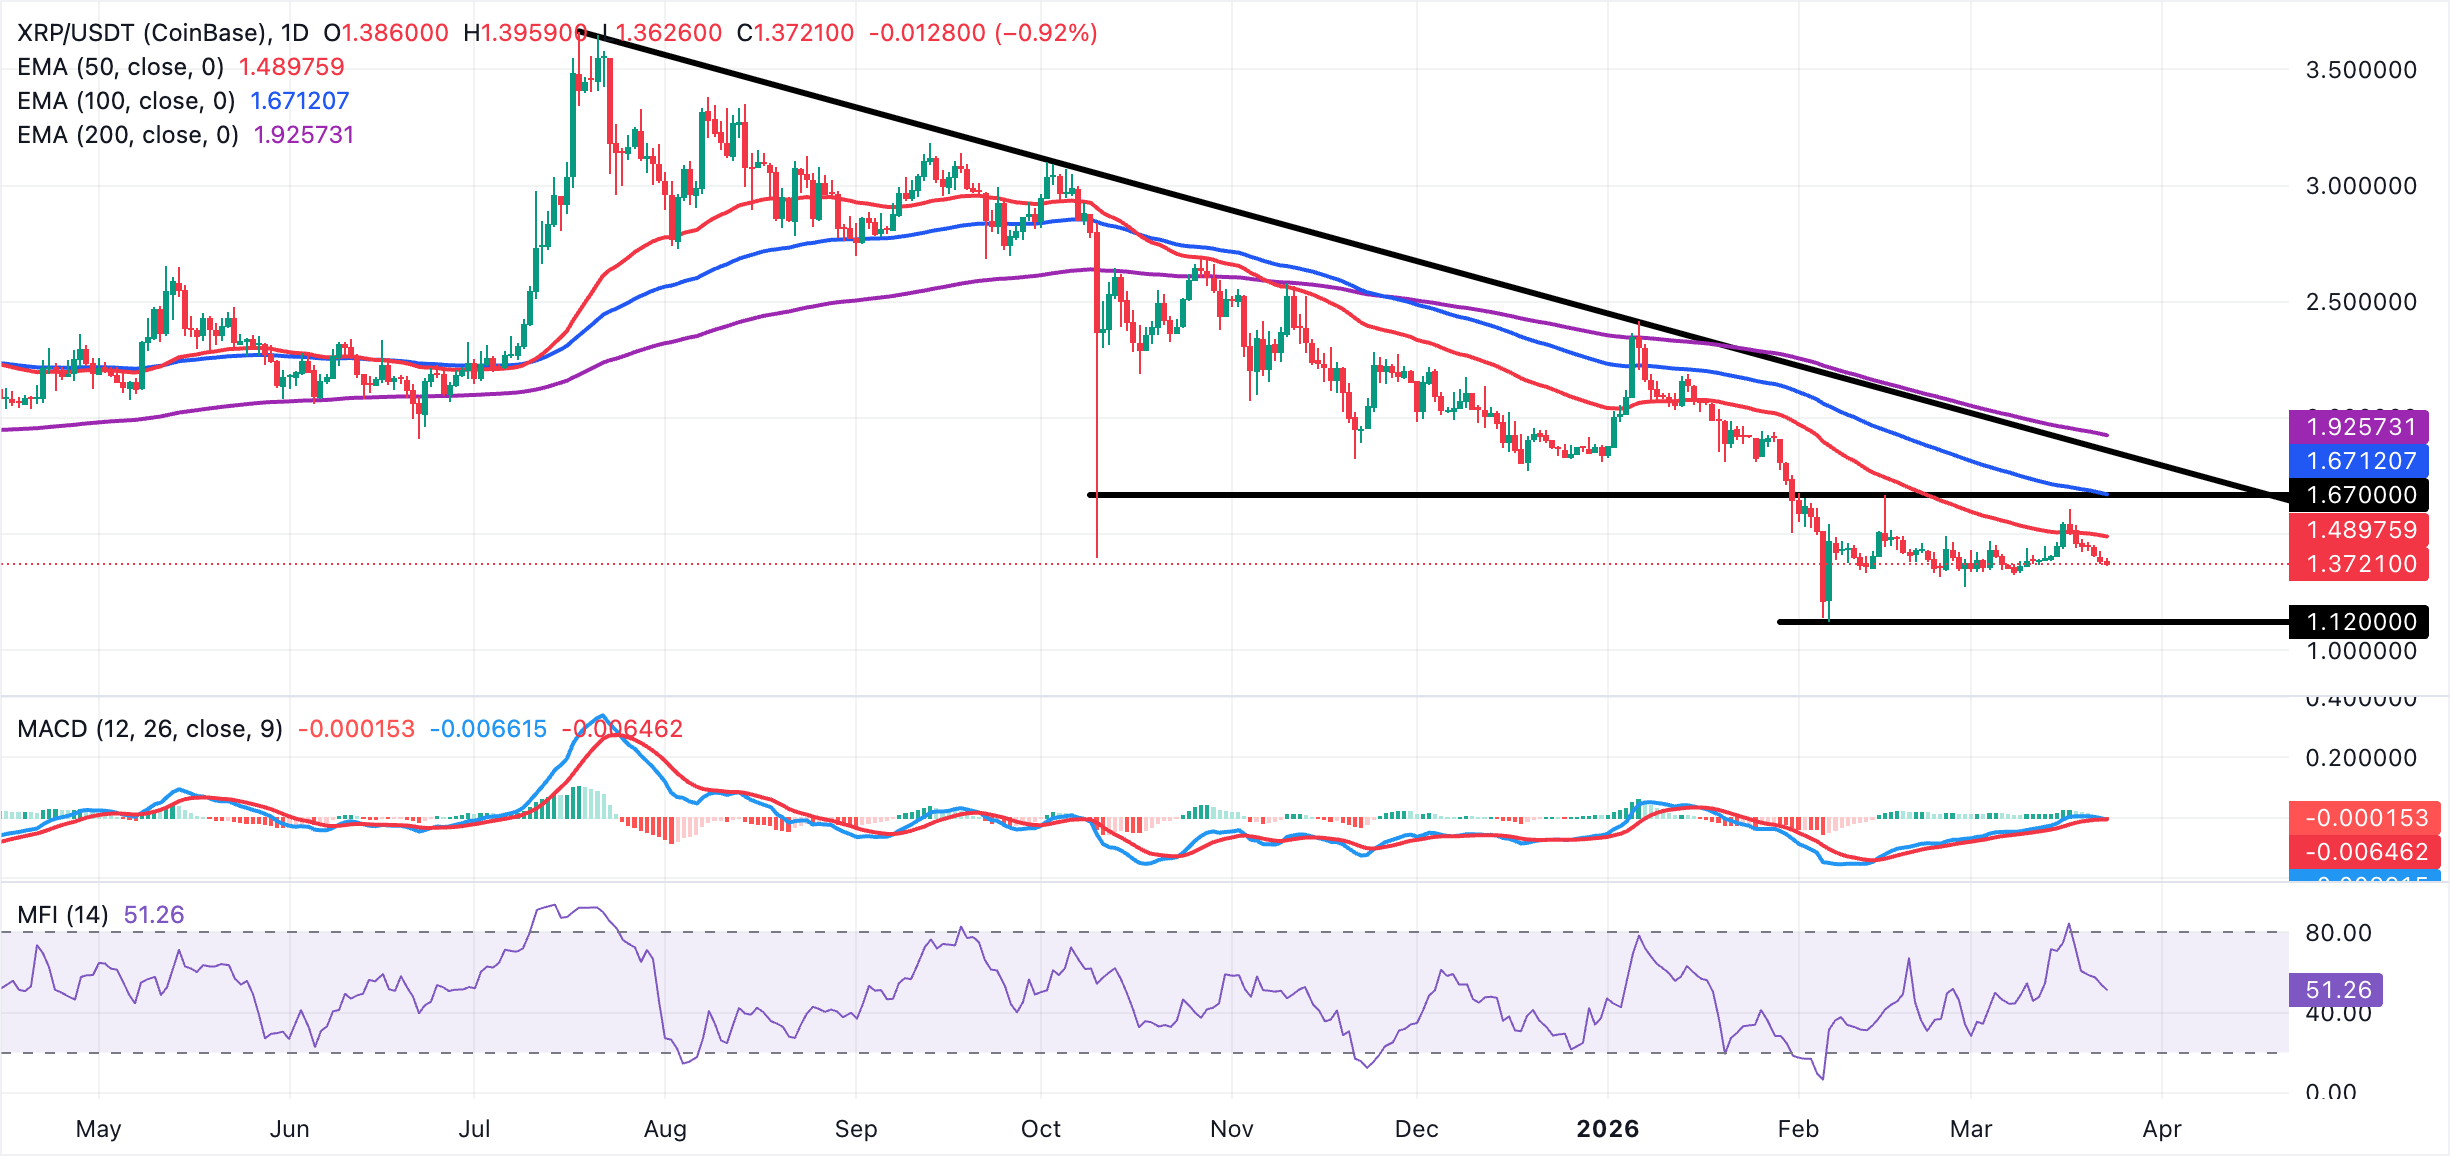
Initial resistance emerges around $1.40, where recent swing highs cluster, followed by the $1.45 and $1.54 areas, which highlight robust supply and lie closer to the descending trend-line projection. A daily close above $1.54 would be needed to challenge the bearish structure and expose the 100-day EMA at $1.67. An extended correction below the daily low at $1.36 may expose XRP to the lower but critical demand area of $1.30.
Open Interest, funding rate FAQs
Higher Open Interest is associated with higher liquidity and new capital inflow to the market. This is considered the equivalent of increase in efficiency and the ongoing trend continues. When Open Interest decreases, it is considered a sign of liquidation in the market, investors are leaving and the overall demand for an asset is on a decline, fueling a bearish sentiment among investors.
Funding fees bridge the difference between spot prices and prices of futures contracts of an asset by increasing liquidation risks faced by traders. A consistently high and positive funding rate implies there is a bullish sentiment among market participants and there is an expectation of a price hike. A consistently negative funding rate for an asset implies a bearish sentiment, indicating that traders expect the cryptocurrency’s price to fall and a bearish trend reversal is likely to occur.
(The technical analysis of this story was written with the help of an AI tool.)
Recommended Articles


