


Silver Price Forecast: Sideways below $60 as RSI bounce eyes breakout
- Silver remains trapped within $55.70-$60.00 range for fifth day.
- RSI turns higher but stays bearish, hinting at corrective bounce.
- Break above $60 exposes 200-day SMA and $70 resistance.
Silver price extended its gains for the second consecutive day, up by over 1.25%, yet it remains below the $60.00 figure, consolidated near the year’s low.
XAG/USD Price Forecast: Technical outlook
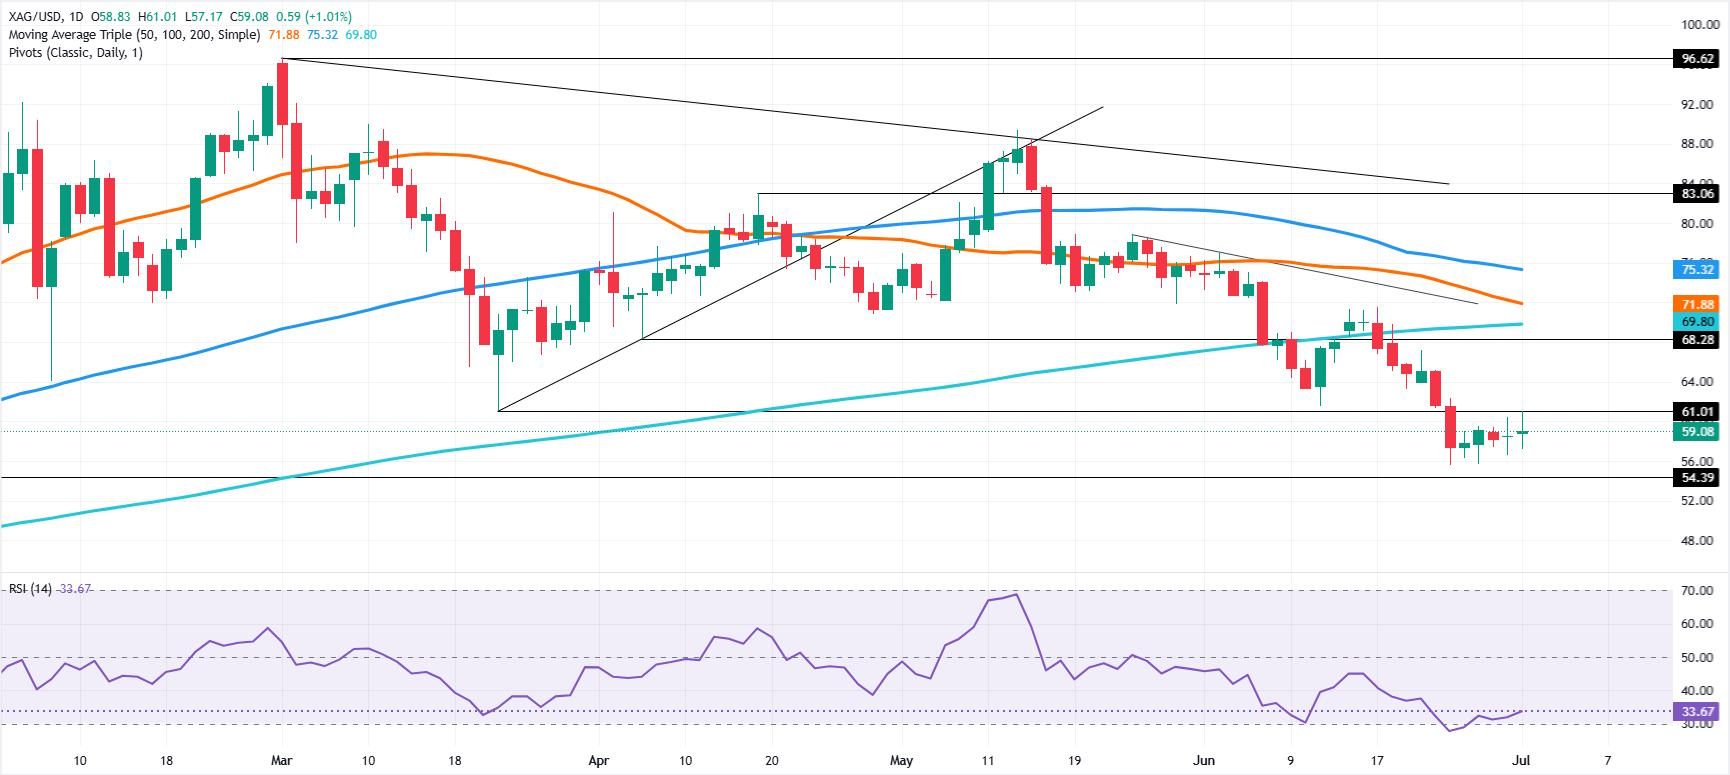
Price action shows Silver trading within the $55.70-$60.00 range for the last five straight days, poised for further sideways trading. Momentum, as measured by the Relative Strength Index (RSI), is bearish despite aiming upwards. This suggests that the white metal could be set for a bounce to challenge the top of the trading range.
If XAG/USD rises above $60.00, it clears the path to test the next higher high at $71.56, the June 17 daily peak. On further strength, buyers can test the 200-day Simple Moving Average (SMA) at $69.80. Overhead lies the $70.00 milestone.
On the flip side, if Silver tumbles below the year-to-date (YTD) low of $55.70, the next support would be the November 25, 2025, daily high-turned-support at $54.39, ahead of the psychological $50.00 mark.
XAG/USD Price Chart – Daily
Silver FAQs
Silver is a precious metal highly traded among investors. It has been historically used as a store of value and a medium of exchange. Although less popular than Gold, traders may turn to Silver to diversify their investment portfolio, for its intrinsic value or as a potential hedge during high-inflation periods. Investors can buy physical Silver, in coins or in bars, or trade it through vehicles such as Exchange Traded Funds, which track its price on international markets.
Silver prices can move due to a wide range of factors. Geopolitical instability or fears of a deep recession can make Silver price escalate due to its safe-haven status, although to a lesser extent than Gold's. As a yieldless asset, Silver tends to rise with lower interest rates. Its moves also depend on how the US Dollar (USD) behaves as the asset is priced in dollars (XAG/USD). A strong Dollar tends to keep the price of Silver at bay, whereas a weaker Dollar is likely to propel prices up. Other factors such as investment demand, mining supply – Silver is much more abundant than Gold – and recycling rates can also affect prices.
Silver is widely used in industry, particularly in sectors such as electronics or solar energy, as it has one of the highest electric conductivity of all metals – more than Copper and Gold. A surge in demand can increase prices, while a decline tends to lower them. Dynamics in the US, Chinese and Indian economies can also contribute to price swings: for the US and particularly China, their big industrial sectors use Silver in various processes; in India, consumers’ demand for the precious metal for jewellery also plays a key role in setting prices.
Silver prices tend to follow Gold's moves. When Gold prices rise, Silver typically follows suit, as their status as safe-haven assets is similar. The Gold/Silver ratio, which shows the number of ounces of Silver needed to equal the value of one ounce of Gold, may help to determine the relative valuation between both metals. Some investors may consider a high ratio as an indicator that Silver is undervalued, or Gold is overvalued. On the contrary, a low ratio might suggest that Gold is undervalued relative to Silver.
Recommended Articles


