


USD/JPY Price Forecast: Pair stalls below 156.00 as momentum fades
- USD/JPY holds a narrow range as traders await key US data and the BoJ interest rate decision.
- The 21-day SMA on the daily chart near 156.00 acts as immediate resistance.
- Immediate support is seen in the 154.20-154.00 zone, reinforced by the 50-day SMA.
The Japanese Yen (JPY) trades on the front foot against the US Dollar (USD) on Monday, supported by firm expectations that the Bank of Japan (BoJ) will raise interest rates at its December 19 monetary policy meeting. However, the Yen’s upside lacks strong follow-through, as the Greenback finds some support ahead of a heavy US economic data lineup due on Tuesday.
At the time of writing, USD/JPY trades near 155.37, down 0.33%, after rebounding modestly from an intraday low of 154.84.
In the United States (US), key releases include the delayed October and November Nonfarm Payrolls (NFP) reports, Retail Sales, ADP Employment Change four-week average, and the preliminary S&P Global Purchasing Managers Index (PMI) surveys. In Japan, attention will be on the preliminary Jibun Bank Manufacturing and Services PMI surveys.
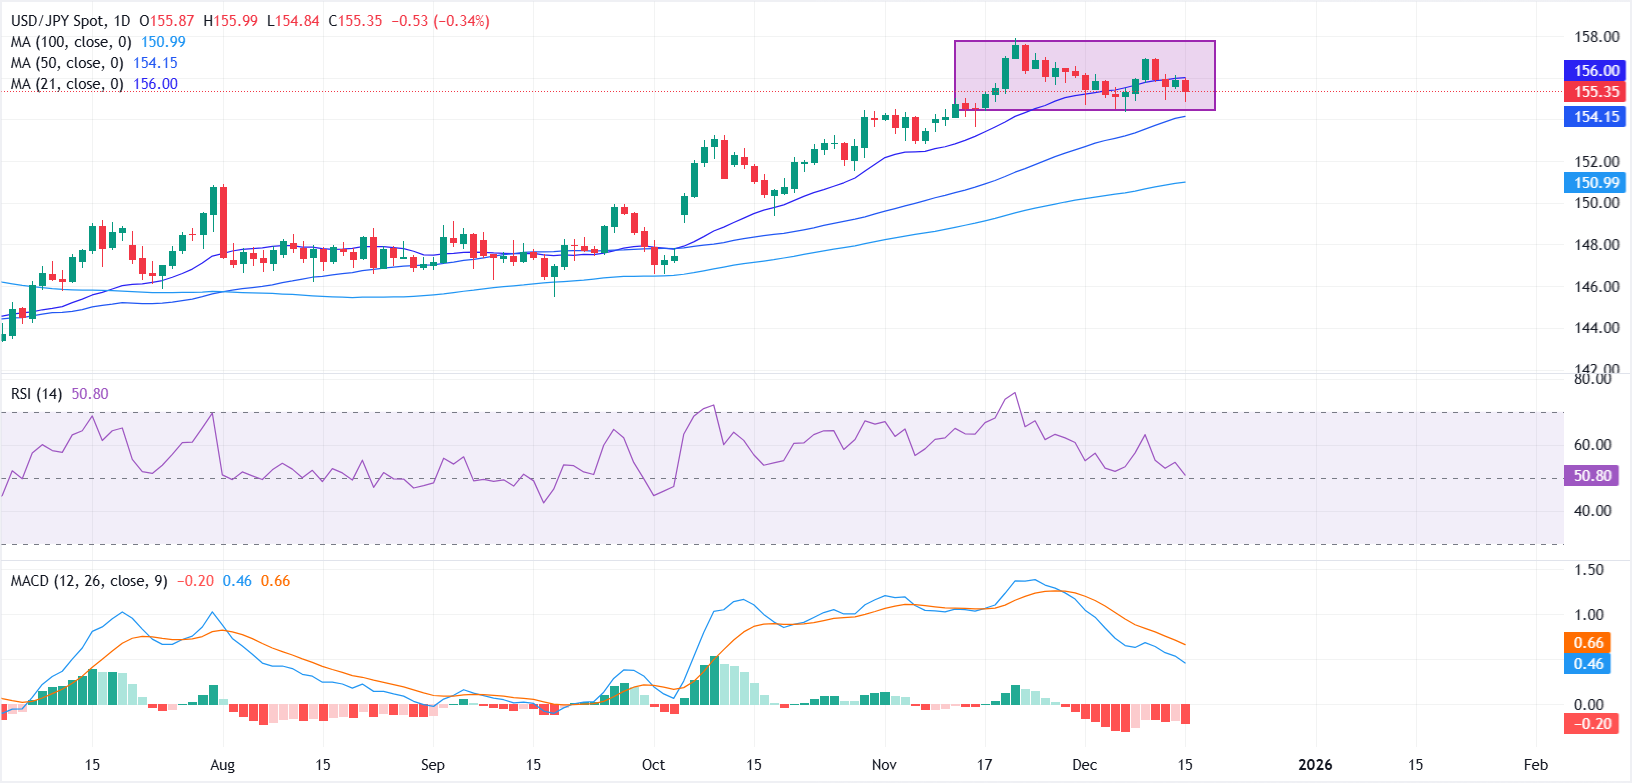
From a technical perspective, USD/JPY remains in a consolidation phase after facing rejection near the 158.00 level on November 20. The pair is currently hovering just below the 21-day Simple Moving Average (SMA) near 156.00, which is acting as immediate resistance and capping upside attempts. A sustained move above this level would be needed to revive bullish momentum and expose the 157.00-158.00 zone.
On the downside, initial support is seen in the 154.20-154.00 area, reinforced by the 50-day Simple Moving Average (SMA). A decisive break below this support zone could shift the near-term bias to the downside and open the door toward the 153.00 psychological level, followed by the 100-day SMA near 151.00.
Momentum indicators reflect a loss of bullish traction. The Relative Strength Index (RSI) has eased back toward the 50 level, while the Moving Average Convergence Divergence (MACD) remains below the Signal line and under zero, with a widening negative histogram that suggests fading upside momentum.
Japanese Yen FAQs
The Japanese Yen (JPY) is one of the world’s most traded currencies. Its value is broadly determined by the performance of the Japanese economy, but more specifically by the Bank of Japan’s policy, the differential between Japanese and US bond yields, or risk sentiment among traders, among other factors.
One of the Bank of Japan’s mandates is currency control, so its moves are key for the Yen. The BoJ has directly intervened in currency markets sometimes, generally to lower the value of the Yen, although it refrains from doing it often due to political concerns of its main trading partners. The BoJ ultra-loose monetary policy between 2013 and 2024 caused the Yen to depreciate against its main currency peers due to an increasing policy divergence between the Bank of Japan and other main central banks. More recently, the gradually unwinding of this ultra-loose policy has given some support to the Yen.
Over the last decade, the BoJ’s stance of sticking to ultra-loose monetary policy has led to a widening policy divergence with other central banks, particularly with the US Federal Reserve. This supported a widening of the differential between the 10-year US and Japanese bonds, which favored the US Dollar against the Japanese Yen. The BoJ decision in 2024 to gradually abandon the ultra-loose policy, coupled with interest-rate cuts in other major central banks, is narrowing this differential.
The Japanese Yen is often seen as a safe-haven investment. This means that in times of market stress, investors are more likely to put their money in the Japanese currency due to its supposed reliability and stability. Turbulent times are likely to strengthen the Yen’s value against other currencies seen as more risky to invest in.
Recommended Articles


