


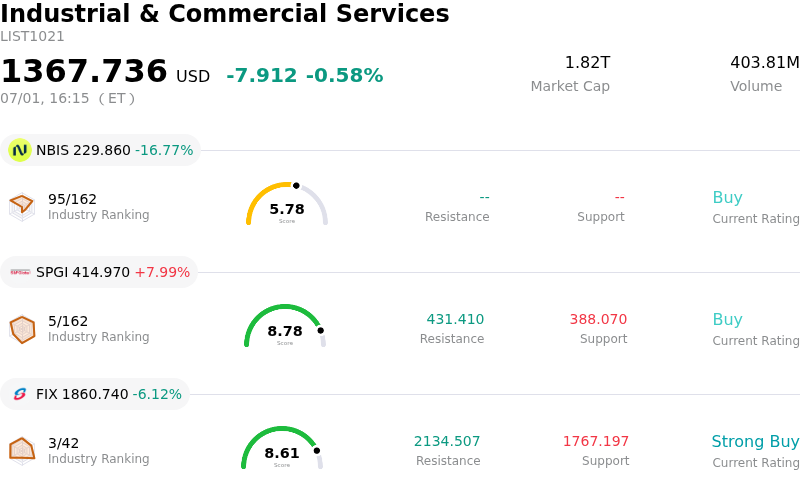
S&P Global Inc Stock (SPGI) Closed Up by 7.99% on Jul 1: What Signal Does It Send?
S&P Global Inc (SPGI) closed up by 7.99%. The Industrial & Commercial Services sector is down by 0.58%. The company outperformed the industry. Top 3 stocks by turnover in the sector: Nebius Group NV (NBIS) down 16.77%; S&P Global Inc (SPGI) up 7.99%; Comfort Systems USA Inc (FIX) down 6.12%.
What is driving S&P Global Inc (SPGI)’s stock price up today?
The primary catalyst behind S&P Global's significant upward move is the successful completion of the spinoff of its Mobility division. After fifteen months of planning and execution, S&P Global finalized the distribution of its automotive and transportation data segment into an independent, publicly traded entity named Mobility Global Inc., which officially began trading on the New York Stock Exchange. Under the terms of the transaction, S&P Global stockholders received one share of the newly formed company for every share of S&P Global they held as of the mid-June record date.
The completion of this transaction has been highly anticipated by the market as a significant corporate restructuring milestone. Historically, corporate spinoffs of this nature unlock substantial shareholder value by allowing both parent and child companies to focus exclusively on their core operations, optimize their capital allocation strategies, and pursue distinct growth pathways. For S&P Global, the separation streamlines its core competencies in ratings, indices, and market intelligence, making the company a cleaner, higher-margin play on financial data and global debt markets.
Simultaneously, institutional sentiment has turned decidedly constructive following the completion of the transaction. Analysts note that S&P Global was trading near its 52-week lows prior to the corporate action, dragged down by macroeconomic concerns regarding elevated interest rates and potential AI-related disruption to its subscription businesses. However, the current valuation, trading at multiple standard deviations below its five-year median price-to-earnings ratio, presented a compelling valuation mismatch and a margin of safety for long-term investors.
This post-spinoff valuation reset has spurred buying interest, particularly as fundamental tailwinds remain intact. Strong underlying demand persists in S&P Global's rating business, driven by a heavy volume of investment-grade debt issuance and bond sales from technology firms seeking to fund artificial intelligence capital expenditures. Combined with the board’s recent commitment to capital return policies, including a stable third-quarter cash dividend, the structural separation has catalyzed a sharp upward re-rating as investors digest a highly focused, capital-efficient market leader.
Technical Analysis of S&P Global Inc (SPGI)
Technically, S&P Global Inc (SPGI) shows a MACD (12,26,9) value of -4.757, indicating a sell signal. The RSI at 36.111 suggests neutral condition and the Williams %R at 92.052 suggests oversold condition. Please monitor closely.
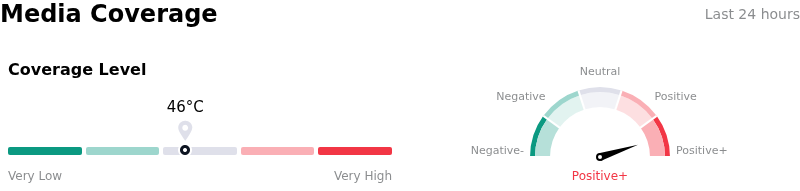
Media Coverage of S&P Global Inc (SPGI)
In terms of media coverage, S&P Global Inc (SPGI) shows a coverage score of 46, indicating a moderate level of media attention. The overall market sentiment index is currently in extremely bullish zone.
Fundamental Analysis of S&P Global Inc (SPGI)
S&P Global Inc (SPGI) is in the Industrial & Commercial Services industry. Its latest annual revenue is $15.34B, ranking 8 in the industry. The net profit is $4.47B, ranking 2 in the industry. Company Profile
Over the past month, multiple analysts have rated the company as Buy, with an average price target of $0.00, a high of $0.00, and a low of $0.00.
More details about S&P Global Inc (SPGI)
Company Specific Risks:
- Target Price Downgrades: On July 1, 2026, S&P Global experienced significant negative analyst sentiment as equities researchers at The Goldman Sachs Group slashed the stock's price target from $539.00 to $490.00, amplifying downward pressure on the stock.
- Valuation Compression and Peer Pressure: Despite a recent minor technical rebound, S&P Global remains down roughly 20.3% year-to-date. Near-term valuation models suggest the stock faces ongoing pressure, with key investment narratives identifying a fair value of $380, indicating the stock remains overvalued relative to peer ratios and growth expectations.
- Subdued Segment Performance and Soft Guidance: Immediate volatility is tied to underlying segment weaknesses, specifically a slowdown in transaction revenue growth within the crucial Credit Ratings division, lower-than-expected Market Intelligence margins, and a weaker-than-anticipated full-year adjusted EPS forecast.
- AI Disruption Concerns: Market intelligence and analytics products are facing a prolonged threat of AI-driven disruption, causing structural software and services sector anxiety that continues to damp institutional sentiment and limit margin recovery.
Recommended Articles


