


Mondelez International Inc Stock (MDLZ) Moved Up by 5.52% on Apr 29: Drivers Behind the Movement
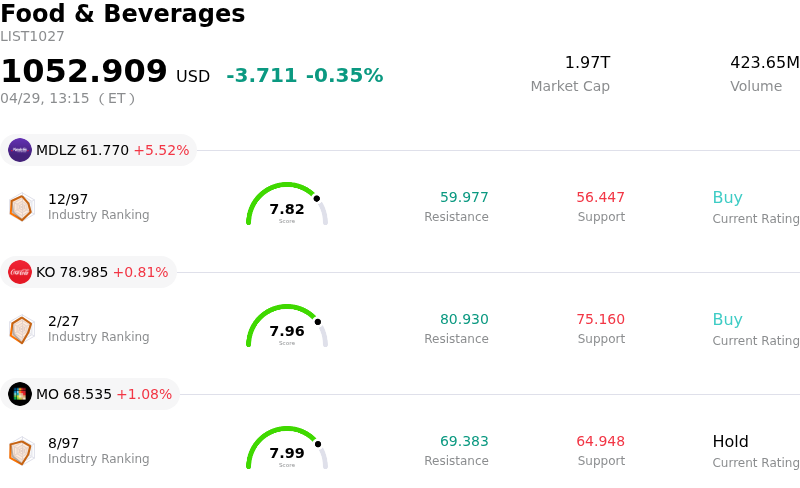
Mondelez International Inc (MDLZ) moved up by 5.52%. The Food & Beverages sector is down by 0.35%. The company outperformed the industry. Top 3 stocks by turnover in the sector: Mondelez International Inc (MDLZ) up 5.52%; Coca-Cola Co (KO) up 0.81%; Altria Group Inc (MO) up 1.08%.
What is driving Mondelez International Inc (MDLZ)’s stock price up today?
Mondelēz International's stock experienced significant upward movement today, primarily driven by strong first-quarter 2026 financial results that surpassed analyst expectations. The company reported net revenues that exceeded projections, alongside adjusted earnings per share that also came in higher than consensus estimates. This robust performance provided a positive catalyst for investor sentiment.
A key factor contributing to the better-than-expected revenue was strong growth in emerging markets, with double-digit increases observed in regions such as Latin America and Asia, Middle East & Africa. Management highlighted the effectiveness of its consumer-centric strategy and increased investments in brands and growth platforms, which helped drive these results despite ongoing macroeconomic volatility.
Following the earnings release, several prominent analyst firms upgraded their price targets for Mondelēz International and reiterated positive ratings. These adjustments by analysts from institutions like Barclays, TD Cowen, BofA, Bernstein, and Evercore ISI Group signaled confidence in the company's future prospects and further fueled the stock's appreciation. The company also reaffirmed its full-year 2026 guidance for both organic net revenue growth and adjusted earnings per share, providing stability and clarity for investors.
While the reported adjusted earnings per share saw a decline on a constant currency basis, primarily due to higher input costs and an unfavorable volume/mix, the overall strong top-line beat and consistent outlook outweighed these concerns for many investors. The company acknowledged potential headwinds from geopolitical events, such as the Middle East crisis, which could impact supply chain costs and consumer confidence, particularly in the United States. However, the ability to deliver strong first-quarter results and maintain full-year guidance in such an environment was viewed favorably.
Technical Analysis of Mondelez International Inc (MDLZ)
Technically, Mondelez International Inc (MDLZ) shows a MACD (12,26,9) value of [-0.15], indicating a neutral signal. The RSI at 55.80 suggests neutral condition and the Williams %R at -22.10 suggests oversold condition. Please monitor closely.
Fundamental Analysis of Mondelez International Inc (MDLZ)
Mondelez International Inc (MDLZ) is in the Food & Beverages industry. Its latest annual revenue is $38.54B, ranking 6 in the industry. The net profit is $2.45B, ranking 4 in the industry. Company Profile
Over the past month, multiple analysts have rated the company as Buy, with an average price target of $66.00, a high of $73.00, and a low of $55.00.
More details about Mondelez International Inc (MDLZ)
Company Specific Risks:
- Adjusted Earnings Per Share (EPS) declined 14.9% year-over-year on a constant currency basis in Q1 2026, missing market expectations, largely due to operating declines and higher income taxes.
- Adjusted gross profit margin contracted by 270 basis points and adjusted operating income decreased by 19.0% on a constant currency basis in Q1 2026, primarily driven by elevated input costs and unfavorable volume/mix.
- Q1 2026 organic net revenue growth was primarily driven by a 3.5% increase in pricing, which was partially offset by a 0.5% decline in volume and mix, suggesting potential demand elasticity or competitive pressures impacting sales volume.
- Mondelez reaffirmed a conservative full-year 2026 outlook, projecting organic net revenue growth of flat to 2% and adjusted EPS growth of flat to 5% on a constant currency basis, which represents a deceleration from the company's long-term growth algorithm.
Recommended Articles


