


Lowe's Companies Inc Stock (LOW) Moved Down by 3.33% on Apr 29: What Signal Does It Send?
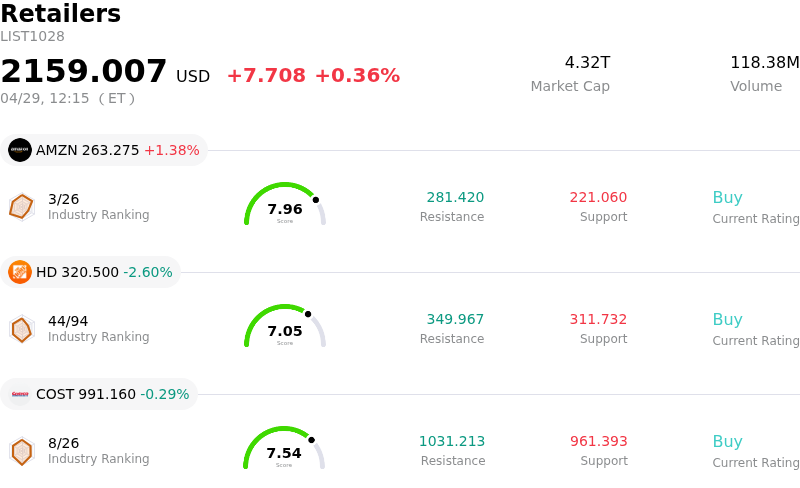
Lowe's Companies Inc (LOW) moved down by 3.33%. The Retailers sector is up by 0.36%. The company underperformed the industry. Top 3 stocks by turnover in the sector: Amazon.com Inc (AMZN) up 1.38%; Home Depot Inc (HD) down 2.60%; Costco Wholesale Corp (COST) down 0.29%.
What is driving Lowe's Companies Inc (LOW)’s stock price down today?
The stock movement for Lowe's (LOW) on April 29, 2026, reflecting a decline with notable intraday volatility, appears to be a continued reaction to the company's cautious financial outlook for the current fiscal year. Despite exceeding analyst estimates for its fourth-quarter earnings, the management's conservative guidance for full-year comparable sales and earnings per share fell short of market expectations, leading to an initial negative response from investors. This softer outlook indicates that Lowe's anticipates only modest improvement in underlying demand, rather than a significant rebound in the home improvement sector.
The broader macroeconomic environment is contributing to this sentiment. The U.S. home improvement sector is experiencing modest growth due to persistent affordability pressures, elevated mortgage rates, and low housing turnover, which are collectively dampening consumer confidence and limiting large, discretionary remodeling projects. Spending has notably shifted towards essential repairs and maintenance rather than substantial renovations. While recent U.S. retail sales data showed overall resilience in consumer spending, concerns linger regarding the impact of higher energy costs and broader economic uncertainty on discretionary purchases.
Adding to the pressure, there have been reports of significant institutional investors reducing their holdings in Lowe's. For instance, Mitsubishi UFJ Trust & Banking Corp and Vest Financial LLC both lowered their positions in the fourth quarter, signaling potential shifts in institutional sentiment. Furthermore, news of corporate and support staff layoffs at Lowe's, scheduled to conclude around this period, could also be interpreted by the market as a sign of underlying business challenges or proactive cost-cutting measures in a difficult operating landscape. Geopolitical risks, particularly the ongoing standoff in Iran, have also introduced a degree of market uncertainty, leading to mixed stock futures and volatile oil prices, which can influence overall investor caution.
Technical Analysis of Lowe's Companies Inc (LOW)
Technically, Lowe's Companies Inc (LOW) shows a MACD (12,26,9) value of [-0.12], indicating a neutral signal. The RSI at 45.24 suggests neutral condition and the Williams %R at -88.69 suggests oversold condition. Please monitor closely.
Fundamental Analysis of Lowe's Companies Inc (LOW)
Lowe's Companies Inc (LOW) is in the Retailers industry. Its latest annual revenue is $86.29B, ranking 2 in the industry. The net profit is $6.64B, ranking 2 in the industry. Company Profile
Over the past month, multiple analysts have rated the company as Buy, with an average price target of $284.42, a high of $320.00, and a low of $228.00.
More details about Lowe's Companies Inc (LOW)
Company Specific Risks:
- Lowe's has issued an underwhelming sales forecast for fiscal year 2026, projecting comparable sales to be flat to up 2%, which is below consensus estimates and attributed to a "pressured" housing market and weak DIY demand.
- The company anticipates muted adjusted diluted earnings per share (EPS) for FY2026, with forecasts falling short of projections, alongside persistent gross margin decline and expected muted operating margins for 2026.
- Intense competitive pressures from its primary rival, Home Depot, particularly in the lucrative Pro segment, and increasing threats from direct-to-consumer and e-commerce brands, could hinder market share gains and operational efficiency.
- Lowe's current leverage remains above its target, leading to a pause in share buybacks, which may indicate capital structure concerns or a strategic shift in capital allocation.
Recommended Articles


