


Gold’s Price Path Beyond $6,500 Runs Through The Oil Market — Here’s Why


Gold (XAU/USD) has pulled back over 7% from its all-time high near $5,590, but continues to trade above $5,160 — holding up significantly better than stock market plays and even Bitcoin in the month-on-month timeframe. The bullish channel that has guided the gold price since late December remains intact, and institutional positioning hasn’t budged.
Yet the big breakout toward new highs remains elusive. The reason isn’t gold’s structure or demand: it’s most likely crude oil. Here’s how everything connects.
Gold’s Bullish Channel Has Survived Every Test
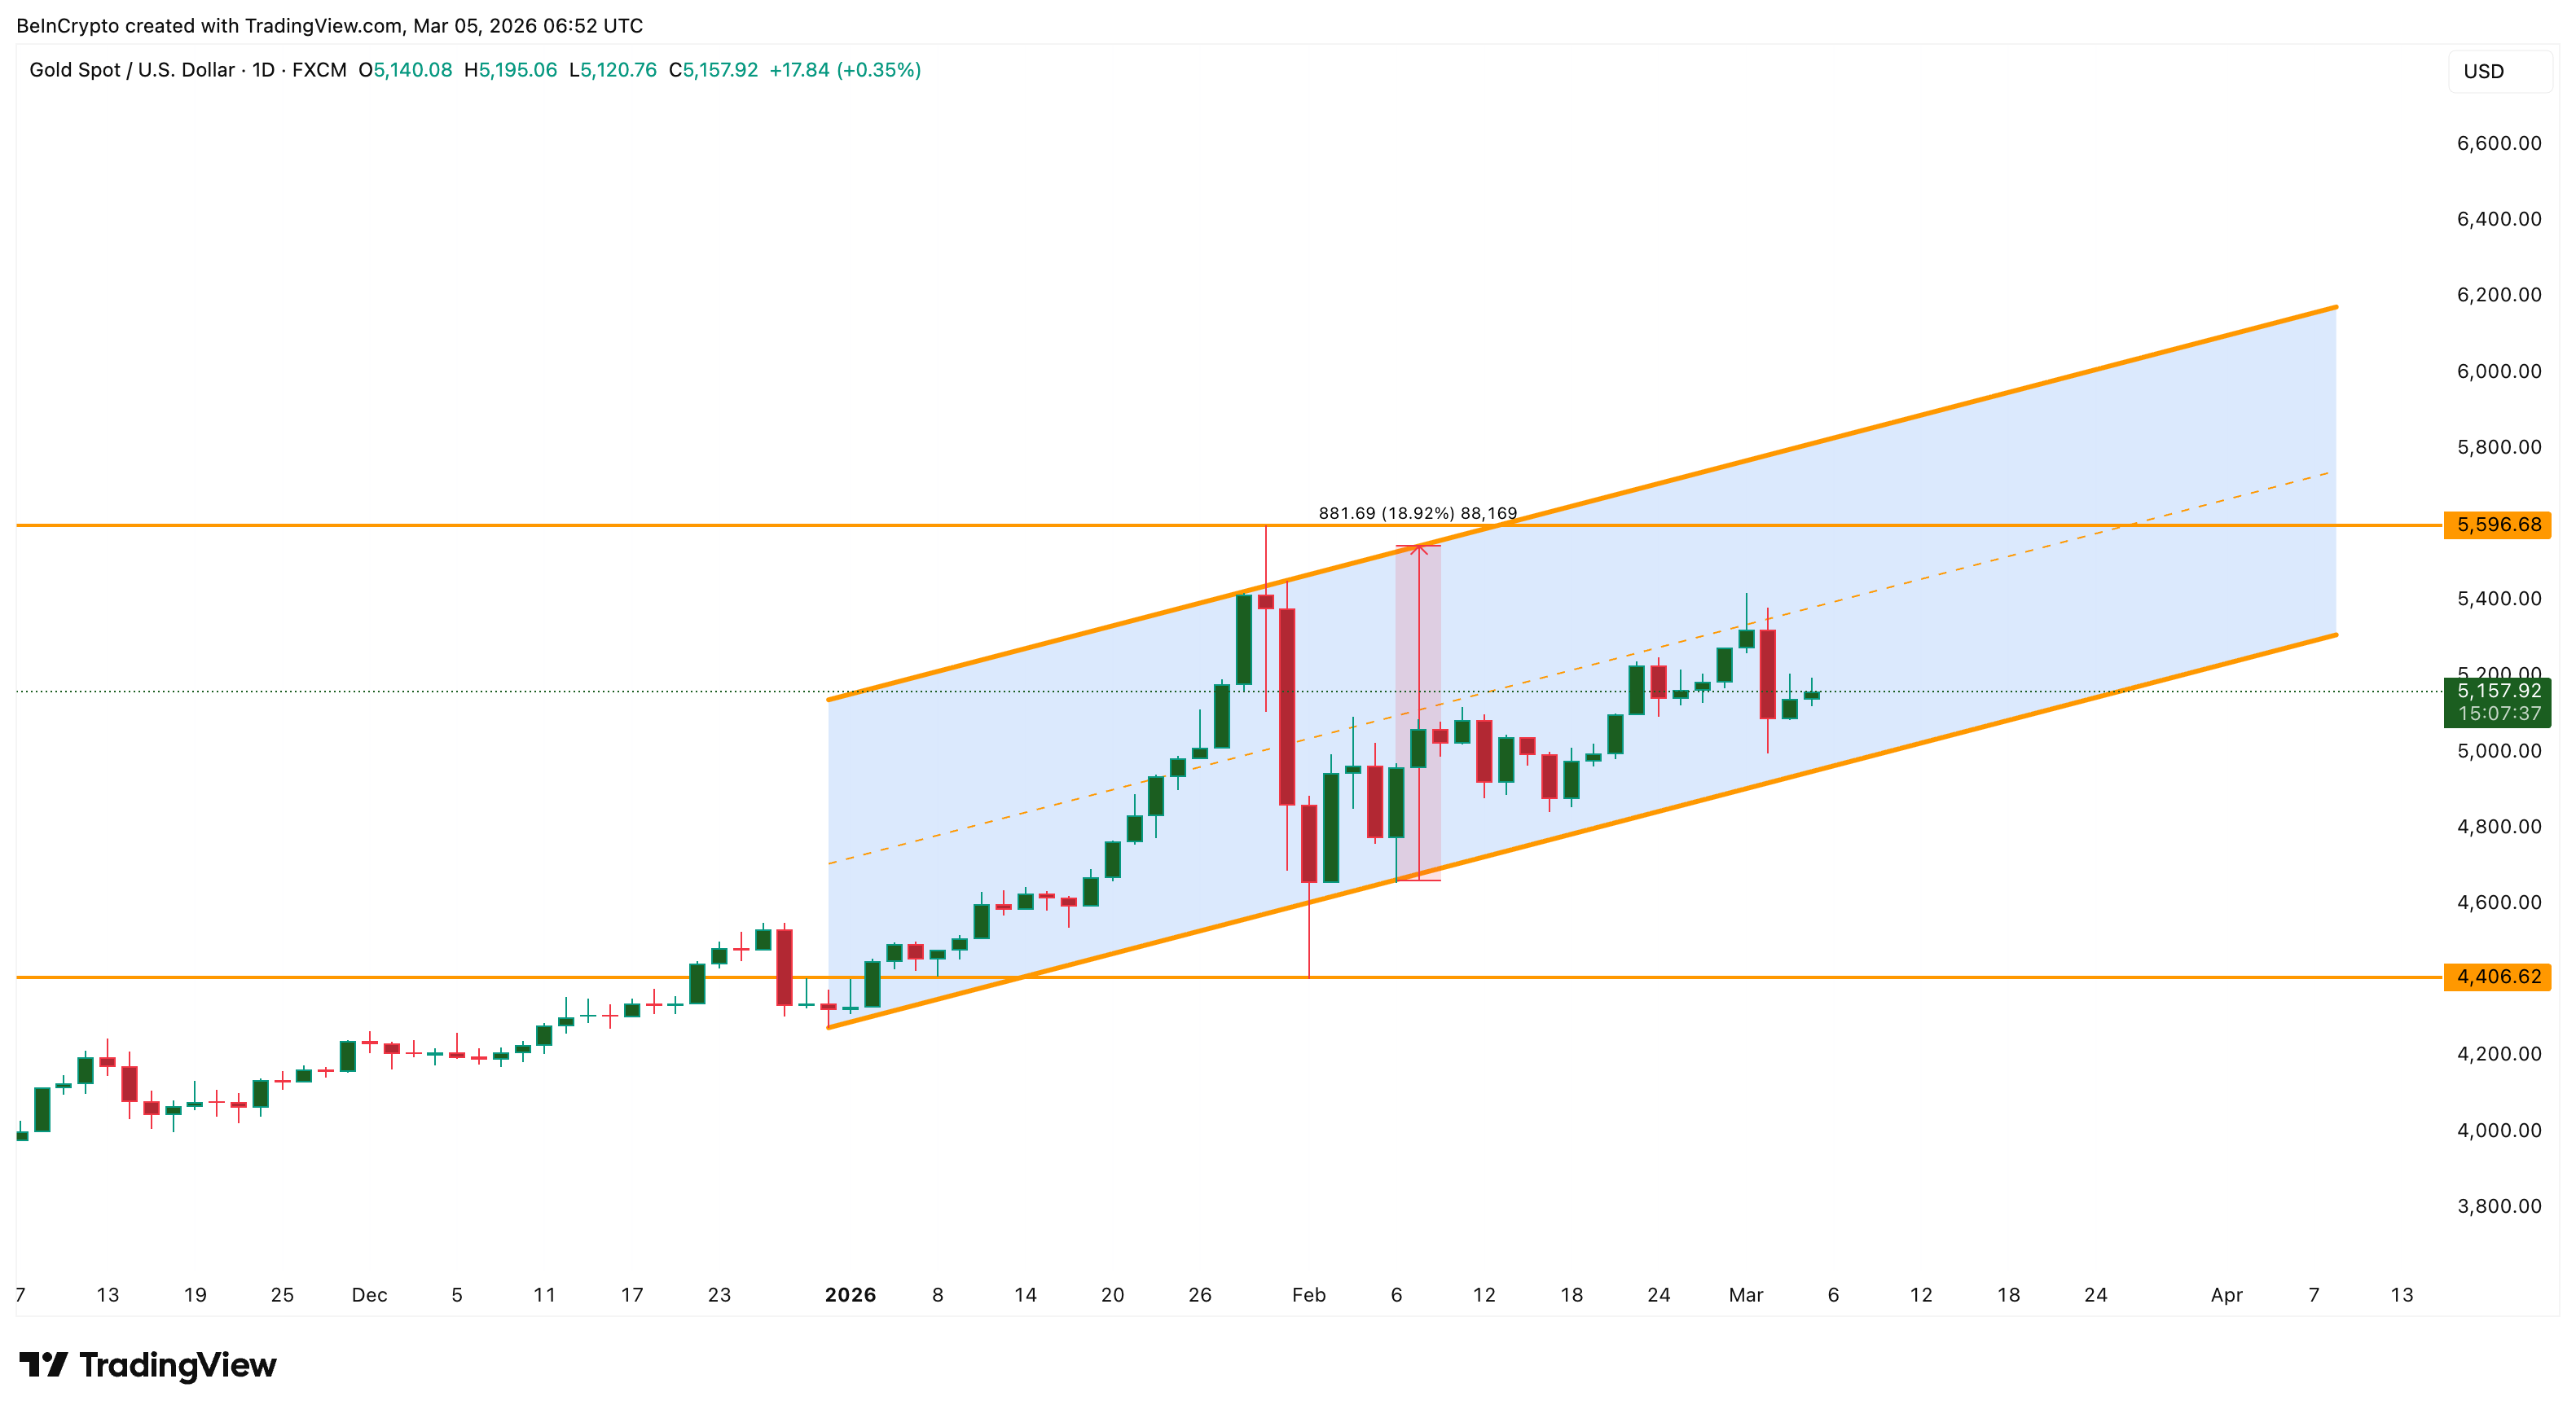
Gold has been trading inside an ascending channel on the daily chart since late December 2025. The channel has been tested twice — once to the upside when the Gold price spiked to $5,590, marking the all-time high on January 29, and once to the downside when sellers pushed it to $4,400 in early February. Both deviations were absorbed back within days, confirming strong conviction at the boundaries.
At $5,150, gold sits mid-channel. The structure is clearly bullish; every dip has been bought, and no daily candle has closed below the channel since its formation.
But the structure alone doesn’t explain why gold is outperforming, up almost 8% month-on-month.
For that, you need to look at what should be hurting it and isn’t.
Oil Is Disrupting The Traditional Gold Playbook
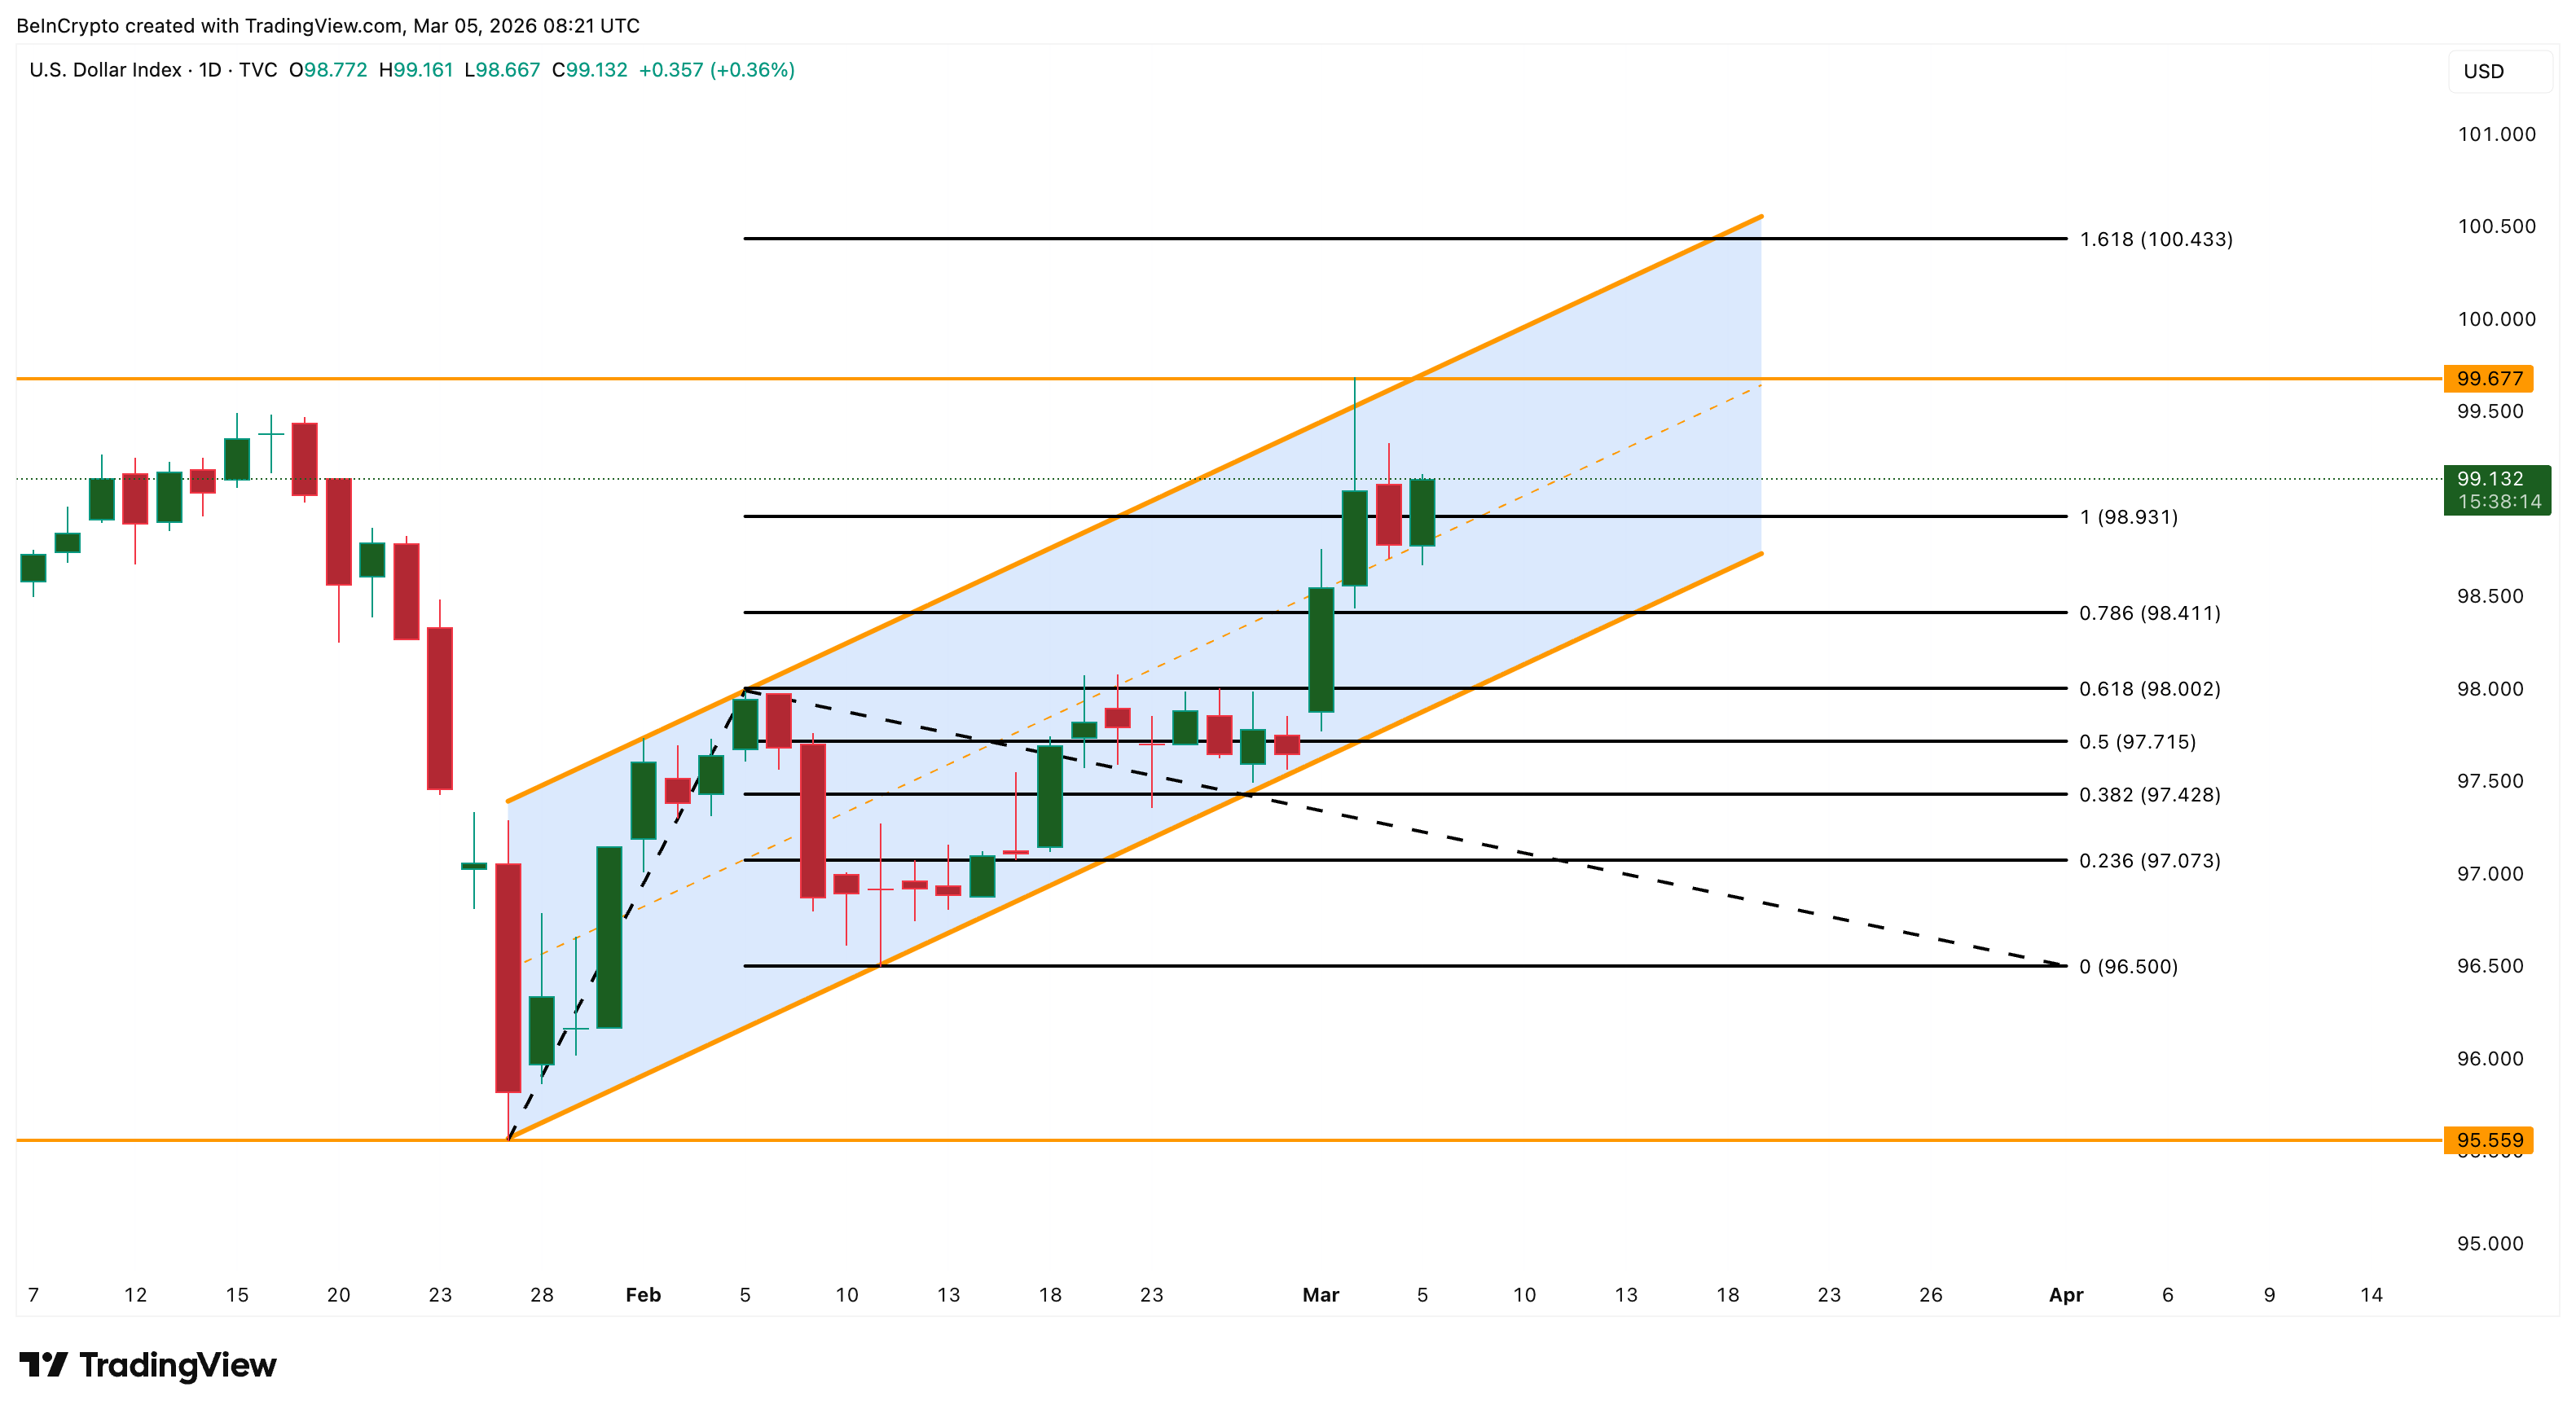
The US Dollar Index (DXY) has surged from 95.55 in late January to 99.13 at press time. It is moving inside its own ascending channel with the extensions targeting even 100.43.
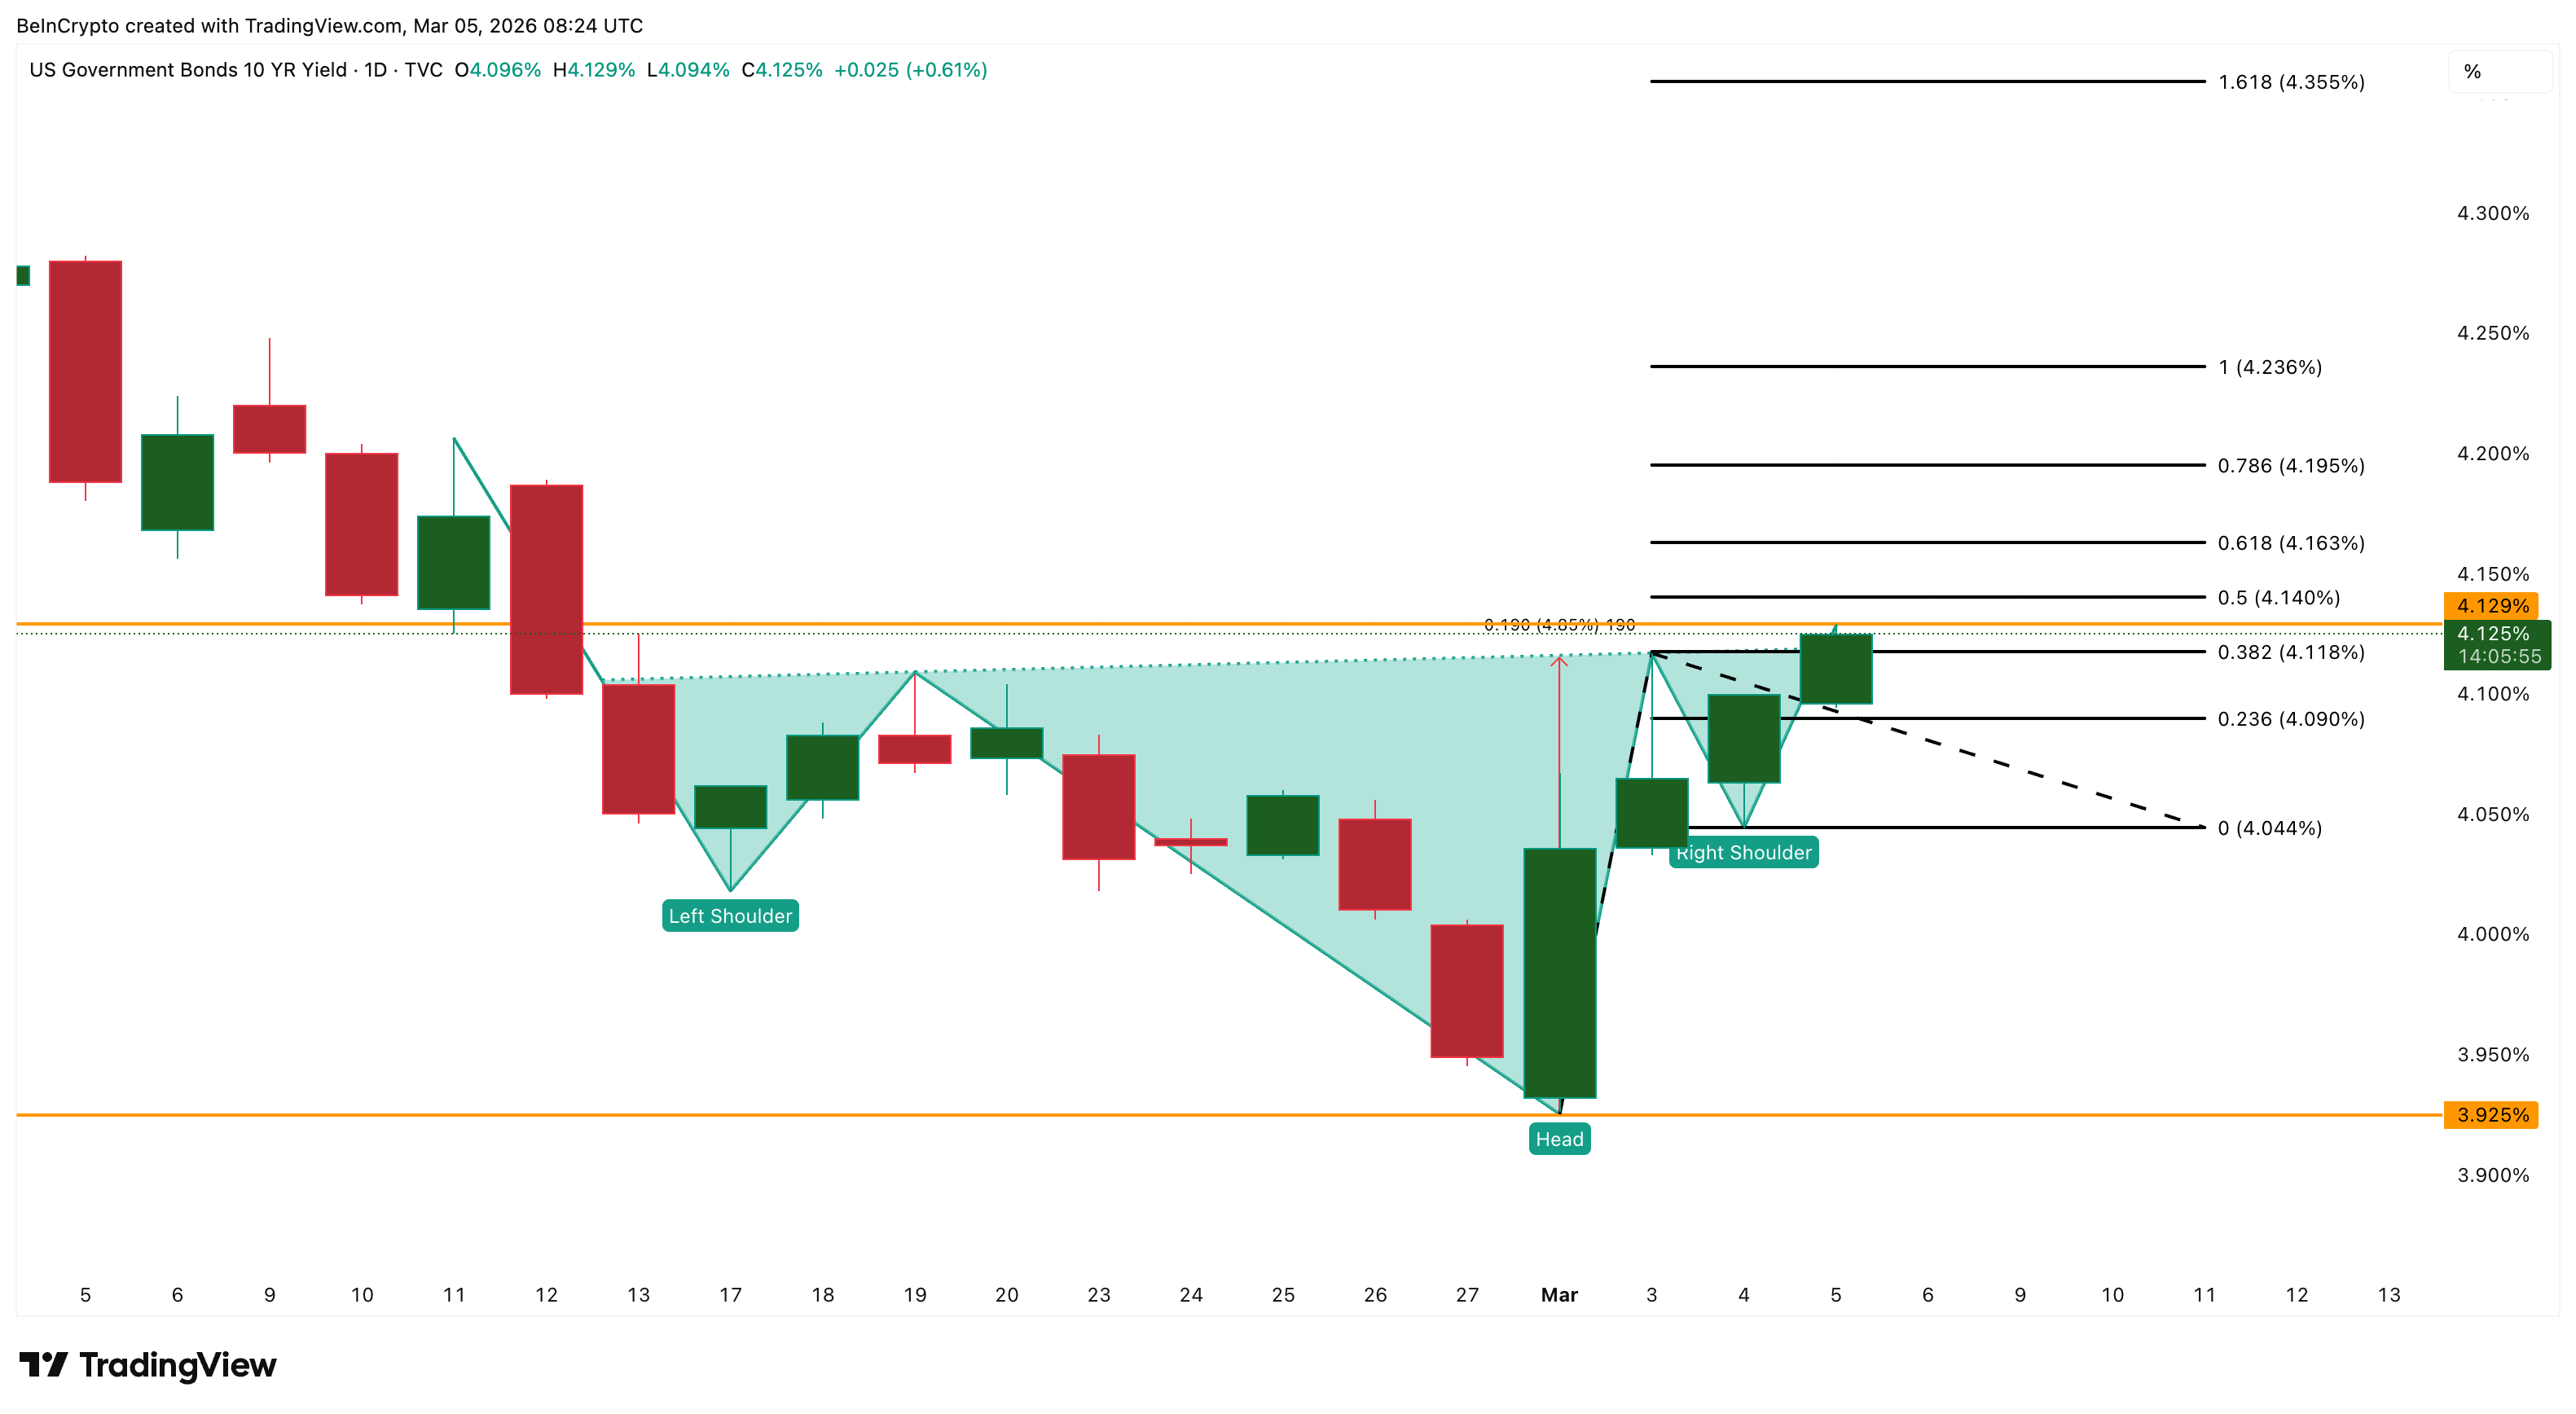
Simultaneously, the US 10-Year Treasury Yield (US10Y) is forming an inverse head-and-shoulders on the daily chart, recovering from 3.92% in early March to 4.12%, with a breakout target near 4.23% to 4.35%.
A rising dollar and climbing yields normally crush gold. Yet gold is absorbing both relatively well, and the reason is the nature of this dollar rally.
The DXY surge is oil-driven. Escalating tensions around the US-Iran conflict have supposedly pushed crude higher. Since oil is globally priced in USD, rising crude feeds directly into inflation expectations, which strengthens the dollar and pushes yields up. This disrupts the traditional playbook where geopolitical uncertainty weakens the dollar and sends gold soaring.
Gold did surge to $5,400 on the initial conflict shock, but couldn’t sustain it because the dollar kept climbing alongside. Safe-haven demand supports gold from below, while the oil-inflation-dollar chain caps it from above. Plus, over the past few trading sessions, BTC has outperformed Gold, showing better tolerance to the dollar strength.
Yet, the price hasn’t broken down and seems flat over the past week, waiting to break free.
For gold to break free, this chain needs to snap. A de-escalation could drop oil, ease inflation fears, pull DXY possibly below 98, and Yields under 4%. That would remove both ceilings at once. And when those ceilings lift, the floor isn’t going anywhere.
Institutions Are Already In, And They’re Not Leaving
The Commitment of Traders (COT) report, published weekly by the Commodity Futures Trading Commission (CFTC), shows Managed Money: hedge funds and Commodity Trading Advisors, holding a net long of roughly 96,000 contracts (difference of long and shorts) on COMEX Gold Futures as of February 24 (the last COT release).
The position barely moved week-over-week — hedge funds trimmed both longs and shorts marginally, a book-squaring move, not a directional exit.
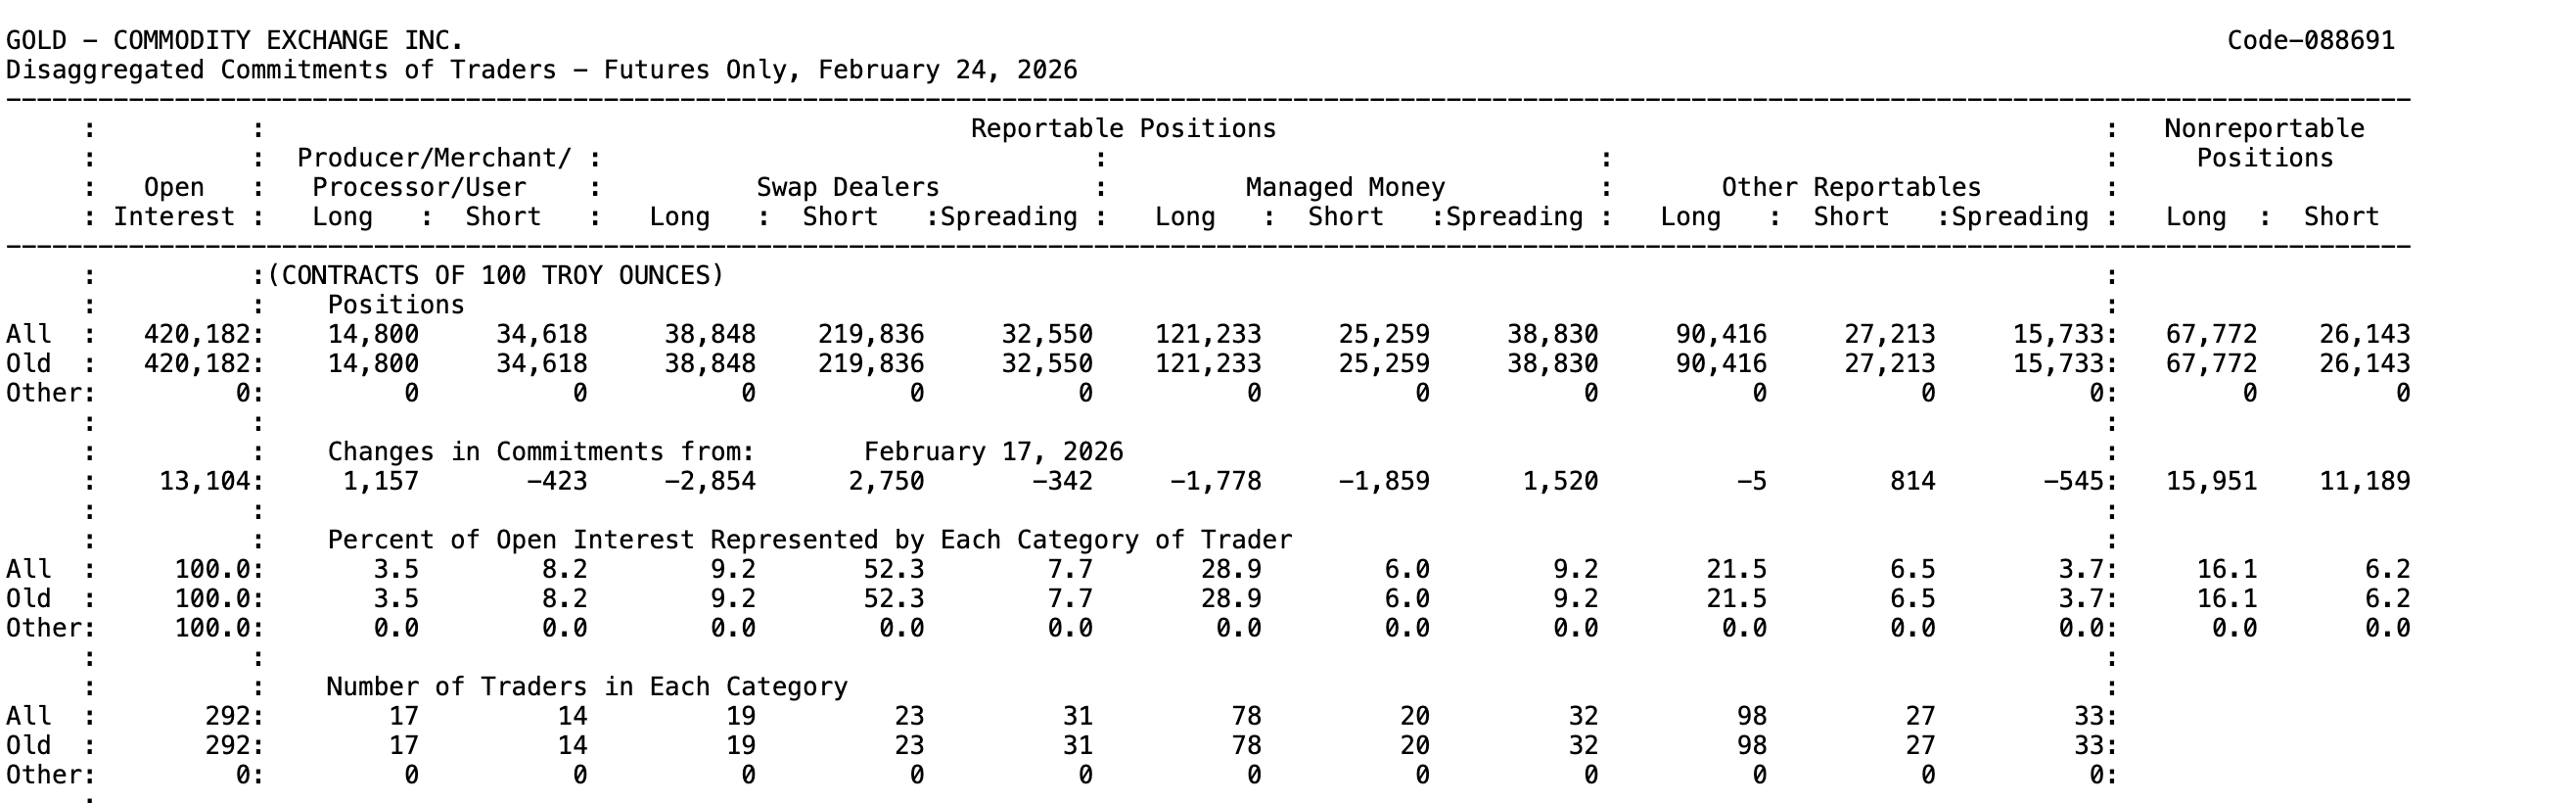
Total open interest rose over 13,000 contracts to 420,182, meaning fresh capital is entering through broader institutional channels.
Rising open interest alongside a stable price (flat week-on-week) indicates conviction. Compare this to silver, where managed money holds just 8,500 net long contracts and open interest is declining.
The institutional bid extends beyond futures markets. On March 5, reports emerged that Trump officials brokered a multimillion-dollar deal to export up to 1,000 kilograms of Venezuelan gold to US markets, signaling that country-level demand for physical gold is intensifying alongside speculative positioning (COT open interest rising).
The Gold-Silver Ratio (XAUXAG) confirms the rotation. On the daily chart, the ratio itself is forming an inverse head-and-shoulders with a neckline near 64.71. Currently at 61.84, having surged since late February, a breakout above 64.71 projects toward 69.54 and 75.51, a move favoring gold.
Gold functions as a store of value and an inflation hedge, while roughly 60% of silver’s consumption is industrial.
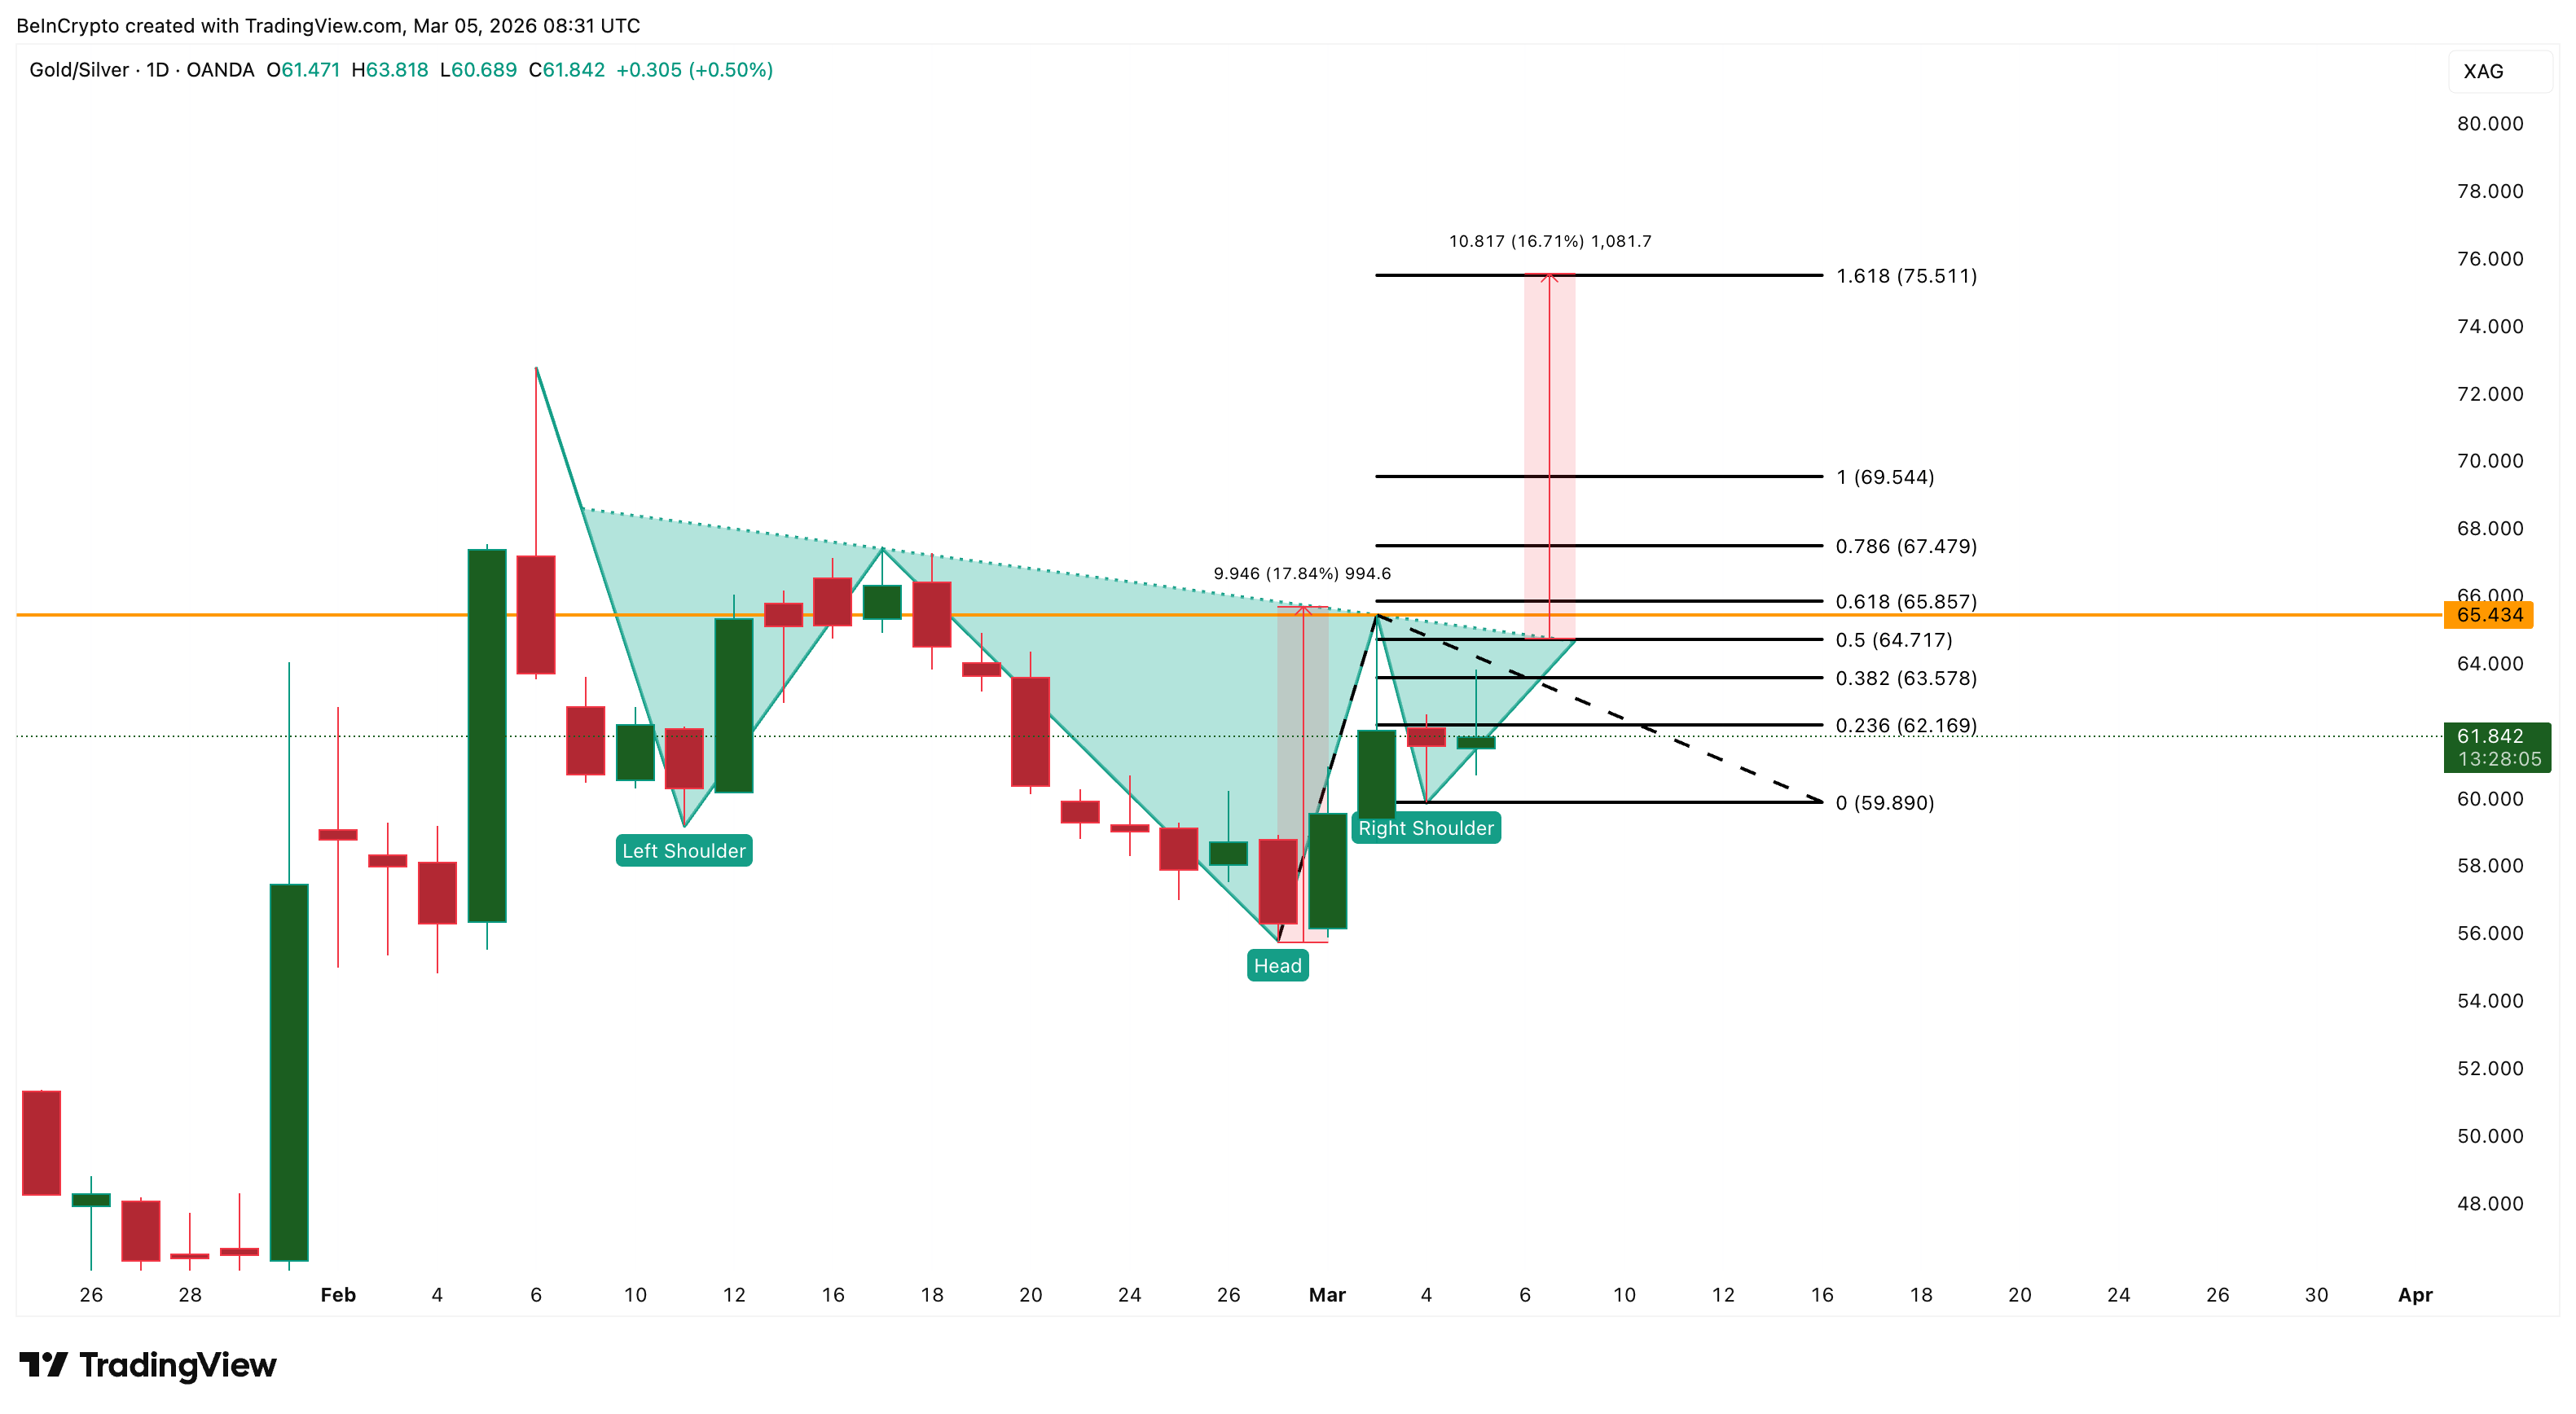
With recession fears and trade war anxiety in play, institutions could move towards choosing gold’s safe-haven angle over silver’s cyclical exposure. The ratio breakout means the next wave of flows goes into gold first, giving it more immediate explosive potential once headwinds ease.
Gold Price Levels To Watch Now
Gold’s bias remains bullish within the channel, but the breakout is gated by oil’s downstream effects on the dollar and yields.
The first hurdle is $5,220 at the 0.618 Fibonacci. The critical gate is $5,440 at the 0.786 — this level blocked the move on January 29. Gold hasn’t reclaimed it since. A sustained close above $5,440 shifts the structure from range-bound to trending.
Above $5,440, the path opens to $5,730 at the 1.0 Fibonacci and the all-time high zone. The 1.618 extension sits at $6,540, and the full channel-projected move targets $6,960; roughly 19% upside from the current trendline. Those targets become realistic if oil pulls back, DXY weakens below 98, and yields settle under 4%.
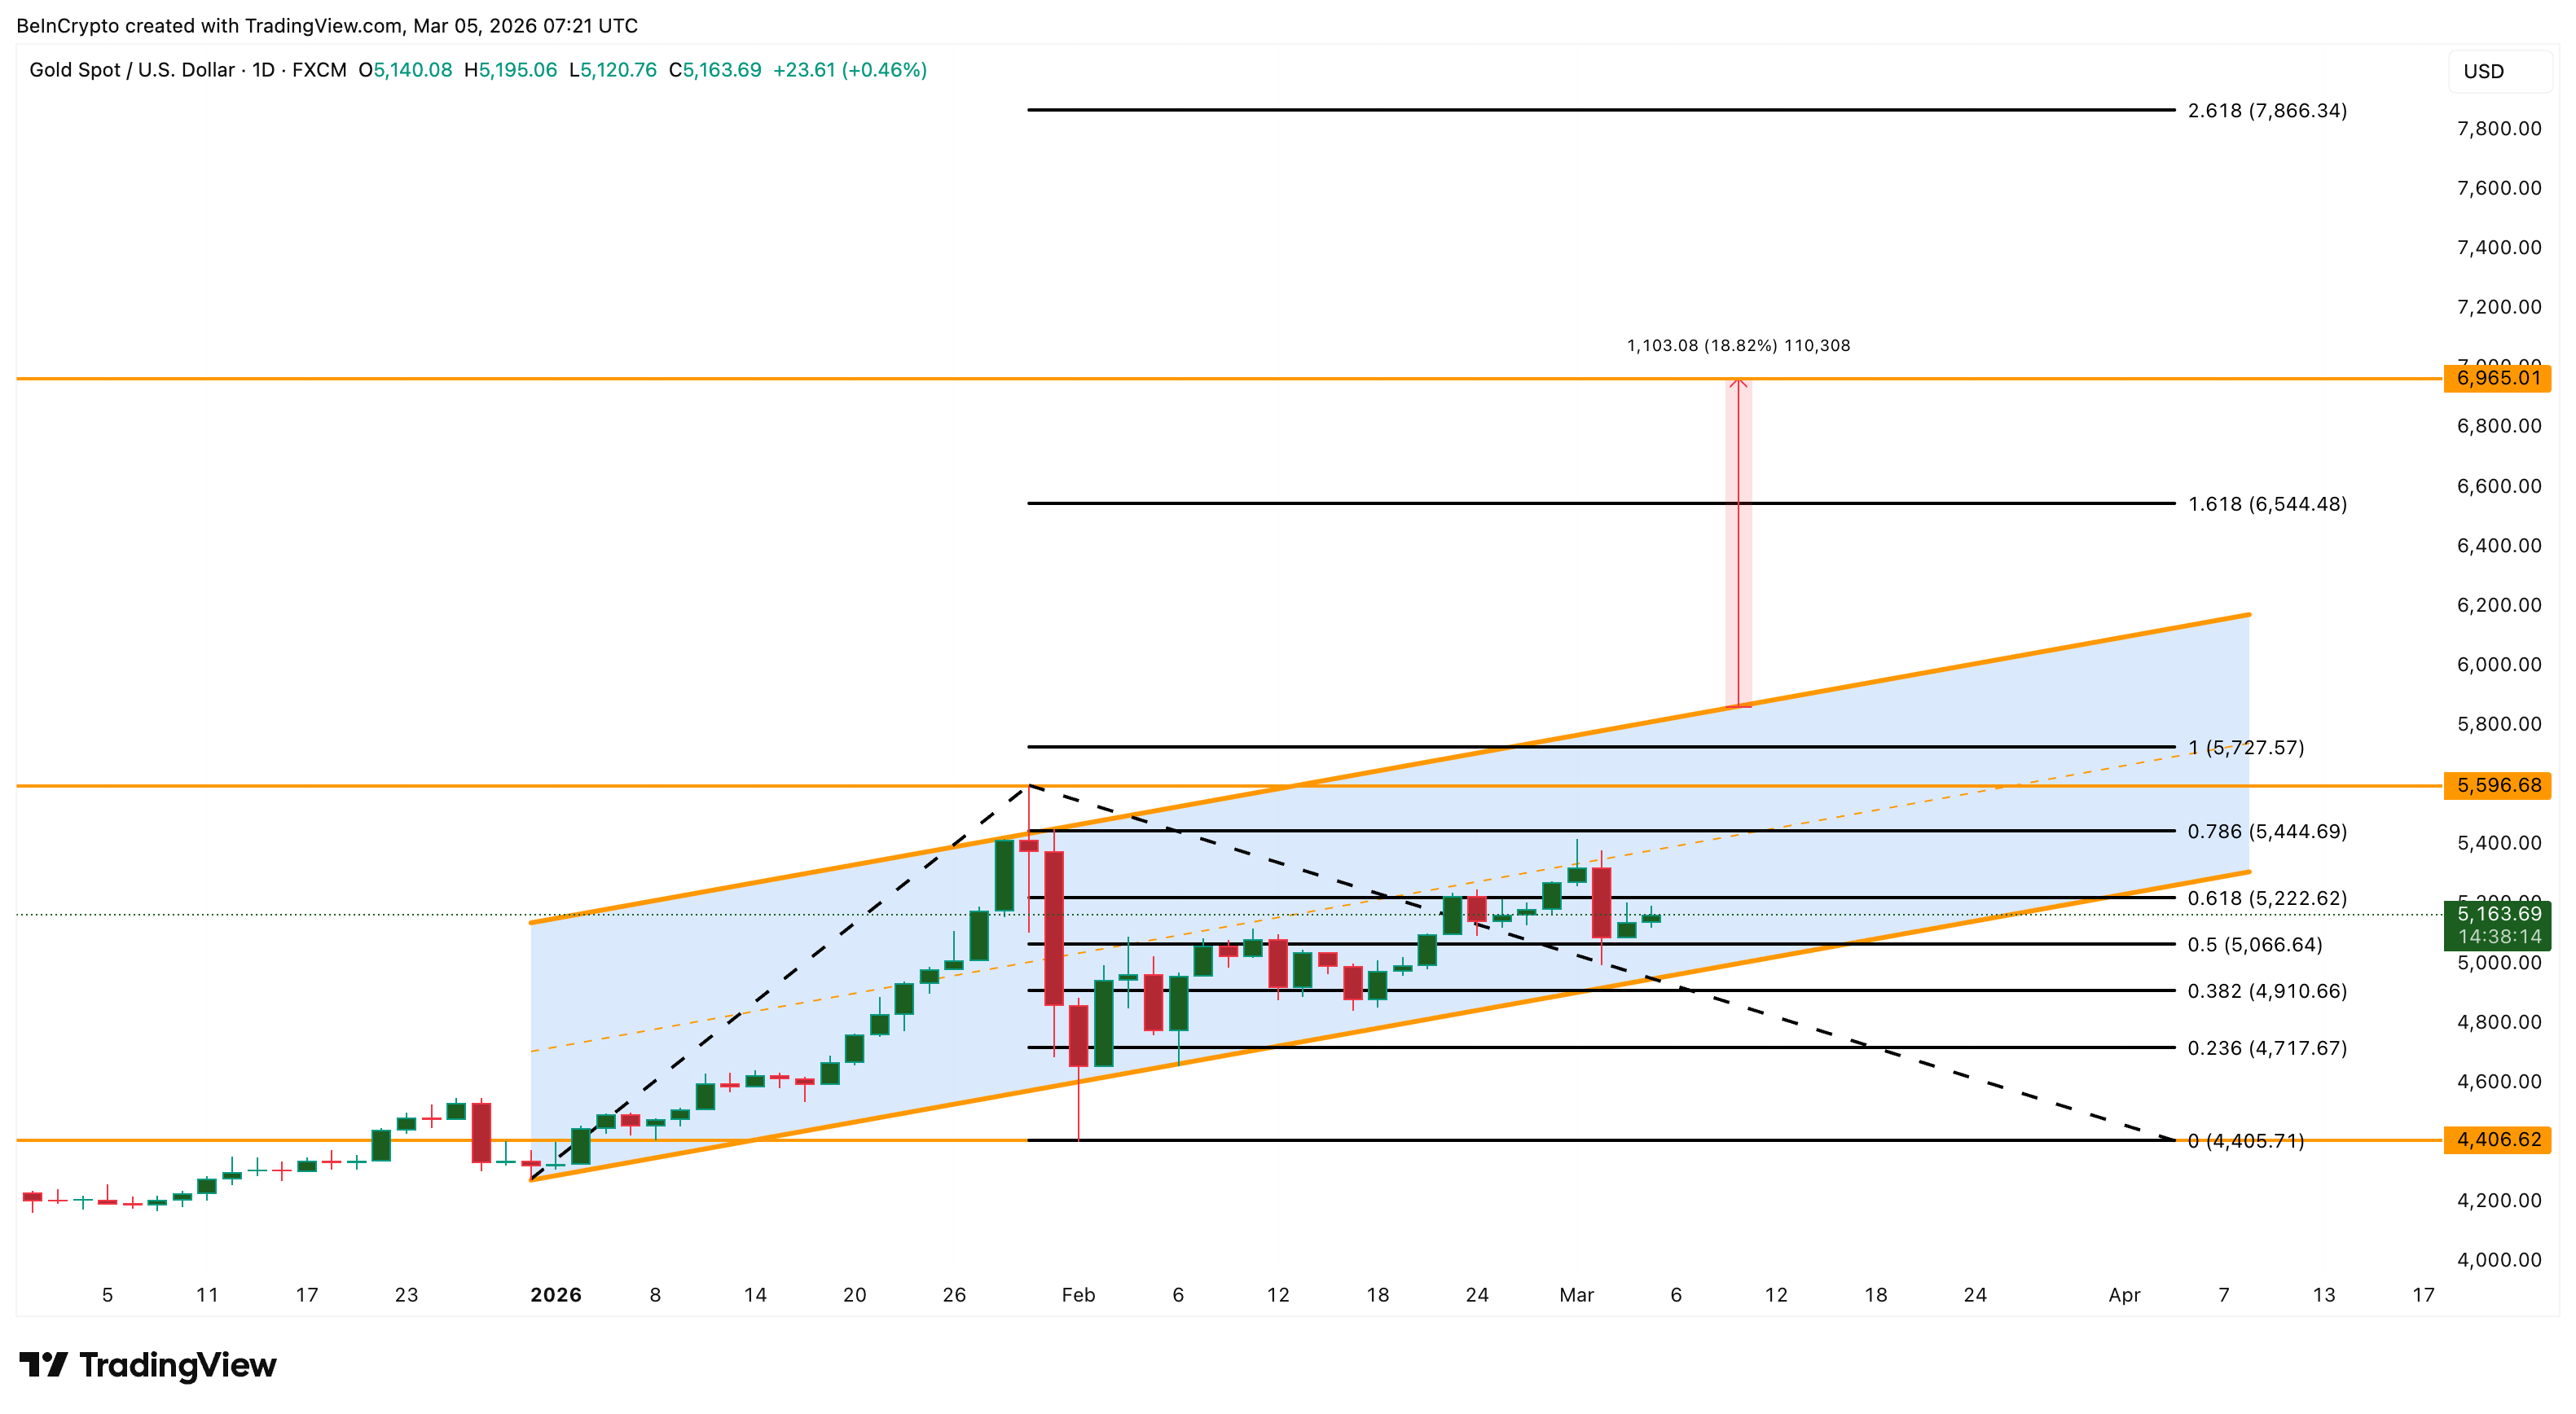
On the downside, a loss of $5,060 pushes the gold price toward $4,910. A close below $4,910 would crack the channel for the first time since December. That scenario gains traction only if DXY and yields push higher.
The structure, positioning, and ratio all point higher. The only thing between gold and $6,500 is the oil-dollar-yield chain, and that chain is only as strong as the geopolitical tensions sustaining it.
* The content presented above, whether from a third party or not, is considered as general advice only. This article should not be construed as containing investment advice, investment recommendations, an offer of or solicitation for any transactions in financial instruments.


