


Oil Price Crosses $110 as Market Participation Halves and Bond Yields Flash a Warning


Brent crude futures trade near $113 after surging over 46% year-to-date, driven by the Iran war’s disruption of Strait of Hormuz shipping. However, open interest has dropped roughly 50% since late February, raising questions about who is actually fueling this rally. WTI crude oil price also briefly pushed above $100, underscoring that the war premium has now spread across both global and US-focused benchmarks.
The US Dollar Index (DXY) sits near 99.84, playing its oil-driven card as rising yields attract capital into dollar-denominated assets. The 10-year Treasury yield has climbed roughly 45 basis points since the war began on February 28, reaching 4.40%. That bond market pressure is quietly becoming the bigger story.
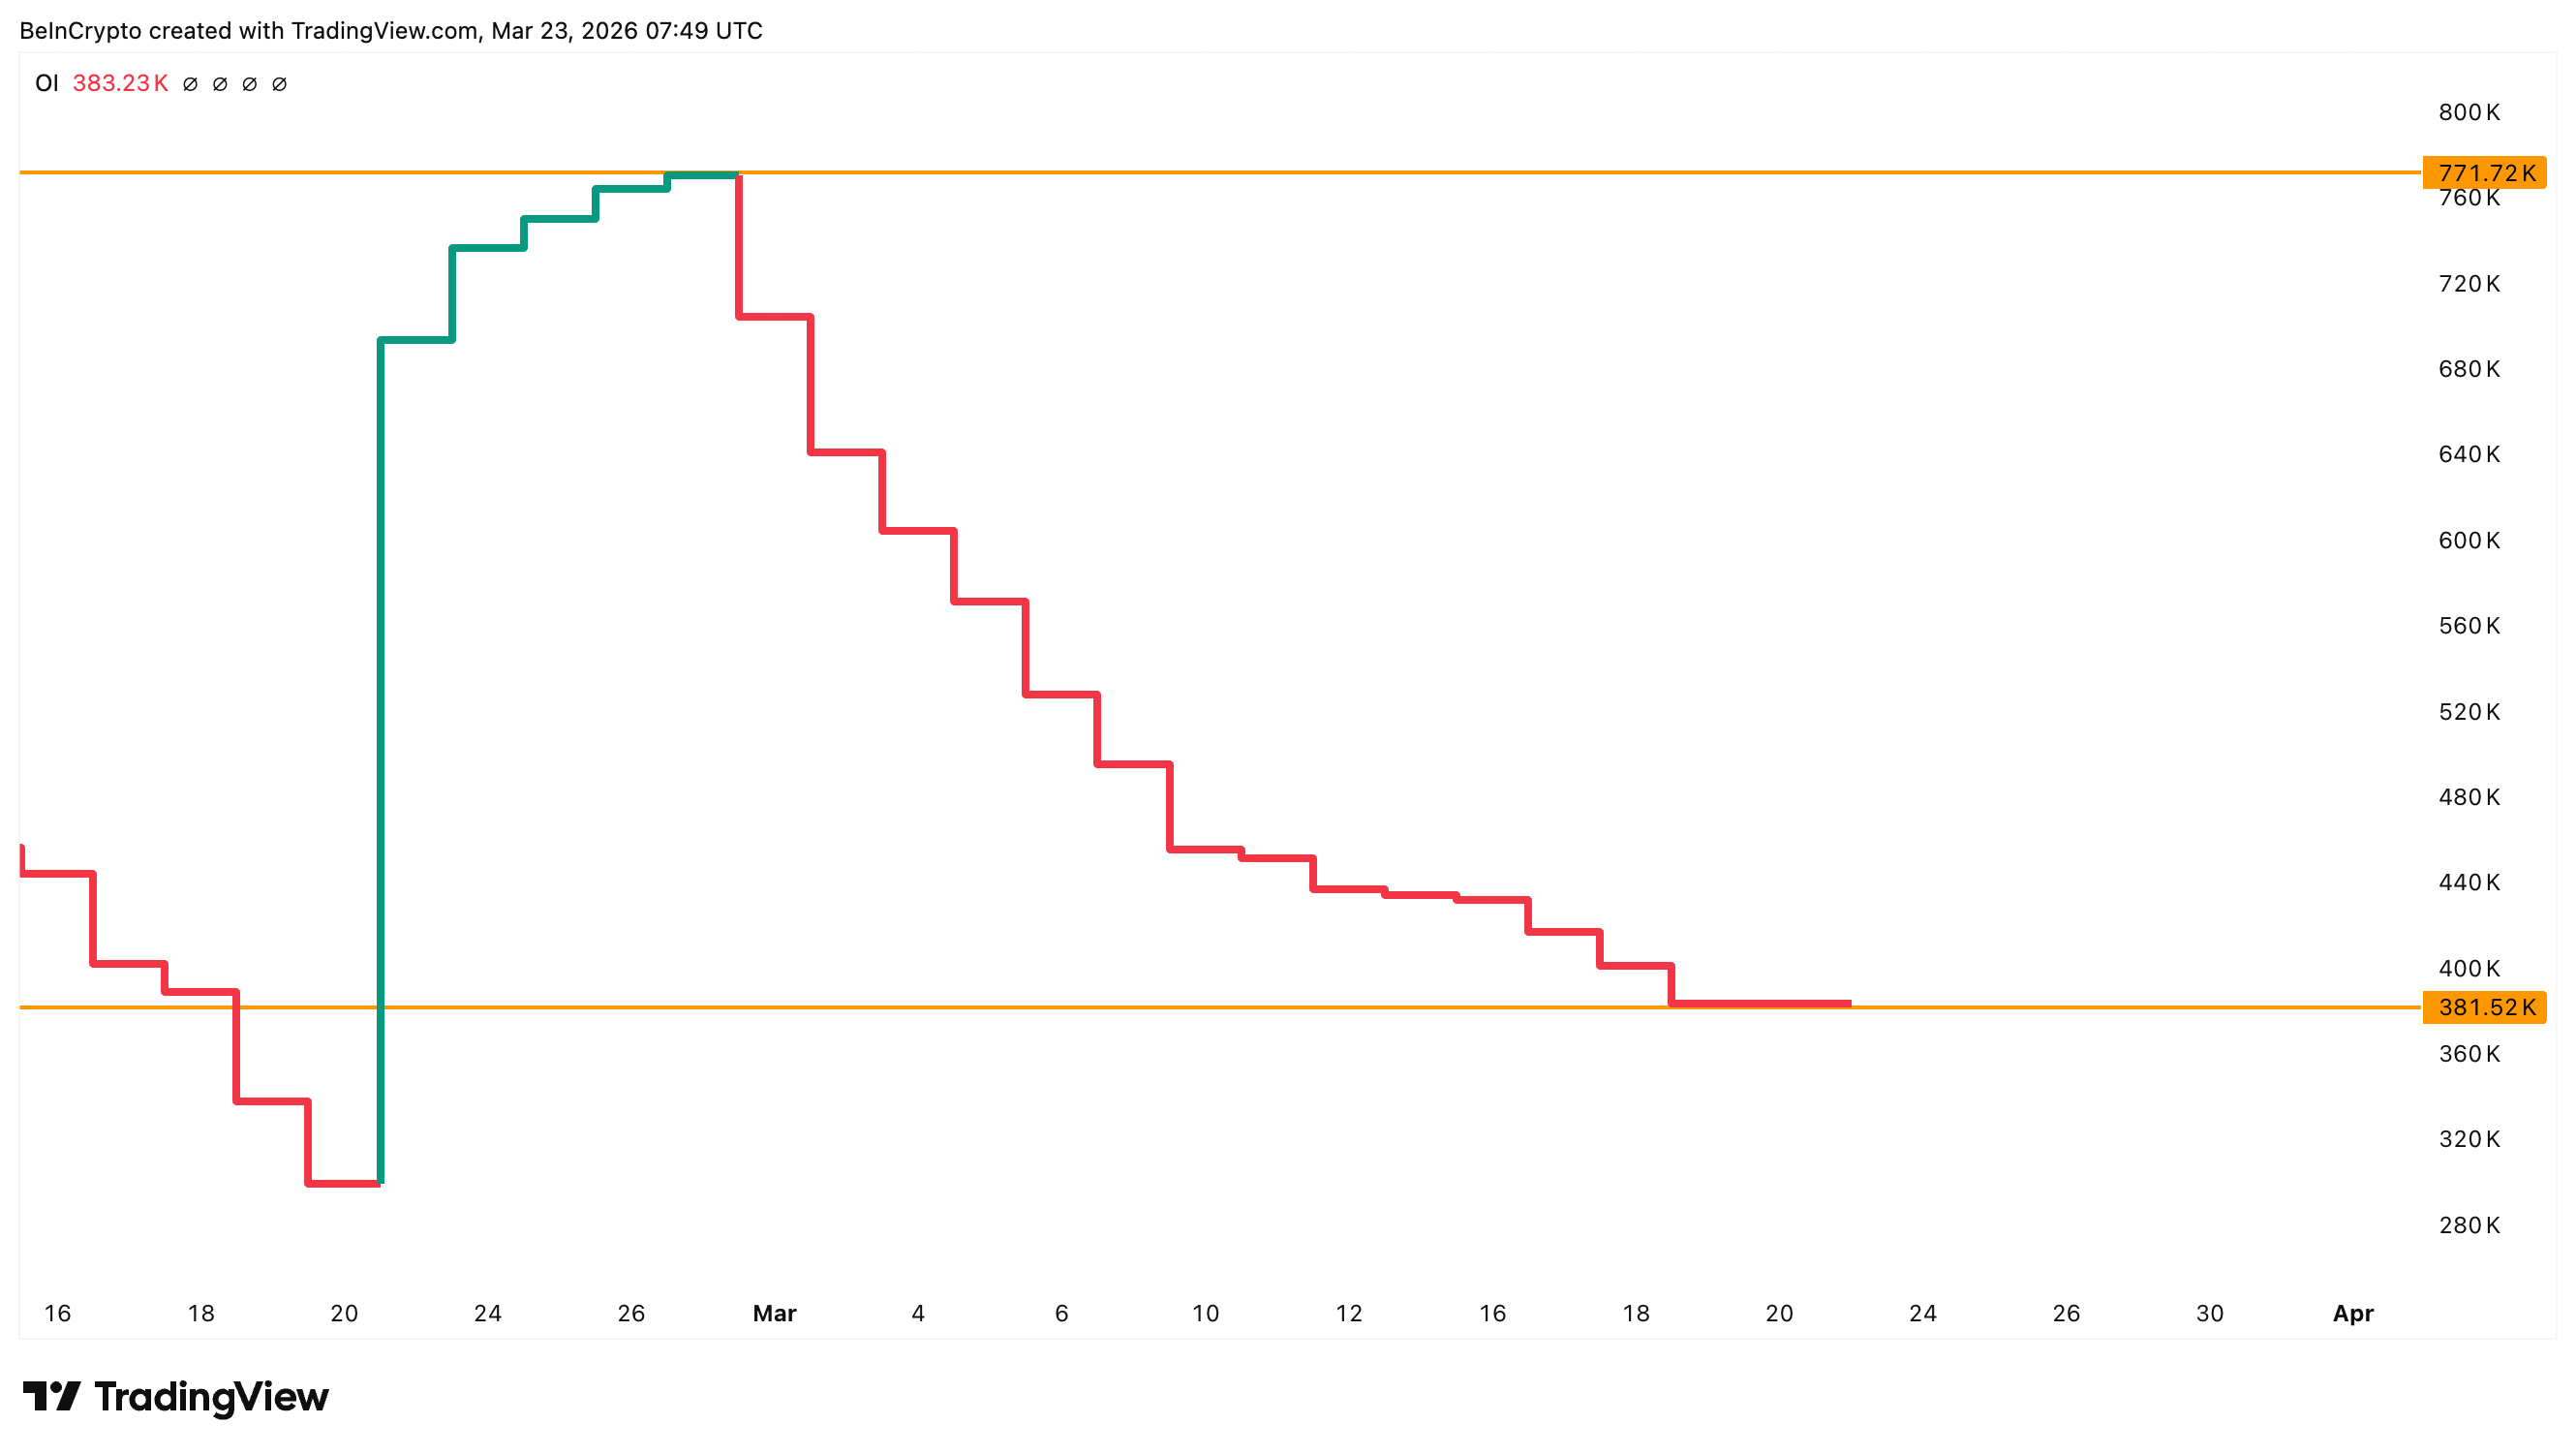
Open Interest Drops as Prices Climb
Brent crude futures on ICE Europe show a striking disconnect. While the oil price has climbed from around $65 in late January to $113 currently, open interest has fallen from roughly 770,000 contracts in late February to 380,000 contracts. That is nearly a 50% decline.
Rising prices with falling open interest is a classic warning in futures markets. It typically means the rally is being fueled by traders closing short positions rather than new buyers entering long positions. Short squeezes can push prices far, yet they tend to exhaust themselves once the shorts have been cleared.
Geopolitical risk from the Strait of Hormuz closure provides a genuine supply shock that can override normal market mechanics. However, the rally’s foundation is thinner than the price chart alone suggests. Whether the trend remains healthy or turns fragile is what the next indicator helps gauge.
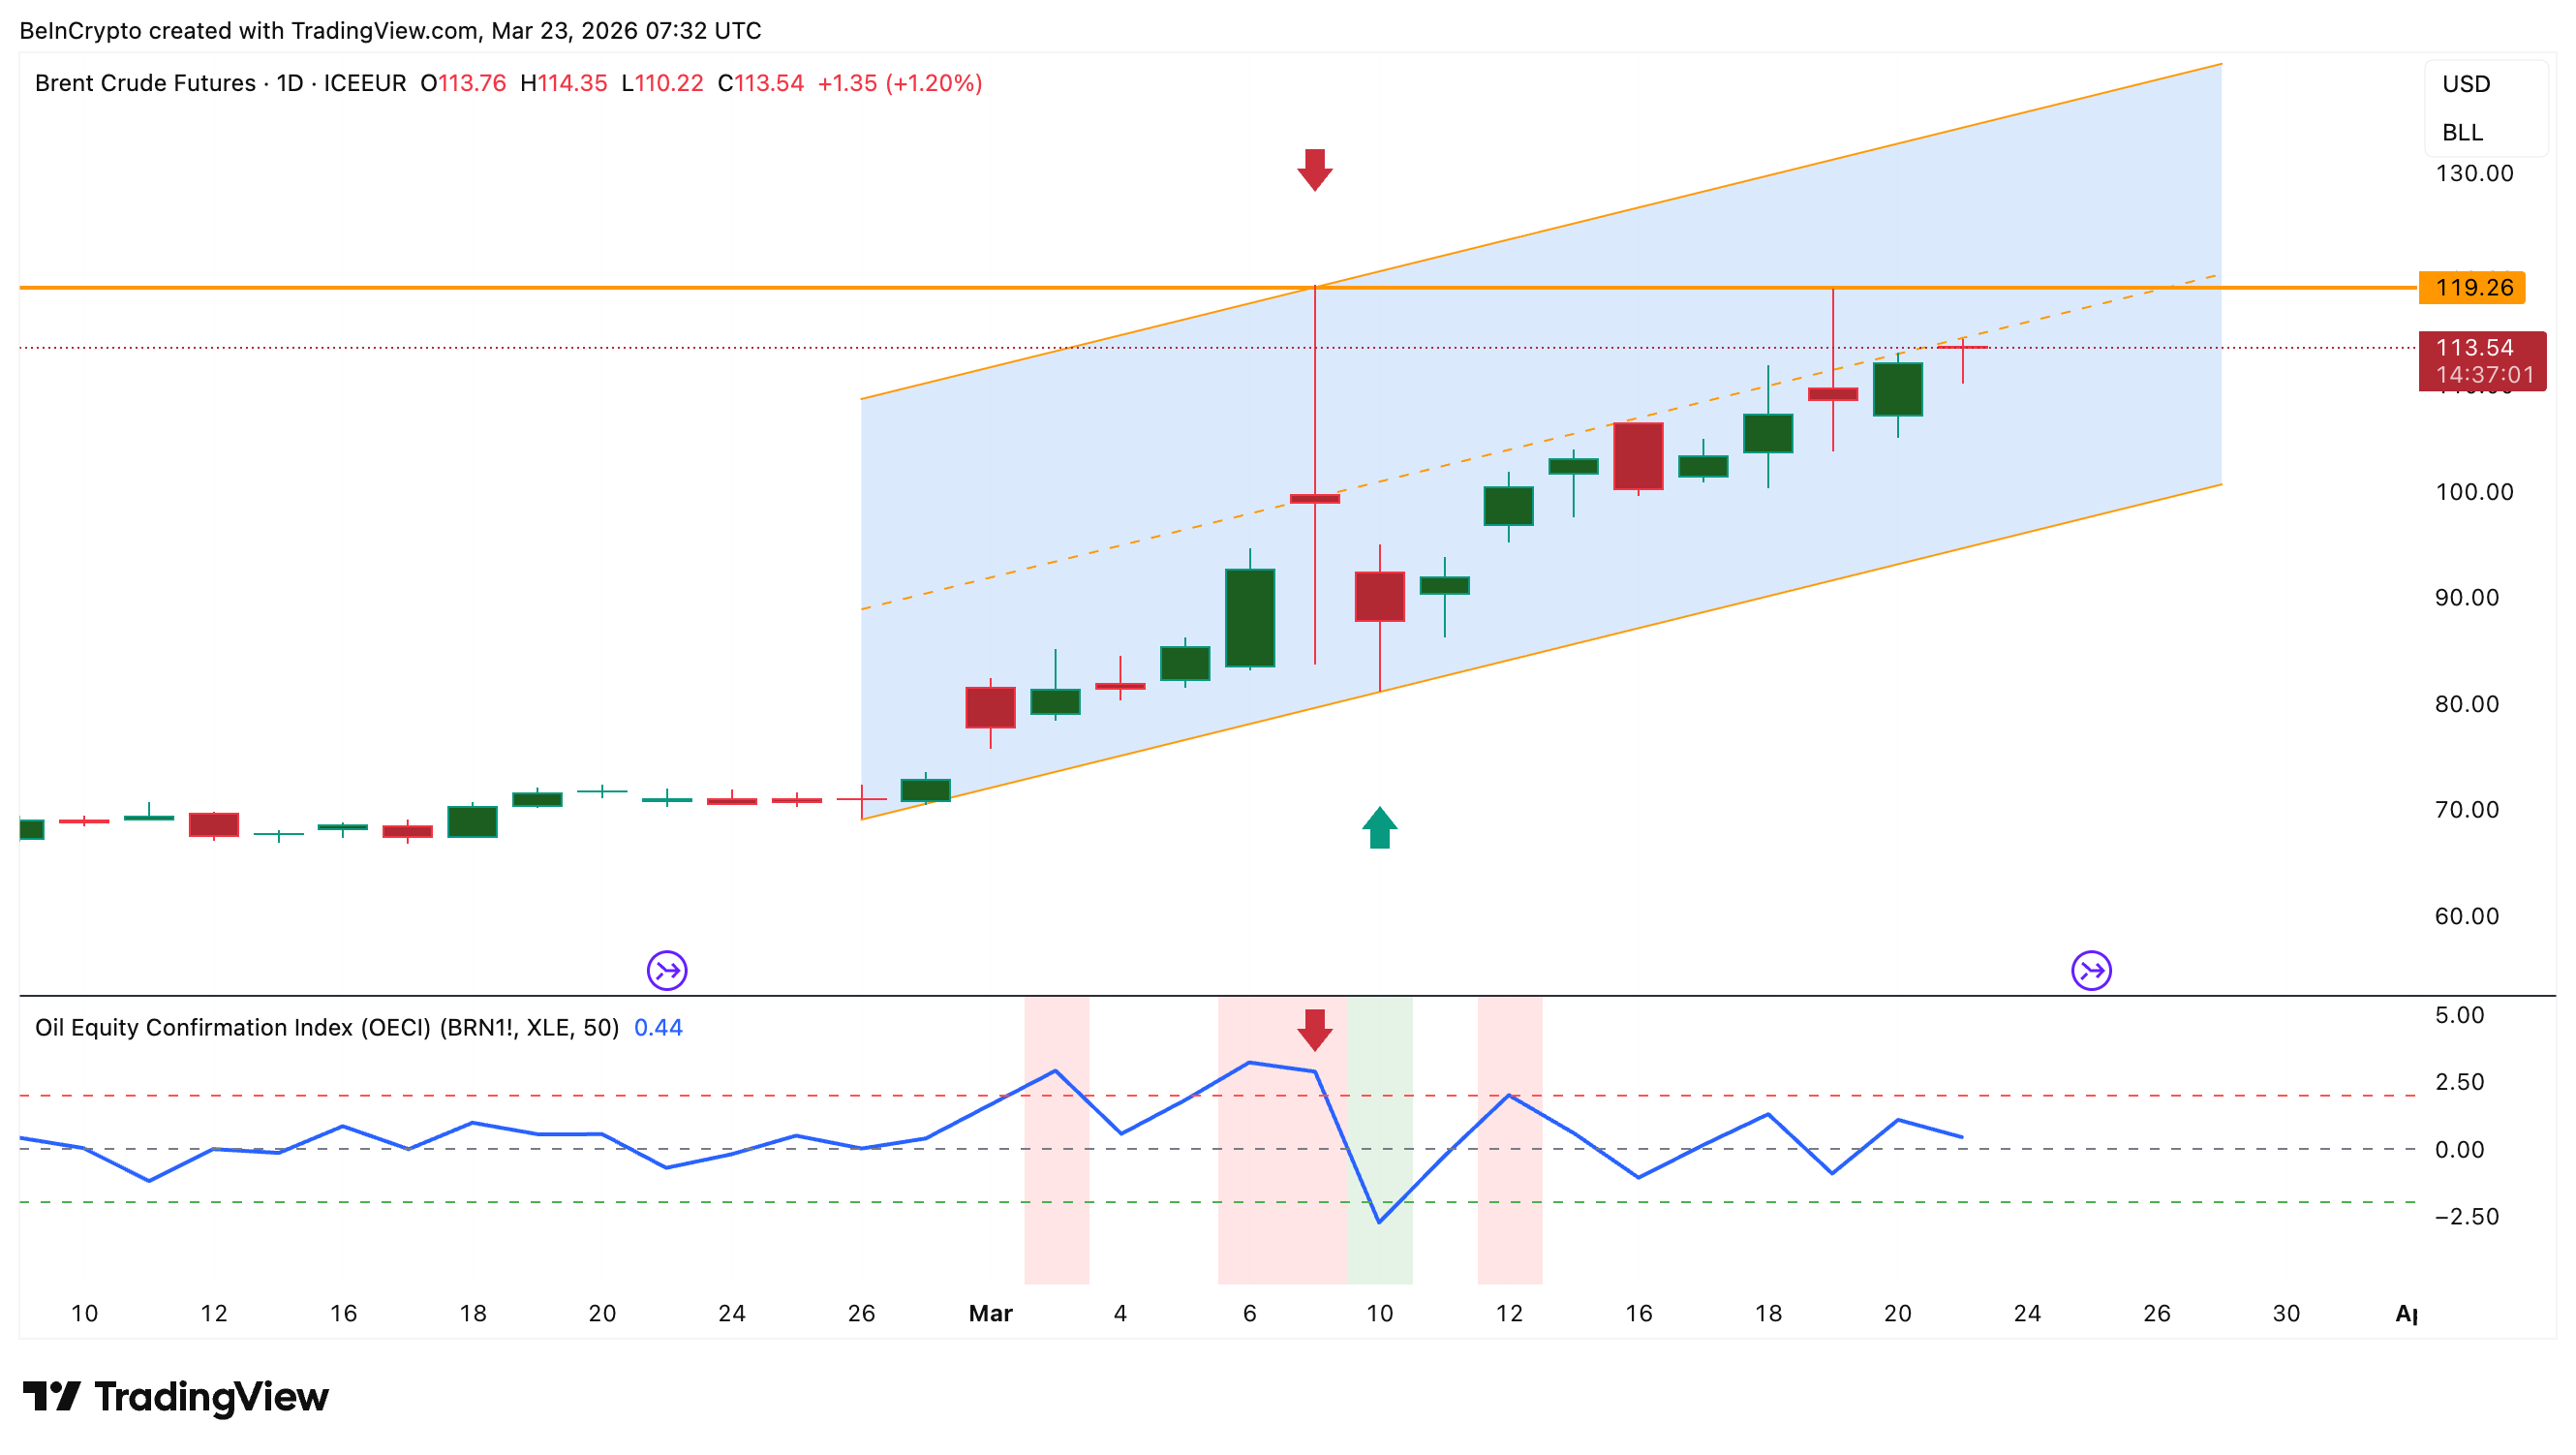
A Proprietary Index Shows the Trend Is Still Healthy
BeInCrypto’s proprietary Oil Equity Confirmation Index (OECI), a Z-score that measures the divergence between Brent crude returns and oil equity returns (XLE), provides a framework for assessing trend health. Above +2, oil is running ahead of equities, reflecting a fear-driven, temporary move. Near zero, oil and equities are aligned, indicating a healthy trend. Below -2, equities outperform oil, pricing in future strength.
The OECI currently reads 0.44, placing oil prices in the healthy zone. When the index hit 3.23 and 2.89 earlier this month, Brent peaked near $119 on March 9 and then corrected. Conversely, when the OECI dipped toward -2.75, prices bounced off the ascending channel’s lower trendline. The current reading suggests the rally has room to continue without overheating.
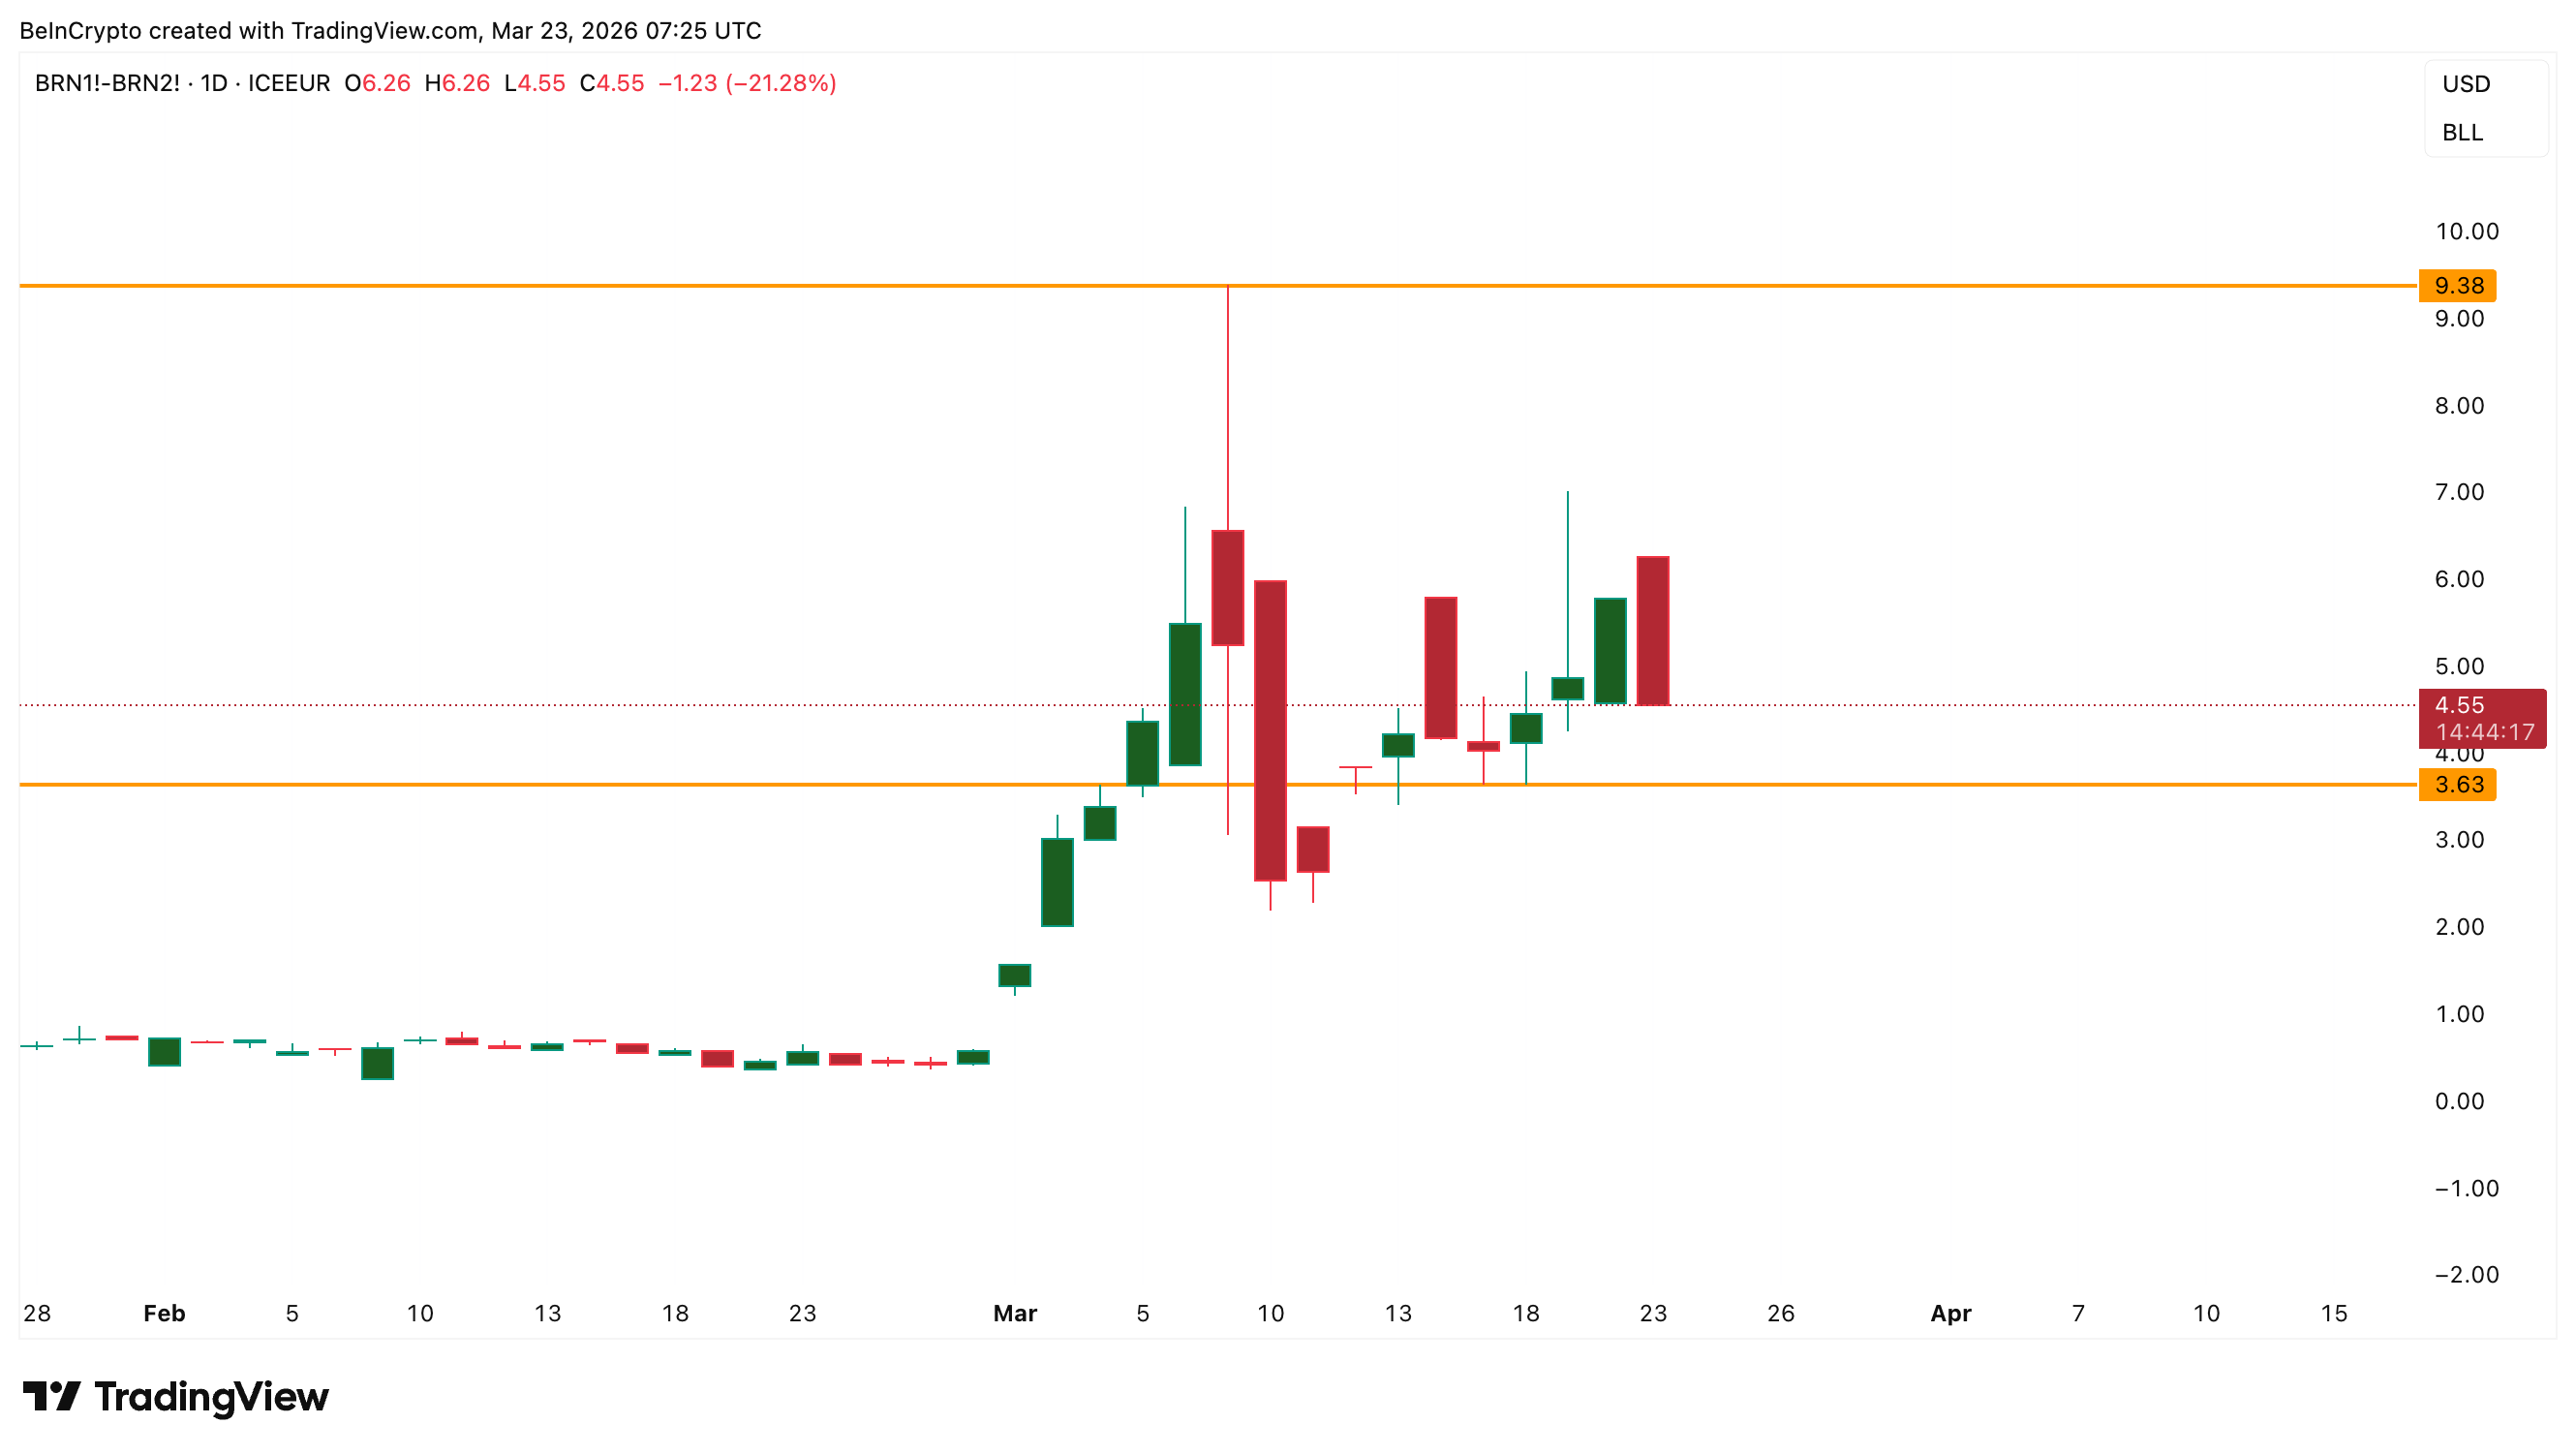
Adding to the bullish case, the BRN1 minus BRN2 spread, the difference between front-month and second-month Brent contracts, sits at $4.55. This means buyers are paying a premium for immediate delivery. This confirms that the urgency for physical barrels has not eased despite the recent price pullback.
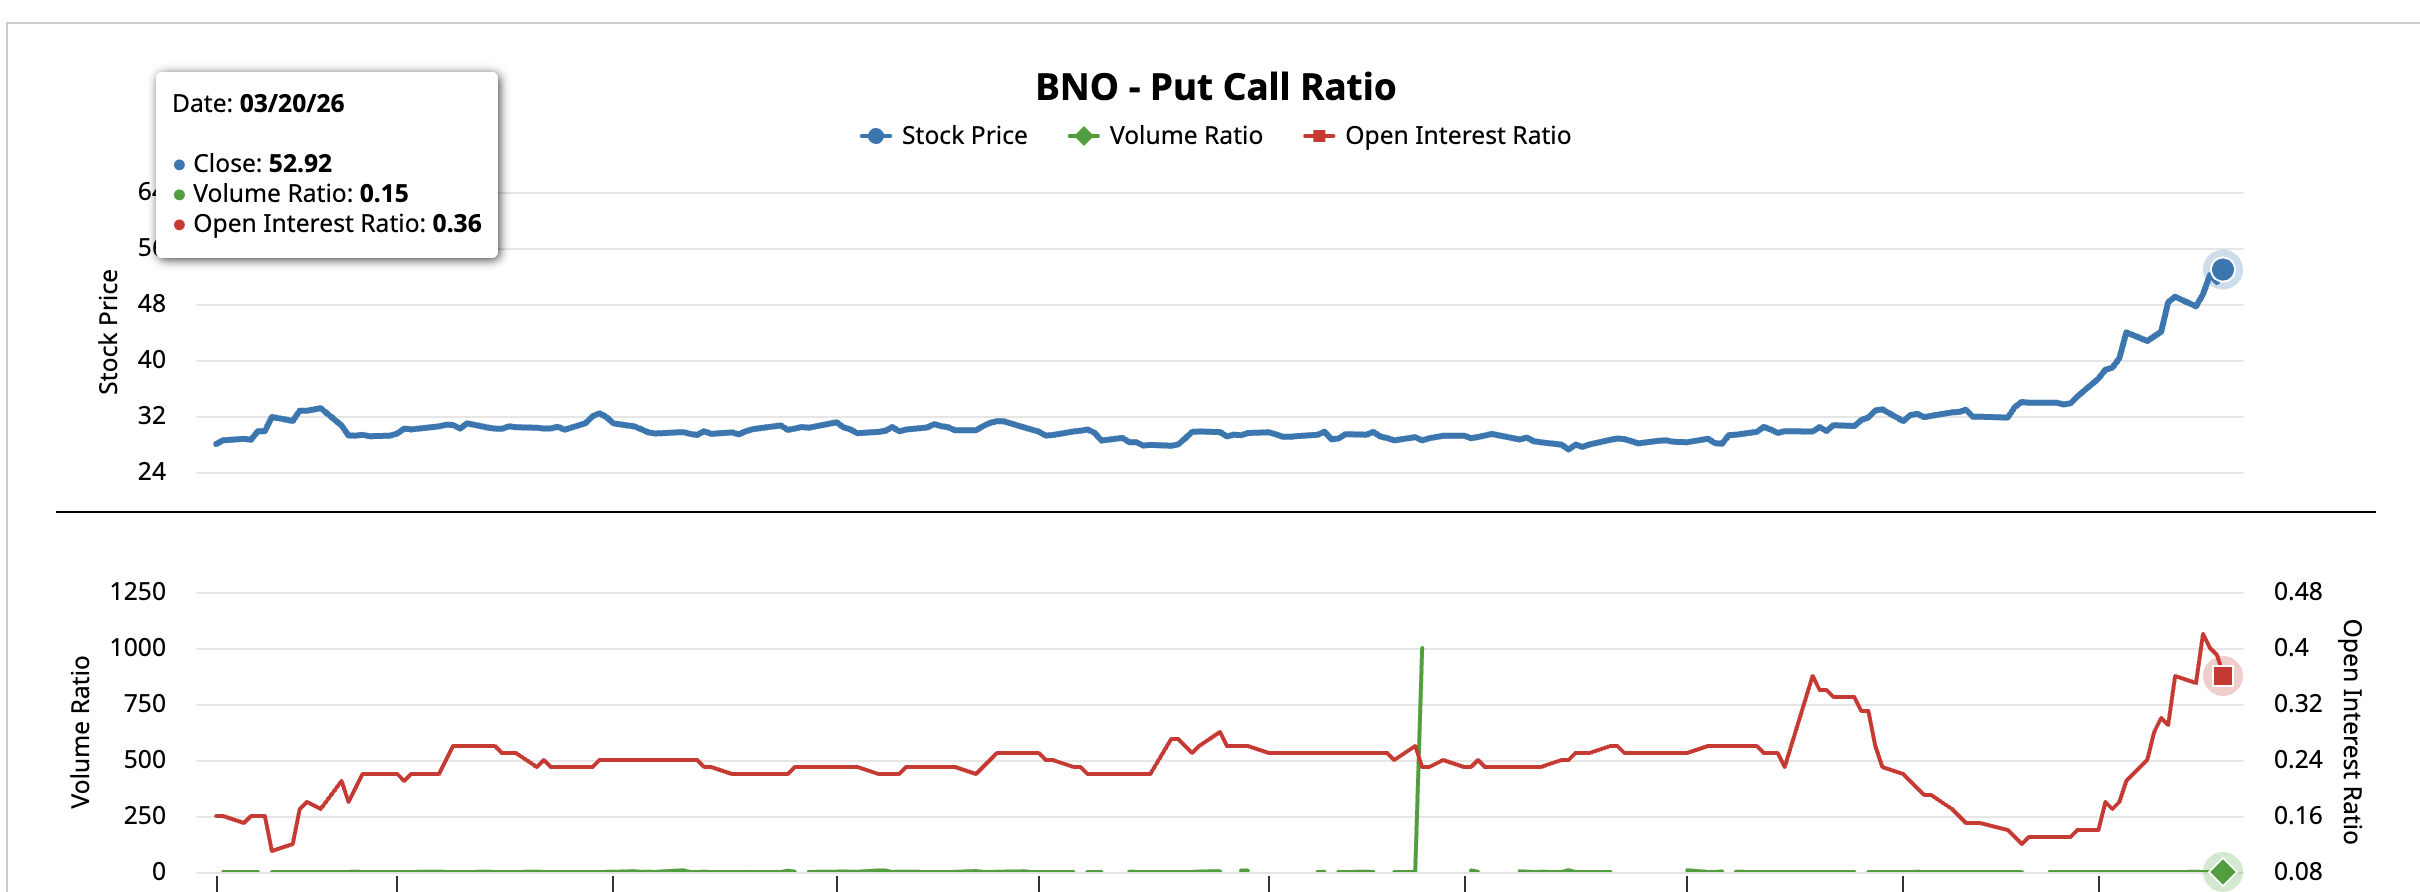
The put-call ratio on the BNO ETF, a proxy for US-listed Brent oil exposure, reinforces the directional bias. As of March 20, the volume ratio stood at 0.15 and the open interest ratio at 0.36. Options traders are positioned for further upside rather than hedging against a reversal.
However, the macro backdrop introduces a competing risk to the oil price. The 10-year Treasury yield has become the real constraint. At 4.40% and climbing, yields are approaching the 4.50% to 4.60% range that forced a tariff pause earlier in April 2025.
If bond markets continue tightening, the pressure on risk assets and government policy decisions could indirectly cap oil’s upside.
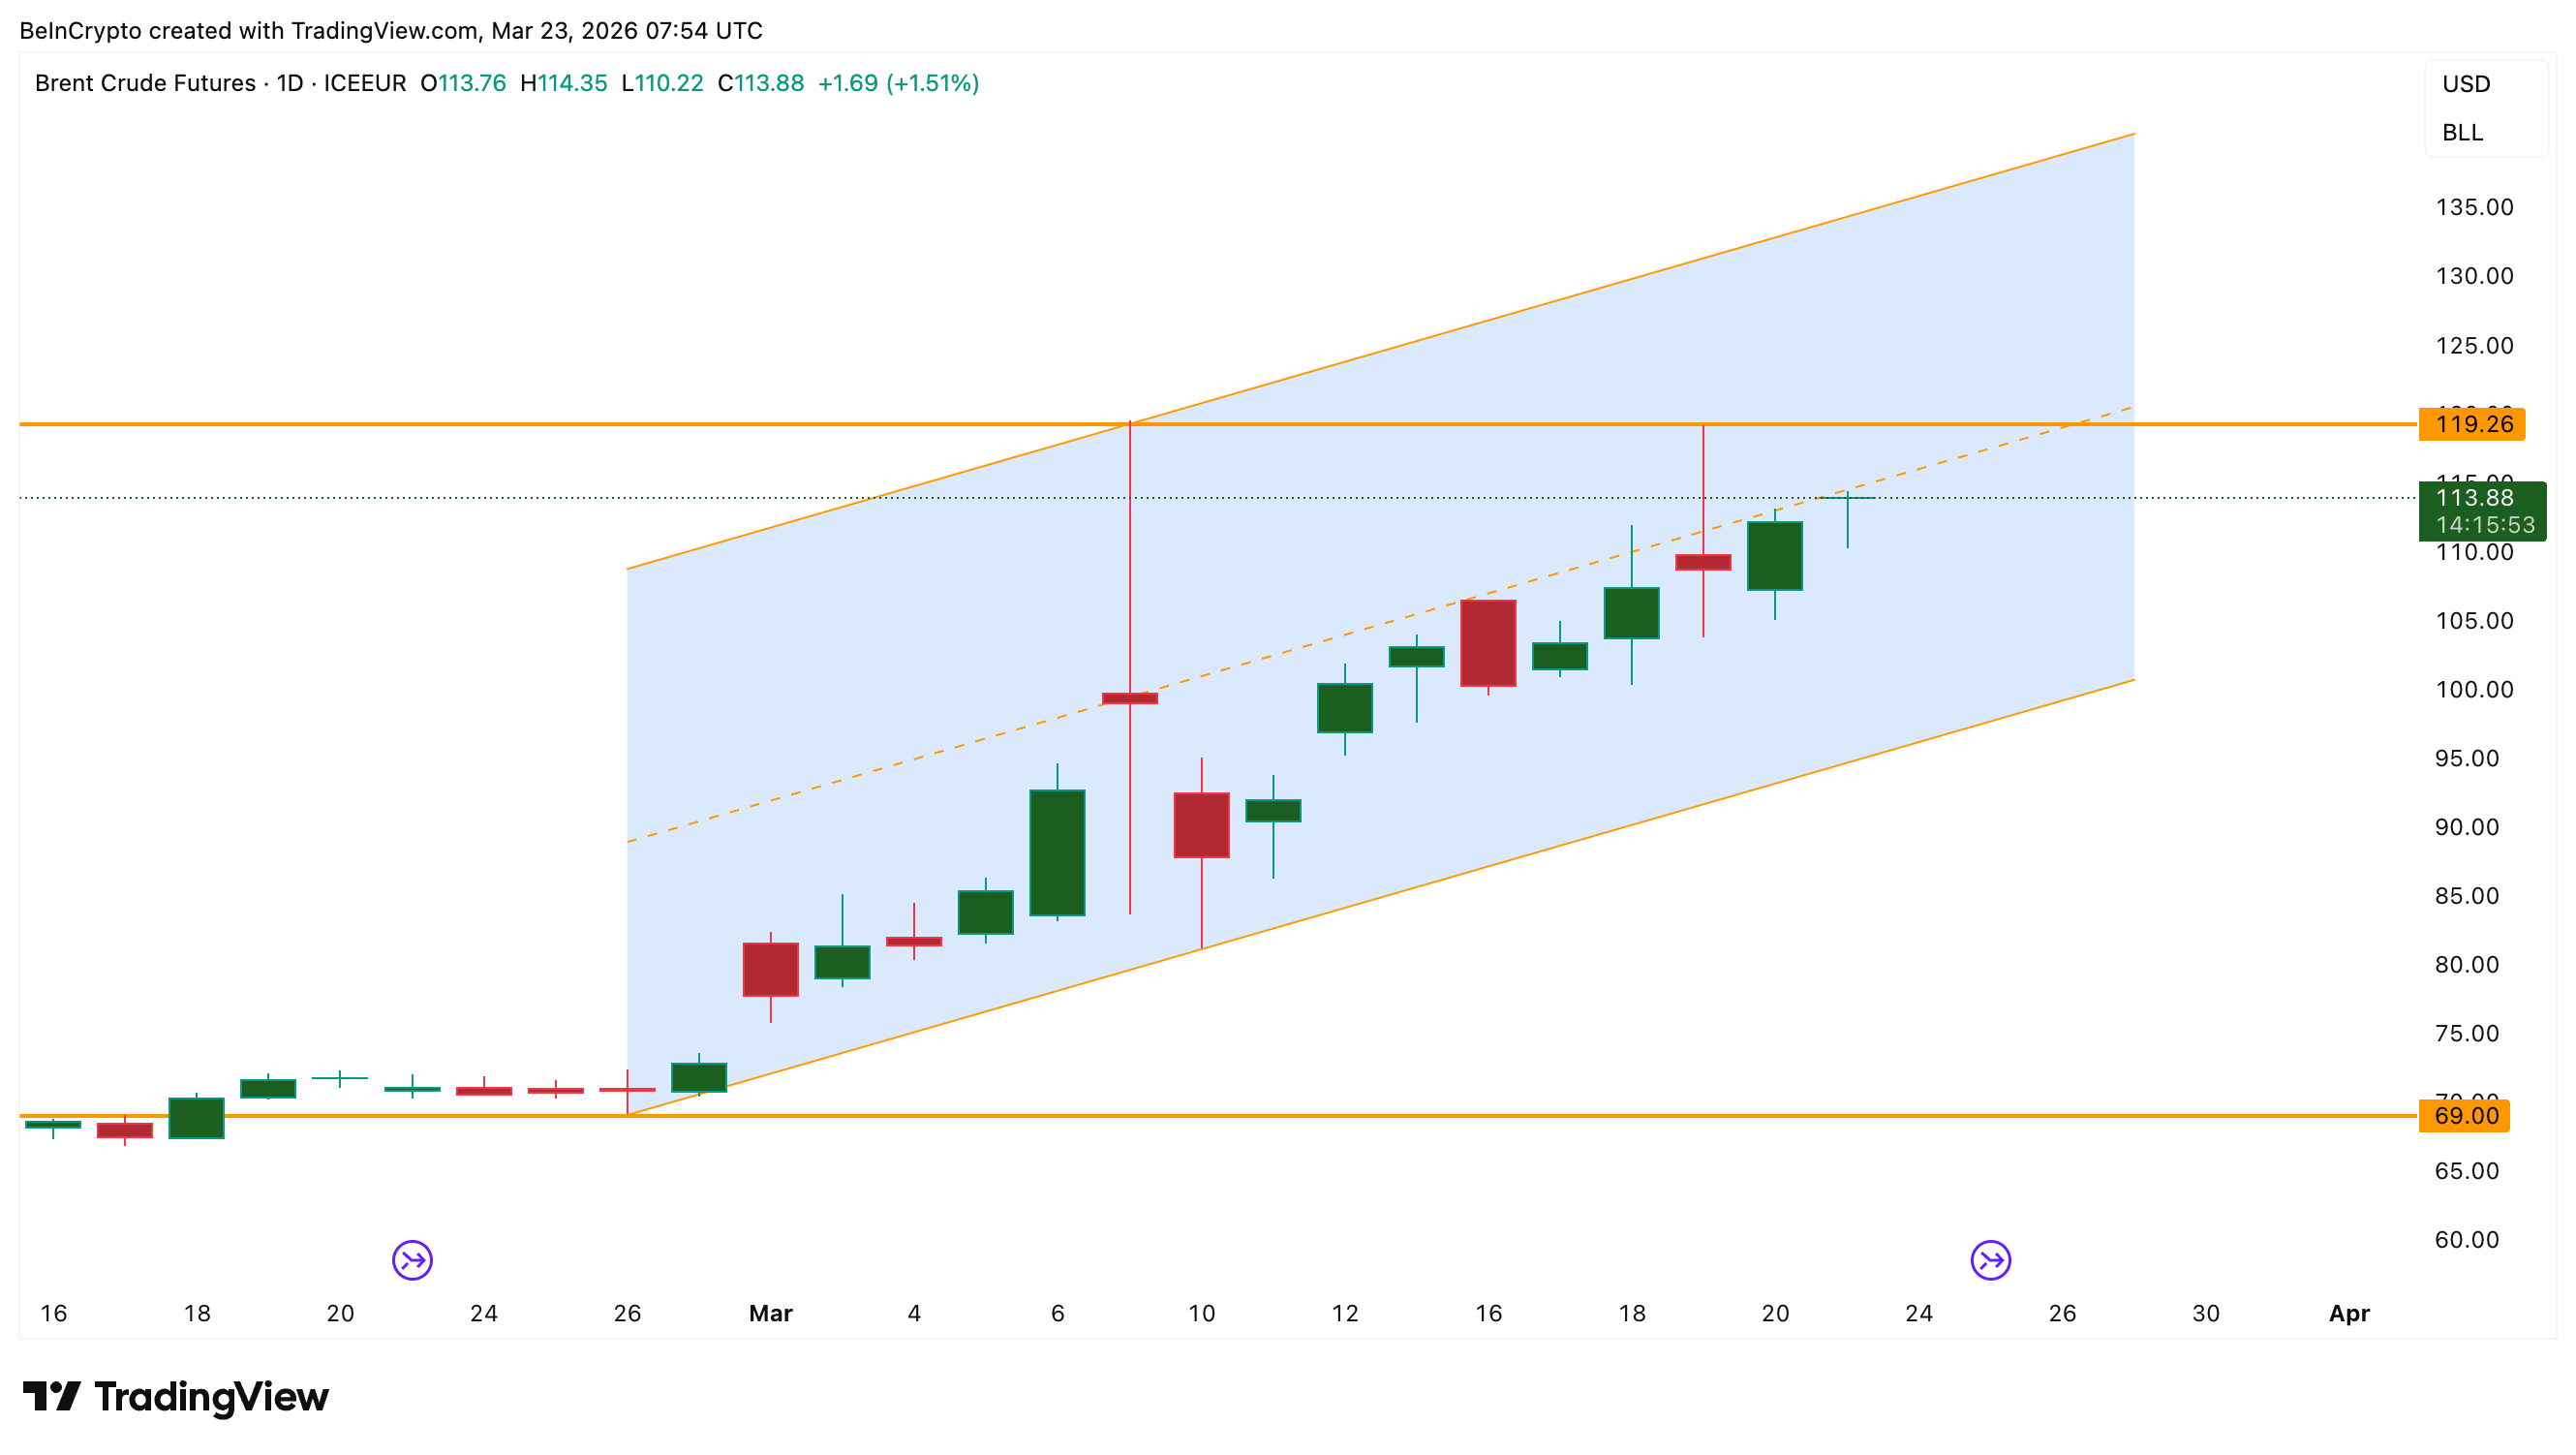
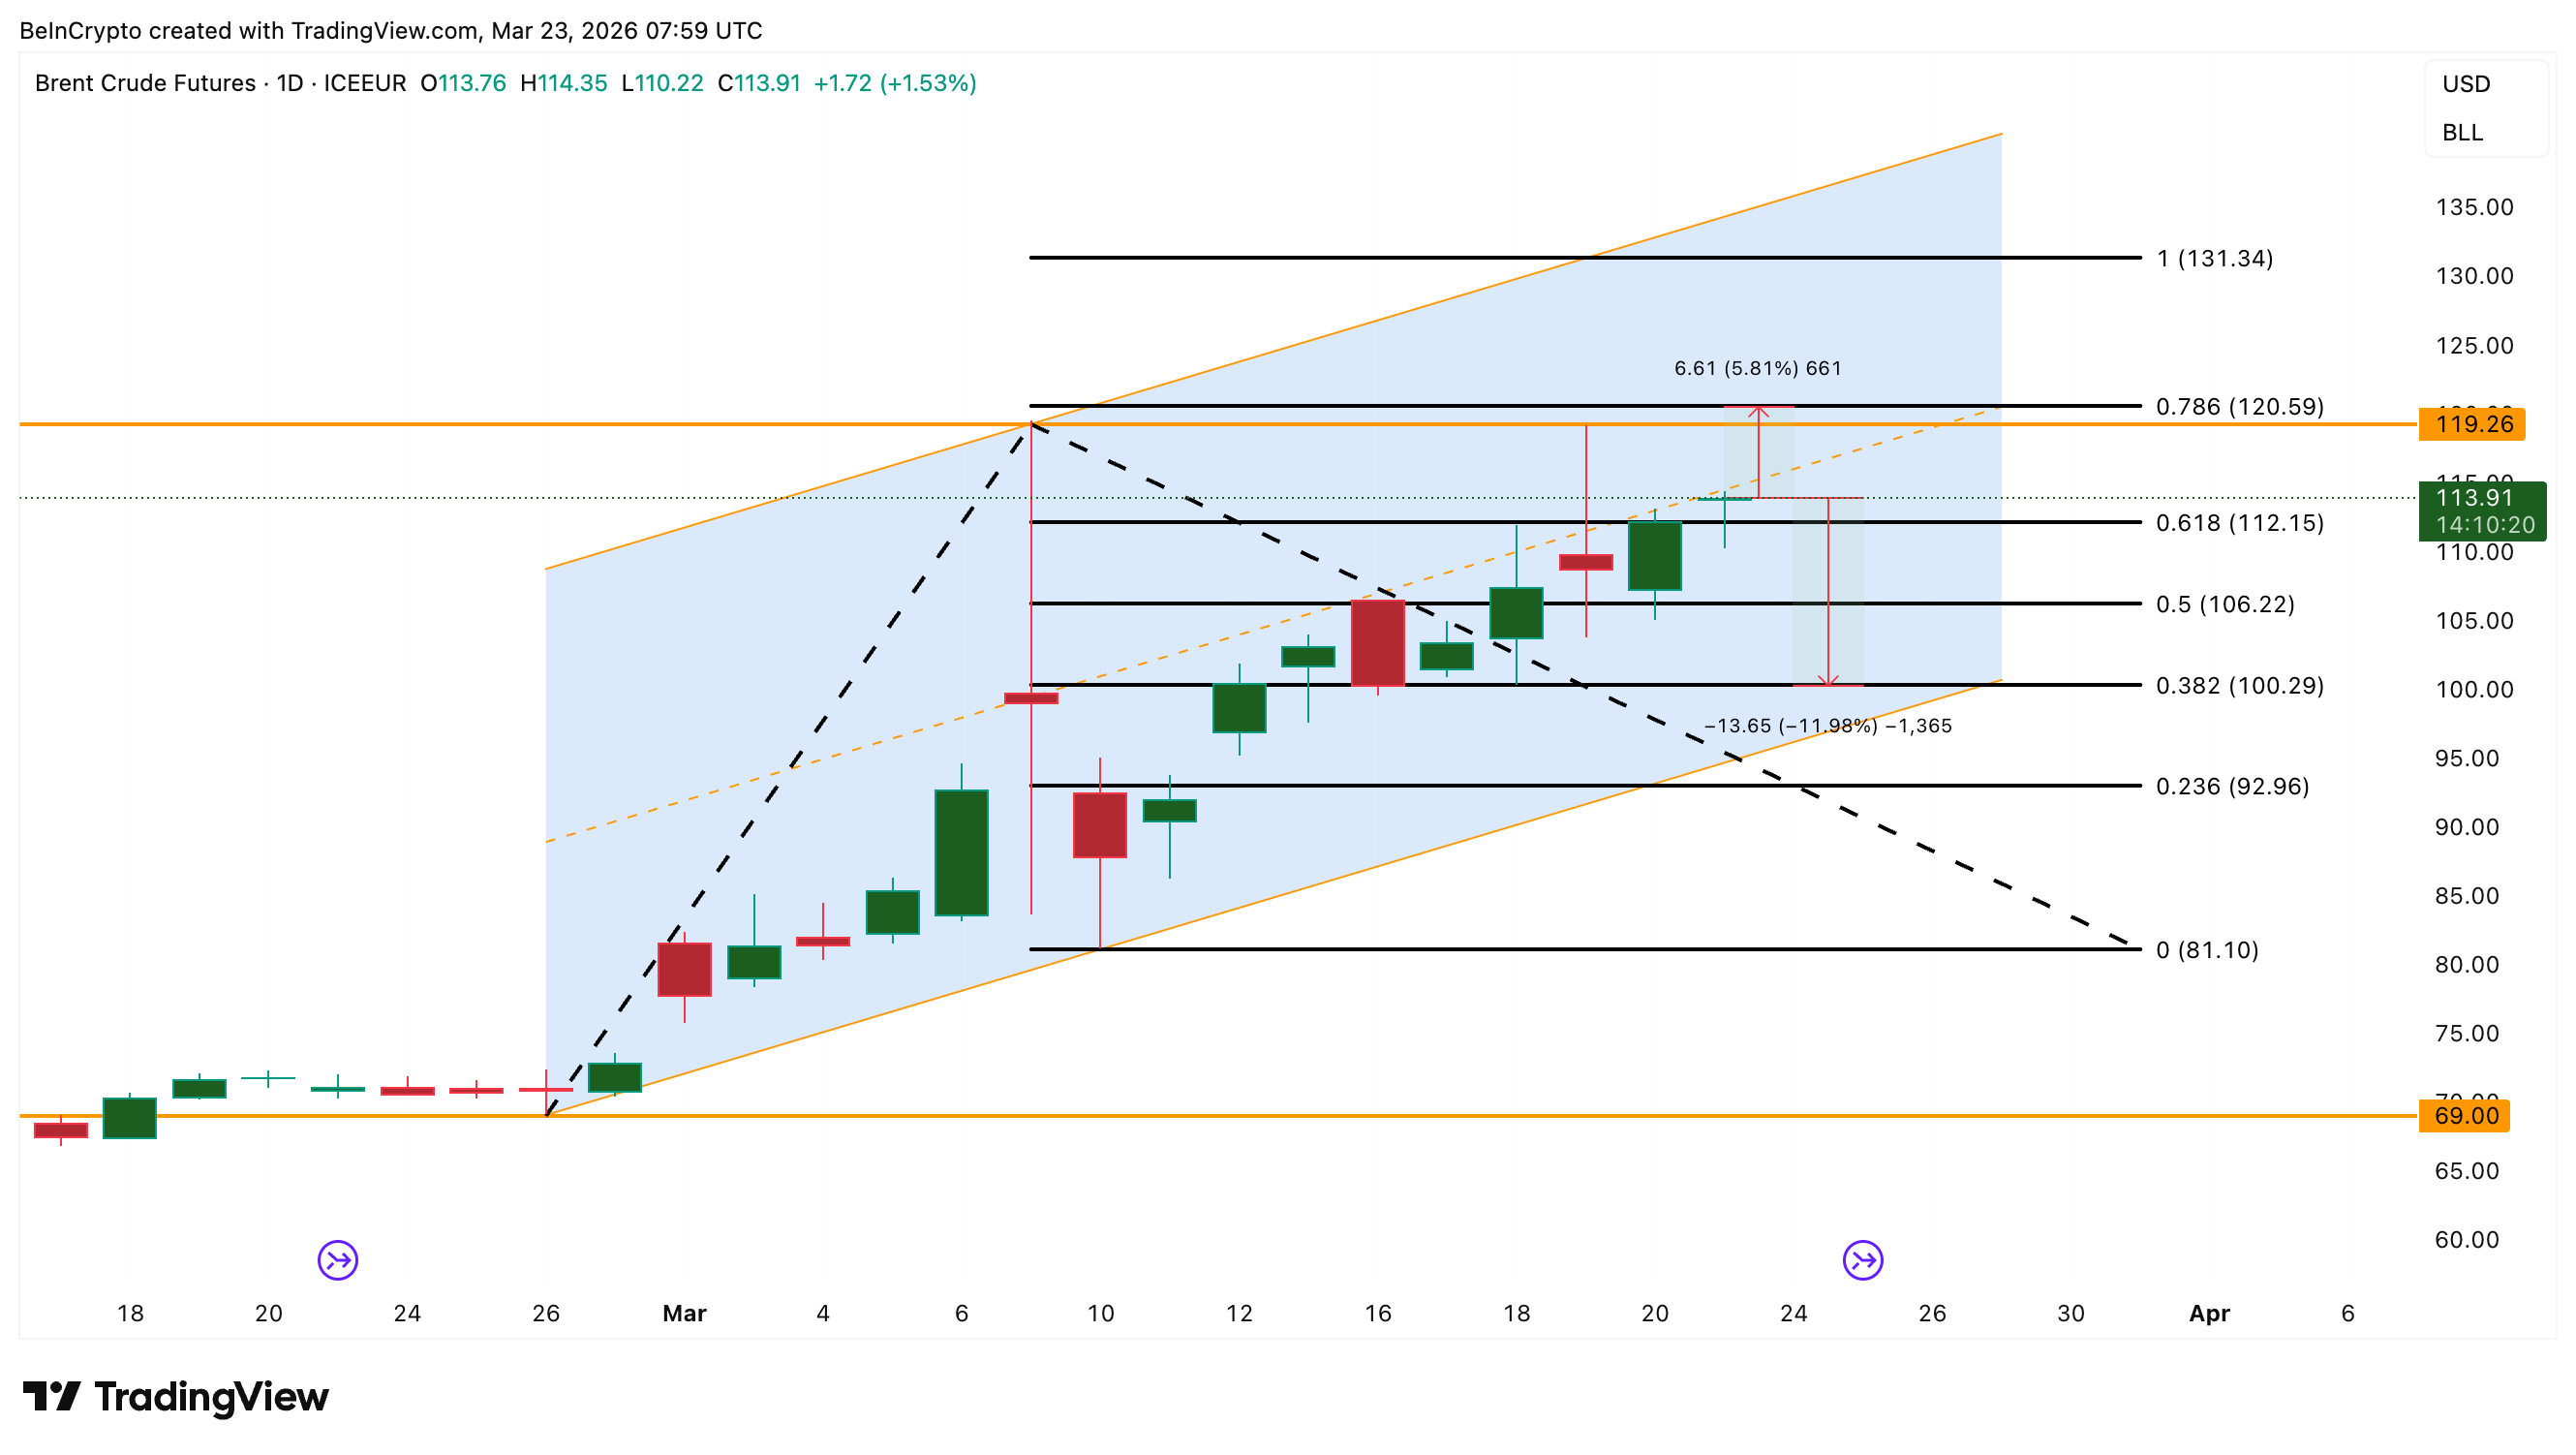
Brent Oil Price Faces a Range-Bound Scenario
The daily chart shows Brent trading inside an ascending channel that has been intact since early February. The $119 to $120 zone has acted as a ceiling on both March 9 and March 19. A break above $120 opens a path toward $131, though that would likely require a further escalation in the Strait of Hormuz situation. And the bond market pressure needs to ease.
The more probable scenario, given the healthy OECI reading, sustained backwardation, and bullish options positioning, is a range-bound move between $106 and $120. A break below $106 opens a path toward $100.
The OECI at 0.44, backwardation above $3.63, and a put-call ratio below 0.36 all support the uptrend. But with open interest halved and the 10-year yield approaching the danger zone, the oil price rally is running on thinner participation than the chart suggests.
Currently, $106 on the lower trendline separates a healthy ascending channel from a correction that could test $100 and even $92.
* The content presented above, whether from a third party or not, is considered as general advice only. This article should not be construed as containing investment advice, investment recommendations, an offer of or solicitation for any transactions in financial instruments.


