

Bitcoin Price Forecast: BTC rebound driven by fading selling pressure as demand remains subdued
- Bitcoin extends its recovery, trading above $66,500 on Tuesday, marking four consecutive days of green candlesticks.
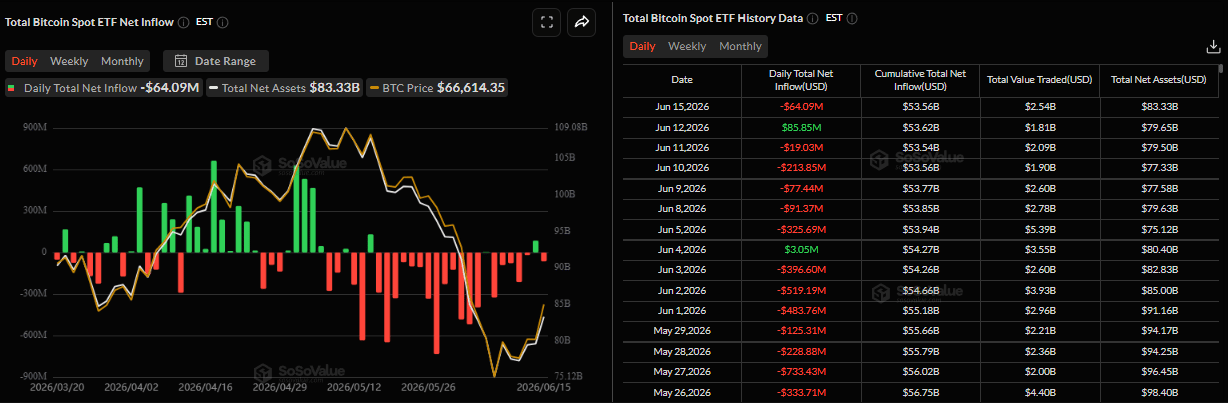
- US-listed ETF recorded a mild outflow of $64.08 million on Monday, while Strategy added 1,587 BTC to its reserves.
- Report highlights that BTC is staging a tentative relief bounce from deeply oversold conditions, suggesting stabilization rather than a trend reversal.
Bitcoin (BTC) extends its recovery, trading above $66,500 as of Tuesday, marking four consecutive daily gains since the weekend. Institutional selling continues as spot Exchange Traded Funds (ETFs) recorded a mild outflow on Monday; however, the pace of withdrawals has slowed compared with recent weeks. Traders should remain cautious, as Glassnode reported that BTC’s rebound suggests stabilization rather than a trend reversal.
Institutional selling may be easing
Institutional demand began the week on a weak note. SoSoValue data showed that spot Bitcoin ETFs recorded outflows of $64.09 million on Monday. While the flows remained negative, the pace of selling was lower than the heavy outflows seen in recent weeks, suggesting that selling pressure may be easing. However, traders should be cautious, as a sustained recovery in BTC would require these flows to turn positive and strengthen in the coming days.
On the corporate front, Michael Saylor announced on Monday that his firm Strategy has acquired 1,587 BTC, bringing the total holding to 846,842 BTC. In addition, the firm also increased its USD Reserve by $100 million to $1.1 billion. This highlights the company’s continued conviction in Bitcoin and aggressive accumulation despite the recent BTC price correction.
BTC hints at stabilization rather than a trend reversal
Glassnode reported on Monday that the Crypto King is staging a tentative relief bounce from deeply oversold conditions. Meanwhile, on-chain and derivatives data suggest stabilization rather than a trend reversal.
“The recovery is happening on thin ice,” the report noted.
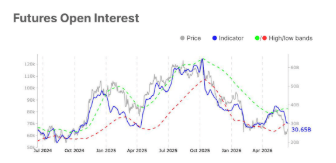
According to Glassnode, spot trading volume has fallen 40.4% to $5.8 billion. In comparison, futures open interest declined another 3% to $30.65 billion, indicating that the recent rebound is largely being driven by short covering rather than fresh buying. Long-side funding payments dropped 22.3%, and spot ETF trading volume fell 38.1% to $11.1 billion, highlighting subdued institutional participation.
“The market is lighter, not healthier,” Glassnode’s analyst added.
The report concluded that the lack of strong spot demand, shrinking derivatives activity, and continued capital outflows suggest BTC is building a consolidation base rather than confirming a trend reversal.
Bitcoin Price Forecast: Extends rebound
Bitcoin trades at $66,600 on Tuesday, extending its recovery since the weekend. However, BTC maintains a bearish bias as price remains well below the 50-day, 100-day, and 200-day Exponential Moving Averages (EMAs) and the previously broken ascending trendline.
Momentum is mixed, with the Relative Strength Index (RSI) on the daily chart hovering near 45 and the Moving Average Convergence Divergence (MACD) positive and above the zero line, hinting that downside pressure is easing but not yet strong enough to overcome the dominant overhead supply.
On the topside, initial resistance is seen at the 50-day EMA near $70,566, followed by the 100-day EMA at $73,246 and the prior rising trendline break zone around $73,641. Beyond that, the 200-day EMA at $79,081 becomes a key medium-term barrier before the stronger horizontal resistance at $84,410.
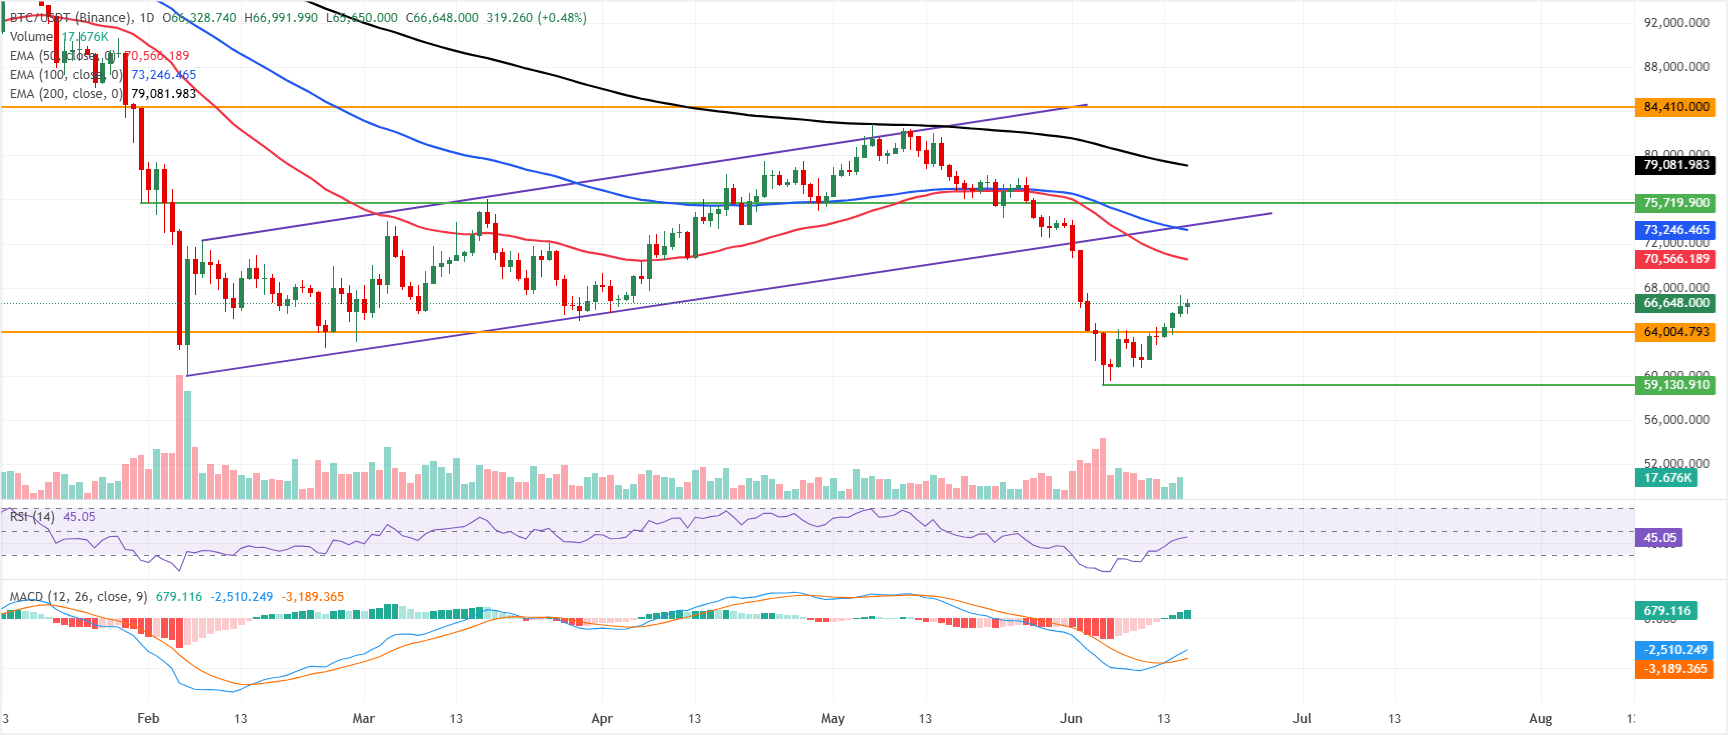
On the downside, the first notable support emerges at the horizontal level near $64,004; a sustained break below this floor would open the door to a deeper corrective phase, while holding above it would keep BTC in a broad consolidation beneath the cluster of daily EMAs.
(The technical analysis of this story was written with the help of an AI tool.)
Bitcoin, altcoins, stablecoins FAQs
Bitcoin is the largest cryptocurrency by market capitalization, a virtual currency designed to serve as money. This form of payment cannot be controlled by any one person, group, or entity, which eliminates the need for third-party participation during financial transactions.
Altcoins are any cryptocurrency apart from Bitcoin, but some also regard Ethereum as a non-altcoin because it is from these two cryptocurrencies that forking happens. If this is true, then Litecoin is the first altcoin, forked from the Bitcoin protocol and, therefore, an “improved” version of it.
Stablecoins are cryptocurrencies designed to have a stable price, with their value backed by a reserve of the asset it represents. To achieve this, the value of any one stablecoin is pegged to a commodity or financial instrument, such as the US Dollar (USD), with its supply regulated by an algorithm or demand. The main goal of stablecoins is to provide an on/off-ramp for investors willing to trade and invest in cryptocurrencies. Stablecoins also allow investors to store value since cryptocurrencies, in general, are subject to volatility.
Bitcoin dominance is the ratio of Bitcoin's market capitalization to the total market capitalization of all cryptocurrencies combined. It provides a clear picture of Bitcoin’s interest among investors. A high BTC dominance typically happens before and during a bull run, in which investors resort to investing in relatively stable and high market capitalization cryptocurrency like Bitcoin. A drop in BTC dominance usually means that investors are moving their capital and/or profits to altcoins in a quest for higher returns, which usually triggers an explosion of altcoin rallies.
Recommended Articles


