

Gold extends recovery above $4,300 with Fed decision, US-Iran deal in focus
- Gold holds above $4,300 as traders await further details on the US-Iran peace framework.
- Lower Oil prices and a weaker US Dollar support Bullion ahead of the Fed's interest rate decision due on Wednesday.
- RSI recovers from oversold territory, but XAU/USD remains below key long-term moving averages.
Gold (XAU/USD) holds above the $4,300 mark on Tuesday as traders await further details on the peace framework between the United States (US) and Iran. At the time of writing, XAU/USD trades around $4,340, up 0.70% on the day
Iran's Foreign Minister Abbas Araghchi warned that any Israeli attack on Lebanon or continued occupation of its territory would constitute a violation of the interim agreement with the US.
Araghchi also said a new round of US-Iran talks will begin on Friday. The discussions will cover Iran's nuclear program, sanctions relief and the release of frozen Iranian assets.
US President Donald Trump said he considers the Lebanon war a "minor" conflict and that the Iran deal can survive. However, Trump reiterated that "all hell will break out" if Iran attempts to obtain a nuclear weapon.
A weaker US Dollar (USD) and easing Oil prices are helping the metal stay on the front foot for a fourth consecutive trading day. Still, it lacks follow-through buying as investors remain reluctant to place aggressive bets until the final agreement is formally signed on Friday.
The pullback in Oil prices has calmed inflation fears after surging energy costs drove global inflation higher in recent months. In turn, it could ease pressure on major central banks, particularly the Federal Reserve (Fed), to keep interest rates higher for longer.
As a non-yielding asset, Gold typically performs well when interest rates are lower. With that in mind, traders are now turning their attention to the Fed's monetary policy announcement on Wednesday.
While the Fed is widely expected to leave interest rates unchanged, any hawkish signals could weigh on Gold, especially with inflation running well above the central bank's 2% target.
Christopher Wong at OCBC noted that "for Gold to regain stronger upside momentum, a more durable improvement in the external environment is needed and this would include softer Oil prices, yields to ease further and clearer evidence that Fed hawkish repricing has peaked."
Technical analysis: RSI recovers but broader bearish bias remains intact
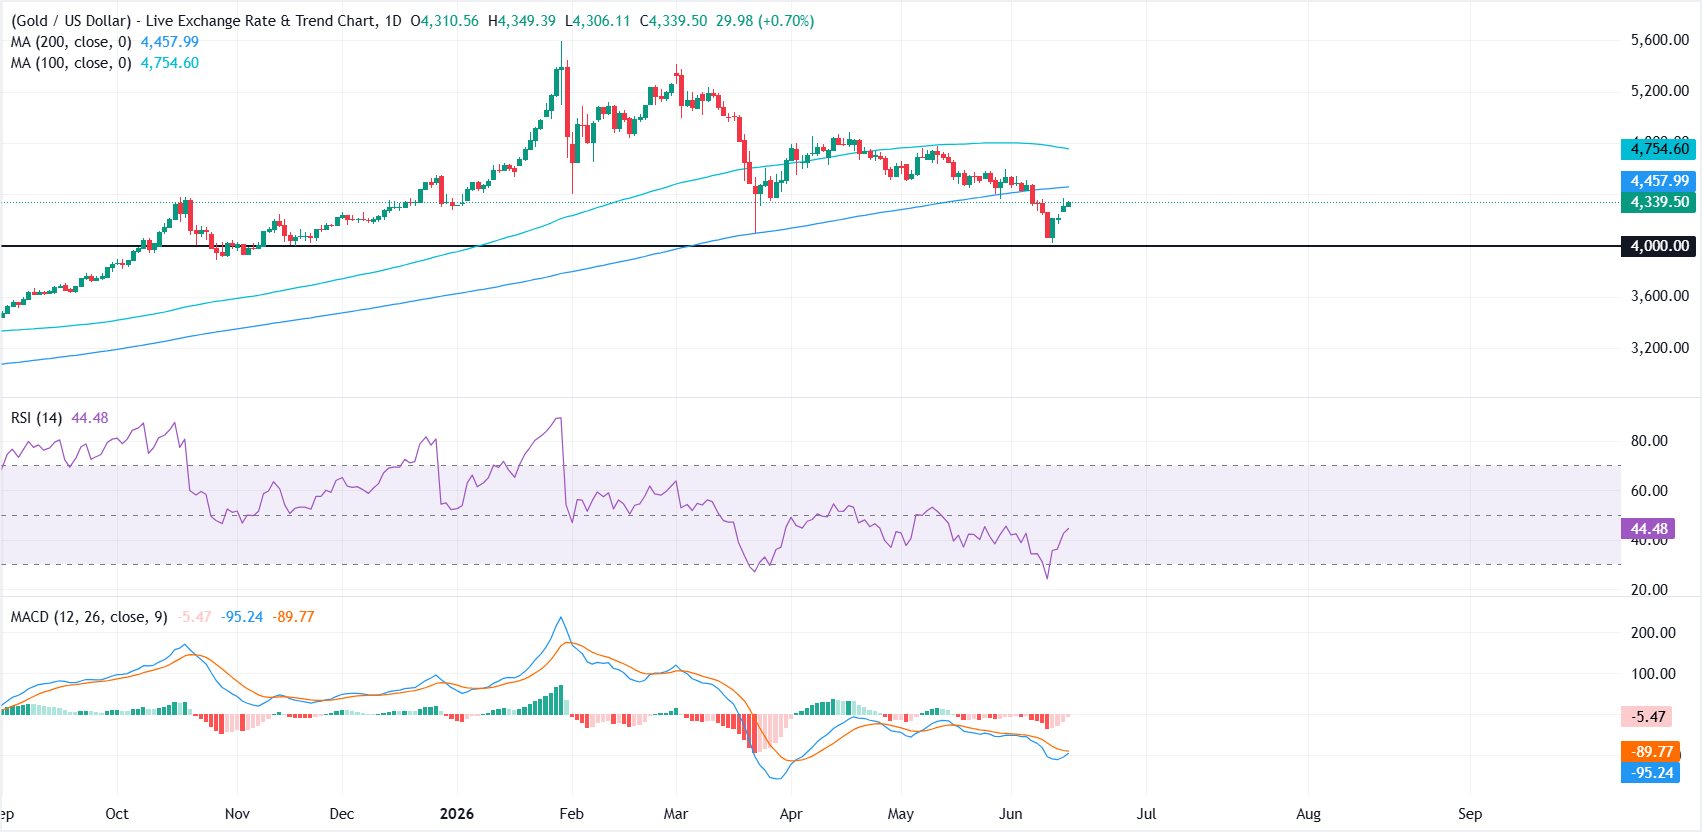
Technically, XAU/USD remains under pressure as it holds below both the 200-day and 100-day Simple Moving Averages (SMAs), keeping the near-term bias bearish despite the recent attempt to stabilize from lower levels.
The Relative Strength Index (RSI) on the daily chart has recovered to 44 but stays below the neutral 50 line, while the Moving Average Convergence Divergence (MACD) histogram remains negative, hinting that downside momentum is easing rather than reversing decisively.
On the topside, initial resistance is located at the 200-day SMA near $4,458, with a stronger barrier higher at the 100-day SMA around $4,755, where the broader bearish structure would start to be challenged on a sustained break.
On the downside, the next notable cushion emerges at the horizontal level near $4,000, where buyers would be expected to show more interest if sellers extend the recent decline.
(The technical analysis of this story was written with the help of an AI tool.)
US Dollar Price Today
The table below shows the percentage change of US Dollar (USD) against listed major currencies today. US Dollar was the strongest against the Canadian Dollar.
| USD | EUR | GBP | JPY | CAD | AUD | NZD | CHF | |
|---|---|---|---|---|---|---|---|---|
| USD | -0.07% | 0.00% | 0.00% | 0.13% | 0.06% | -0.11% | 0.06% | |
| EUR | 0.07% | 0.08% | 0.09% | 0.20% | 0.12% | -0.02% | 0.14% | |
| GBP | -0.00% | -0.08% | 0.00% | 0.13% | 0.04% | -0.09% | 0.07% | |
| JPY | 0.00% | -0.09% | 0.00% | 0.10% | 0.03% | -0.10% | 0.07% | |
| CAD | -0.13% | -0.20% | -0.13% | -0.10% | -0.07% | -0.22% | -0.06% | |
| AUD | -0.06% | -0.12% | -0.04% | -0.03% | 0.07% | -0.12% | 0.03% | |
| NZD | 0.11% | 0.02% | 0.09% | 0.10% | 0.22% | 0.12% | 0.16% | |
| CHF | -0.06% | -0.14% | -0.07% | -0.07% | 0.06% | -0.03% | -0.16% |
The heat map shows percentage changes of major currencies against each other. The base currency is picked from the left column, while the quote currency is picked from the top row. For example, if you pick the US Dollar from the left column and move along the horizontal line to the Japanese Yen, the percentage change displayed in the box will represent USD (base)/JPY (quote).
Recommended Articles


