
Bitcoin Price Forecast: BTC braces for volatility as perpetual futures open interest surges ahead of US PPI
- Bitcoin price edges higher on Wednesday, nearing a key resistance level at $112,800.
- Traders wait for fresh volatility following the upcoming release of the US Producer Price Index data.
- Calm spot markets contrast with surging leverage in perpetual futures, setting the stage for a sharp breakout.
Bitcoin (BTC) trades higher, nearing a key resistance level at $112,800 at the time of writing on Wednesday. A decisive close above this level would signal a potential rally ahead. The upcoming release of the US Producer Price Index (PPI) data for August, later in the day, could bring fresh volatility to the largest cryptocurrency by market capitalization.
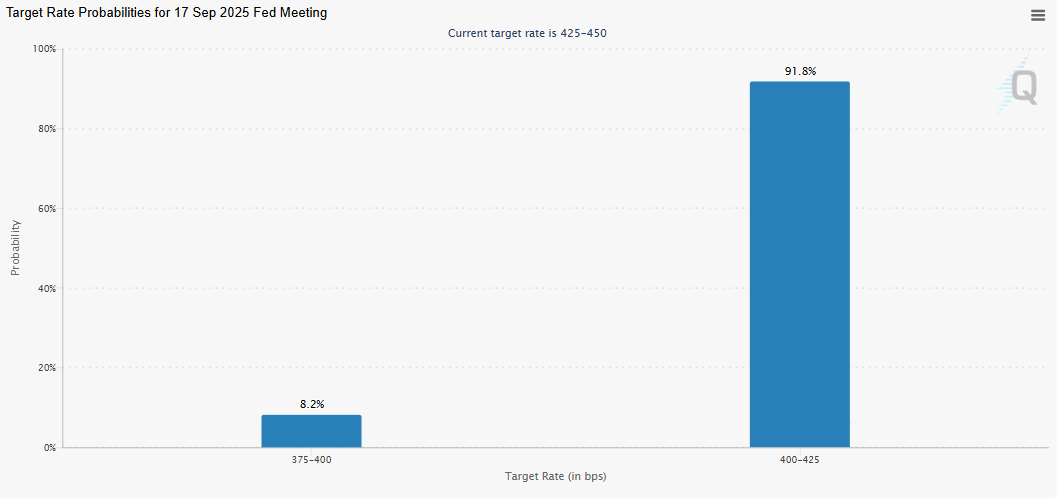
Mild chances of a 50-bps Fed rate cut in September
Bitcoin has experienced a decline in bearish pressure so far this week, with BTC creating higher lows since Sunday, and trading above $112,000 during the early European trading session on Wednesday.
An unexpectedly weak US employment report released on Friday provided further evidence of a softening labor market, leading markets to price in three interest rate cuts by the US Federal Reserve (Fed) through the end of the year. Additionally, the US Bureau of Labor Statistics (BLS) reported on Tuesday that the preliminary revision of the Current Employment Statistics (CES) national benchmark to total Nonfarm employment was -911,000 for the 12-month period through March 2025, or -0.6% fewer jobs than initially reported.
The CME Group FedWatch tool shows, apart from a 91.8% possibility of a 25-basis-point (bps) rate cut by the US central bank at September’s meeting, a small possibility of a jumbo 50 bps rate cut. Fed rate cut expectations may weigh on the US Dollar (USD) and boost risk-on sentiment, supporting a recovery in riskier assets, such as BTC.
Moreover, on Tuesday, a federal judge temporarily blocked US President Donald Trump from removing Fed Governor Lisa Cook, easing market concerns about the Fed’s independence.
Traders now look forward to the release of the US Producer Price Index (PPI) for a fresh impetus on Wednesday. The focus will then shift to the US Consumer Price Index (CPI) on Thursday, which will play a key role in influencing the near-term BTC price dynamics and determining the next leg of its directional move.
BTC expects volatility soon
A K33 report on Tuesday highlights that while spot markets remain calm, leverage in perpetual futures is building pressure, setting the stage for a sharp breakout move in either direction.
The chart below shows that the CME BTC futures Open Interest (OI) hovers near yearly lows, while perpetual futures OI has reapproached yearly highs amid low volatility. An abrupt expansion of volatility typically follows periods of tranquil leverage build-ups in perpetual markets.
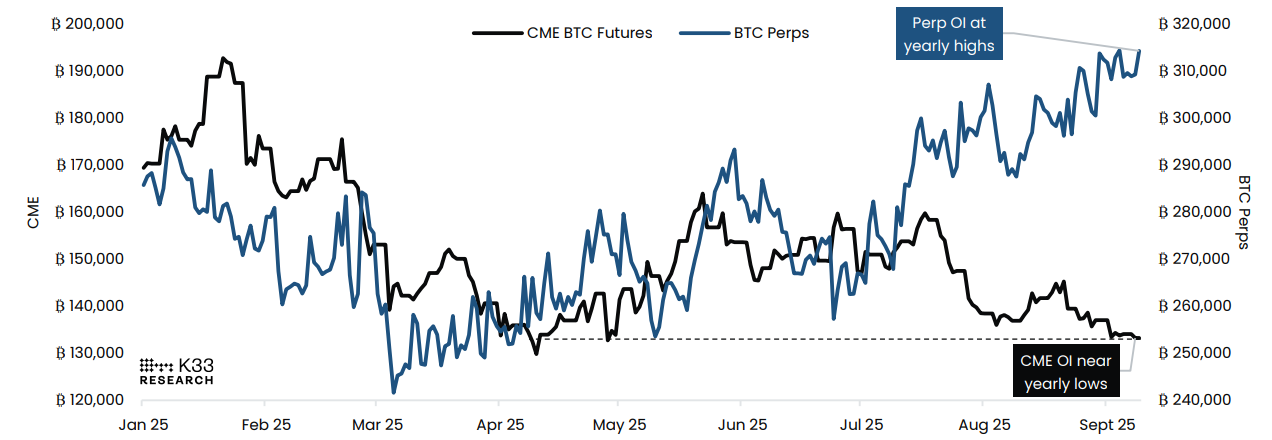
Notional Open Interest, CME BTC Futures vs. Bitcoin Perps chart. Source: K33 Research
This development could trigger “directional squeezes that are more frequent to the downside than the upside, but the current ambiguous funding rate regime opens for squeezes in either direction,” noted the K33 analyst.
The BTC weekly volatility chart has returned to its yearly lows, below 1%, after a week of narrow consolidation. These low levels have been visited on multiple occasions throughout the year. Still, all visits have been short-lived, leading to a significant widening of volatility in the upcoming weeks, which traders should be cautious about.
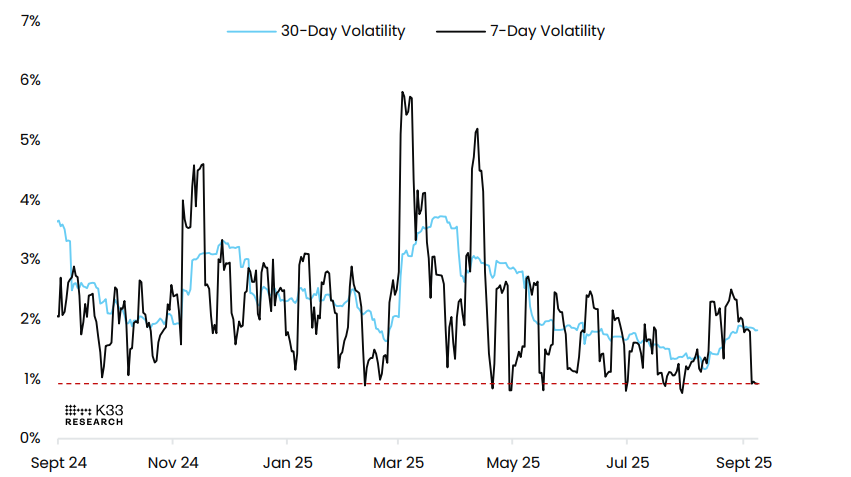
BTC/USD volatility chart. Source: K33 Research
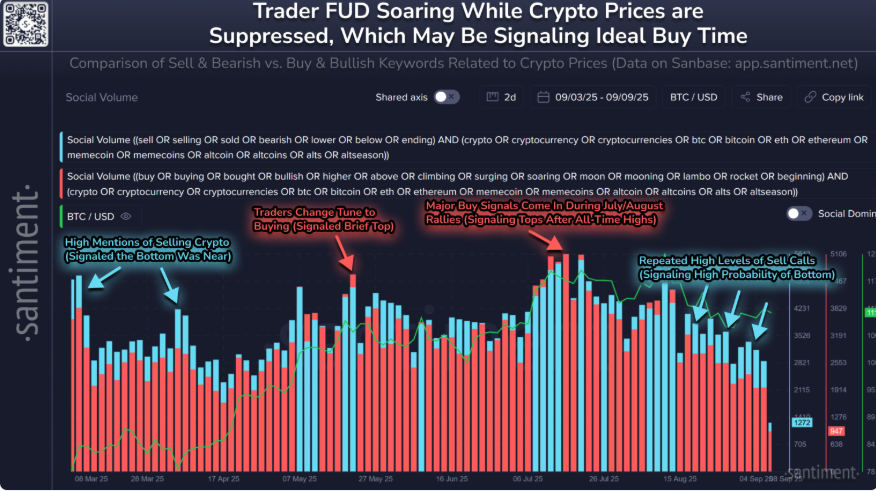
Some signs of optimism
Santiment data below shows that traders’ Fear, Uncertainty, and Doubt (FUD) soars while crypto prices are suppressed, with expectations of Bitcoin falling back below $100,000, Ethereum back below $3,500, and altcoins undergoing a retracement period. Historically, the price has moved in the opposite direction of the crowd’s expectations, highlighting the current condition as a high probability of a bottom.
Bitcoin Price Forecast: BTC could rally if it closes above the 50-day EMA
Bitcoin price extended its recovery on Monday, reaching the 50-day Exponential Moving Average (EMA) at $112,867 the following day, but faced rejection around that level. At the time of writing on Wednesday, BTC hovers near this resistance zone.
If BTC closes above the 50-day EMA at $112,867 on a daily basis, it could extend the rally toward its next daily resistance at $116,000. A successful close above this could extend gains toward its key psychological level at $120,000.
The Relative Strength Index (RSI) is approaching its neutral level of 50 on the daily chart, indicating fading bearish momentum. The Moving Average Convergence Divergence (MACD) indicator showed a bullish crossover on Saturday, providing a buy signal. Moreover, it also shows rising green histogram bars above its neutral level, indicating bullish momentum and an upward trend ahead.
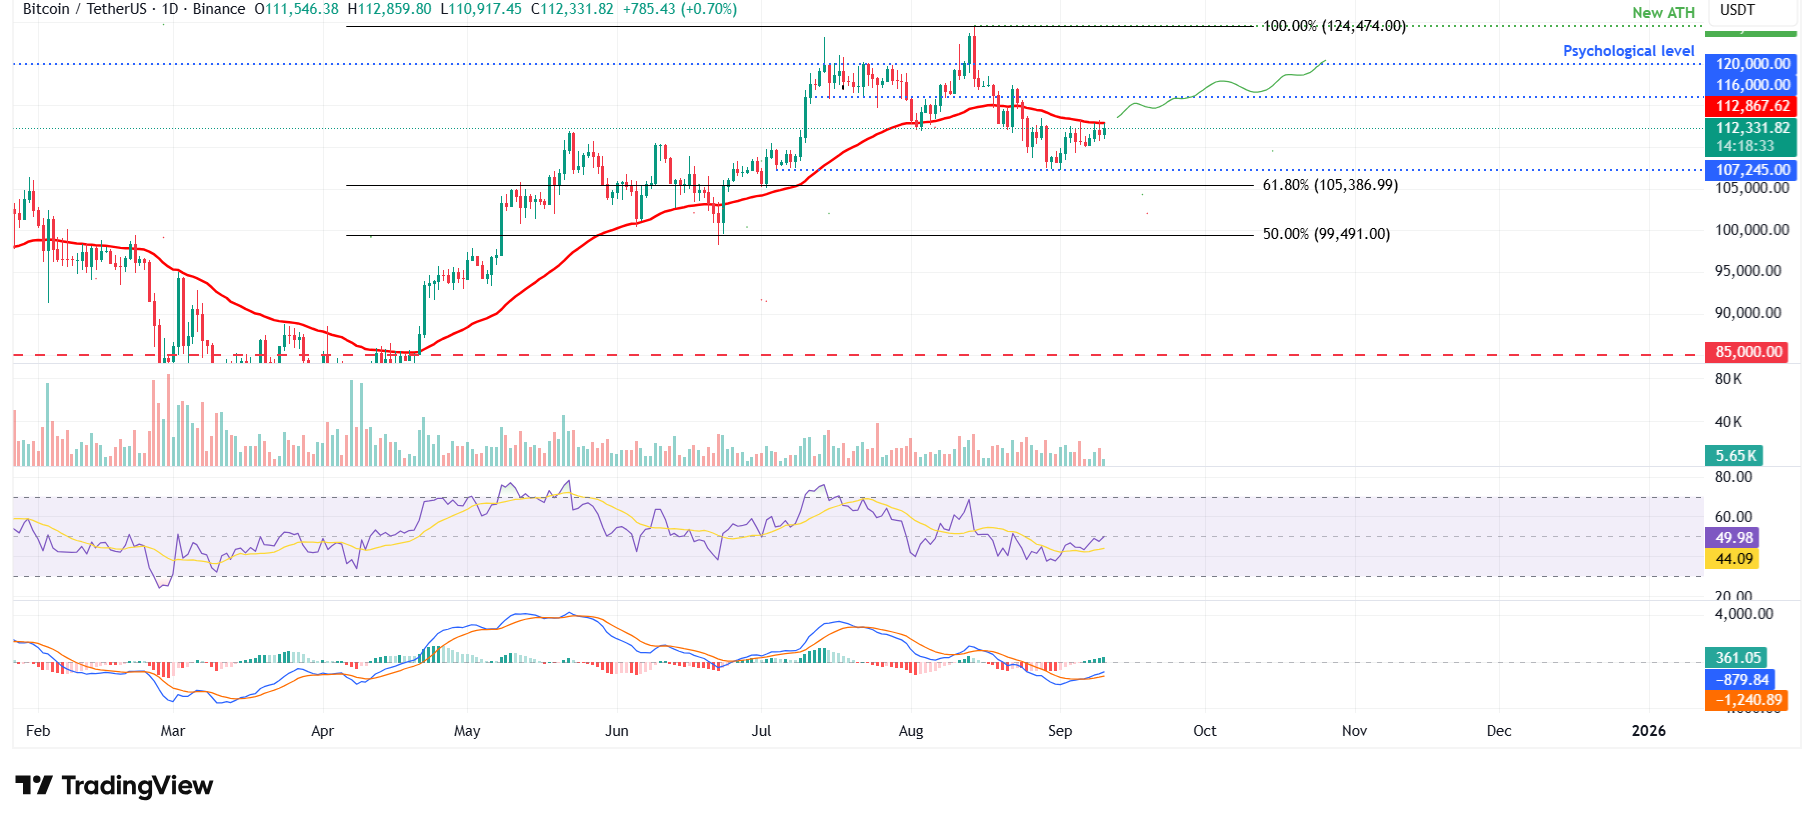
BTC/USDT daily chart
On the contrary, if BTC fails to close above its 50-day EMA at $112,867 and corrects, it could extend the decline toward its daily support at $107,245.
Bitcoin, altcoins, stablecoins FAQs
Bitcoin is the largest cryptocurrency by market capitalization, a virtual currency designed to serve as money. This form of payment cannot be controlled by any one person, group, or entity, which eliminates the need for third-party participation during financial transactions.
Altcoins are any cryptocurrency apart from Bitcoin, but some also regard Ethereum as a non-altcoin because it is from these two cryptocurrencies that forking happens. If this is true, then Litecoin is the first altcoin, forked from the Bitcoin protocol and, therefore, an “improved” version of it.
Stablecoins are cryptocurrencies designed to have a stable price, with their value backed by a reserve of the asset it represents. To achieve this, the value of any one stablecoin is pegged to a commodity or financial instrument, such as the US Dollar (USD), with its supply regulated by an algorithm or demand. The main goal of stablecoins is to provide an on/off-ramp for investors willing to trade and invest in cryptocurrencies. Stablecoins also allow investors to store value since cryptocurrencies, in general, are subject to volatility.
Bitcoin dominance is the ratio of Bitcoin's market capitalization to the total market capitalization of all cryptocurrencies combined. It provides a clear picture of Bitcoin’s interest among investors. A high BTC dominance typically happens before and during a bull run, in which investors resort to investing in relatively stable and high market capitalization cryptocurrency like Bitcoin. A drop in BTC dominance usually means that investors are moving their capital and/or profits to altcoins in a quest for higher returns, which usually triggers an explosion of altcoin rallies.
บทความแนะนำ


