
Dogecoin Price Forecast: DOGE loses steam amid Golden Cross pattern, rising whale holdings
- Dogecoin edges lower by over 4% to retest an important level, risking further losses.
- Large investors holding more than 10 million DOGE tokens collectively own over 122 billion tokens.
- Retail investors holding flatlines above 2 billion DOGE tokens after the offloading spree in June.
Dogecoin (DOGE) edges lower by over 3% at press time on Wednesday as the bullish momentum declines after the 37% gains last week. Large investors with over 10 million DOGE tokens continue their buying spree, accumulating more than 122 million tokens, while the offloading trend among retail investors shows no signs of reversal. However, the technical outlook suggests a short-term volatility spike as Dogecoin struggles at a crucial resistance level.
Large investors' DOGE holding skyrockets
Santiment’s data shows that large investors, popularly known as whales, with over 10 million DOGE, hold 122.59 billion tokens, accounting for 81% of the total circulating supply (150.21 billion) as of Wednesday. It is worth noting that the whale holdings reached an all-time high of 122.69 billion DOGE on Friday.
On the other hand, the holding of retail investors with less than 10,000 DOGE tokens remains flat after the offloading spree between July 15, at 2.47 billion DOGE, and July 3, at 2.37 billion DOGE.
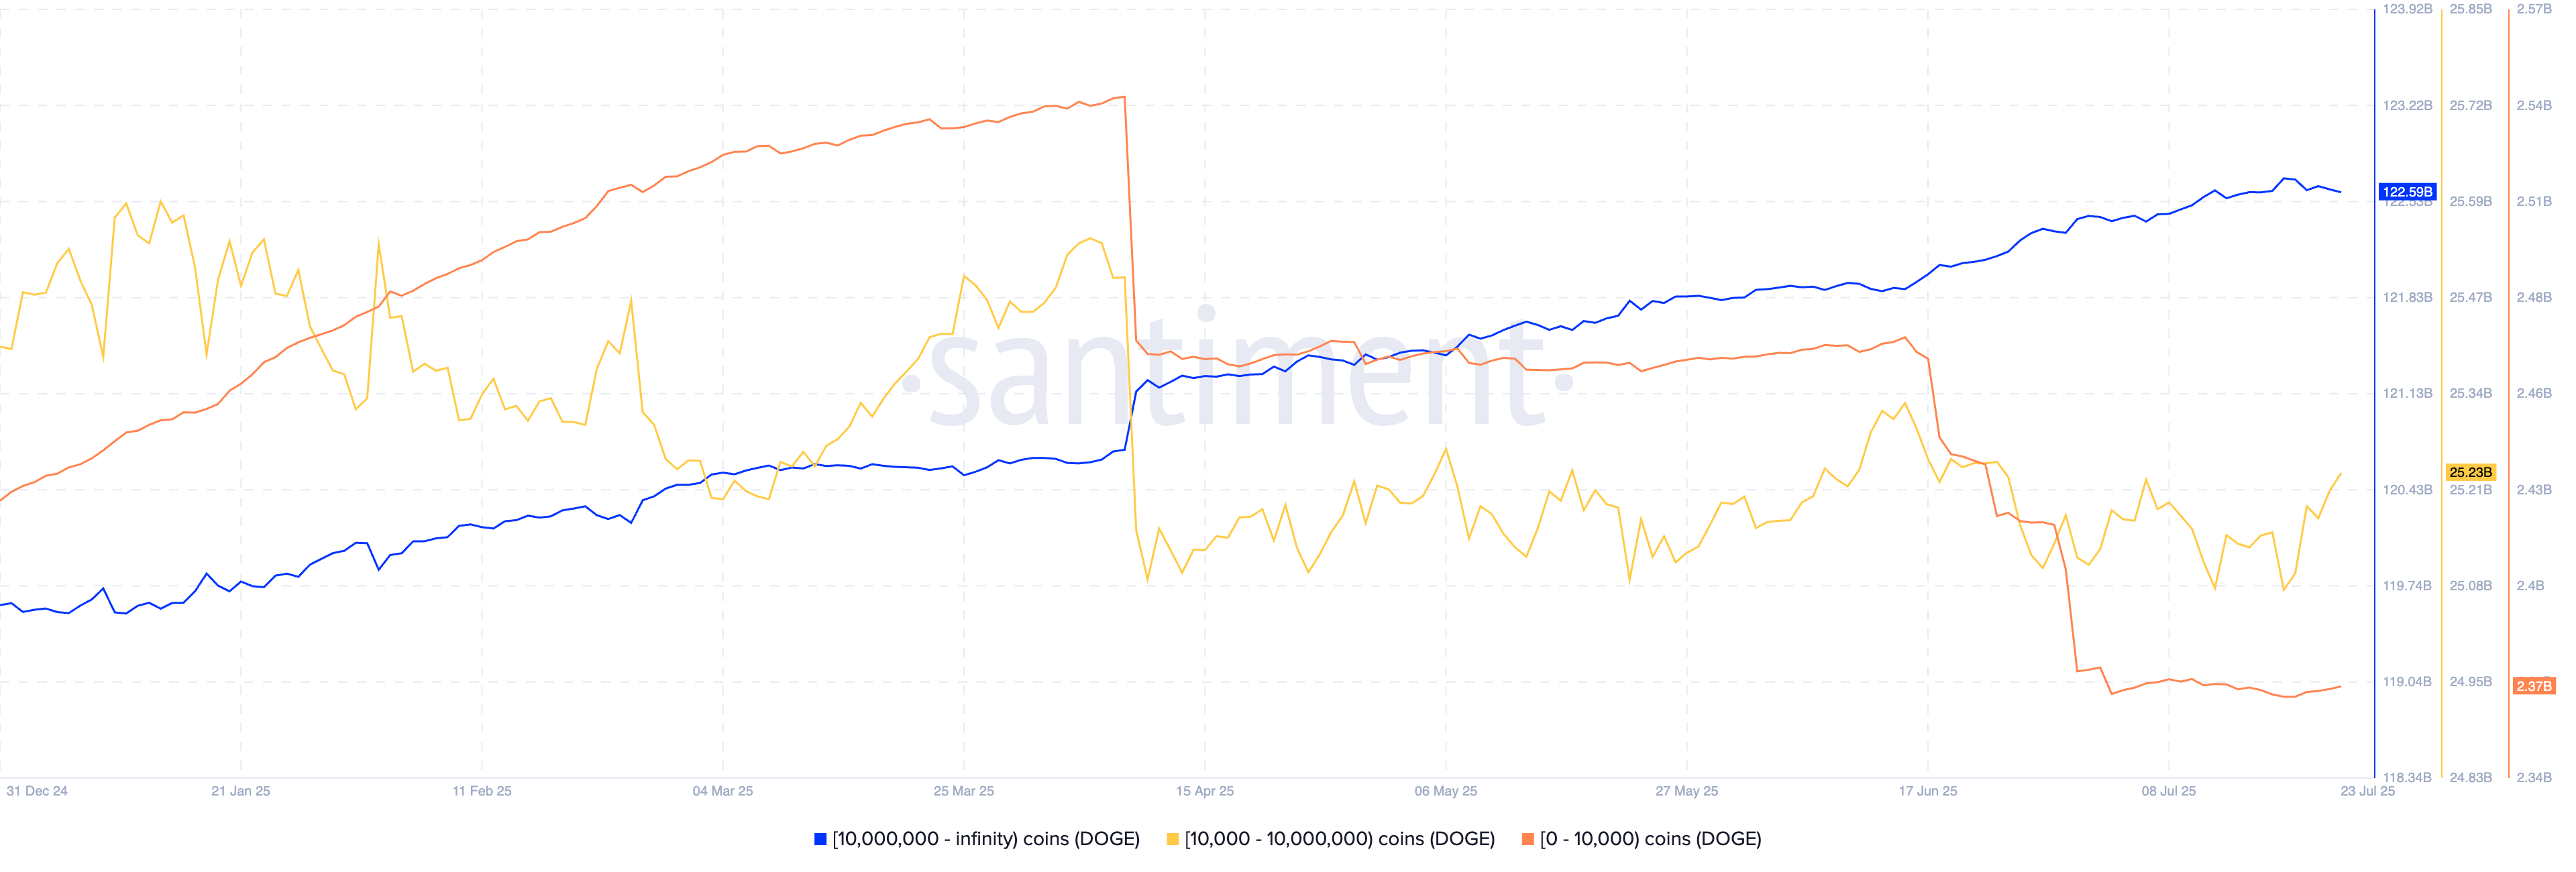
DOGE supply distribution. Source: Santiment
Due to massive control over the circulating supply, large investors are key drivers of the meme coin’s price movement. Furthermore, the retail investors' offloading spree reflects the missed opportunity to capitalize on DOGE’s recent recovery run.
Dogecoin recovery run hits resistance, bulls on back foot
Dogecoin ticks lower by over 4% at press time on Wednesday for the third consecutive day after the bullish failure to cross the $0.2867 resistance on Monday. The declining trend in DOGE retests the $0.2590 level, near the May 11 high at $0.2597, acting as a crucial support level.
A decisive closing below this level could extend the decline towards the $0.2145 support level, last tested on July 15.
The Moving Average Convergence/Divergence (MACD) on the daily chart and its signal line risk restarting a declining trend with a crossover event as the intensity of green histogram bars declines, suggesting a loss in bullish momentum.
The Relative Strength Index (RSI) declines to 82 on the daily chart, suggesting a decrease in buying pressure while the conditions remain overbought.
Still, the 50-day Exponential Moving Average (EMA) crossing above the 100-day EMA highlights a short-term recovery that surpasses the medium-term trend. The rising 50-day EMA inches closer to the 200-day EMA, hinting at a Golden Cross pattern.
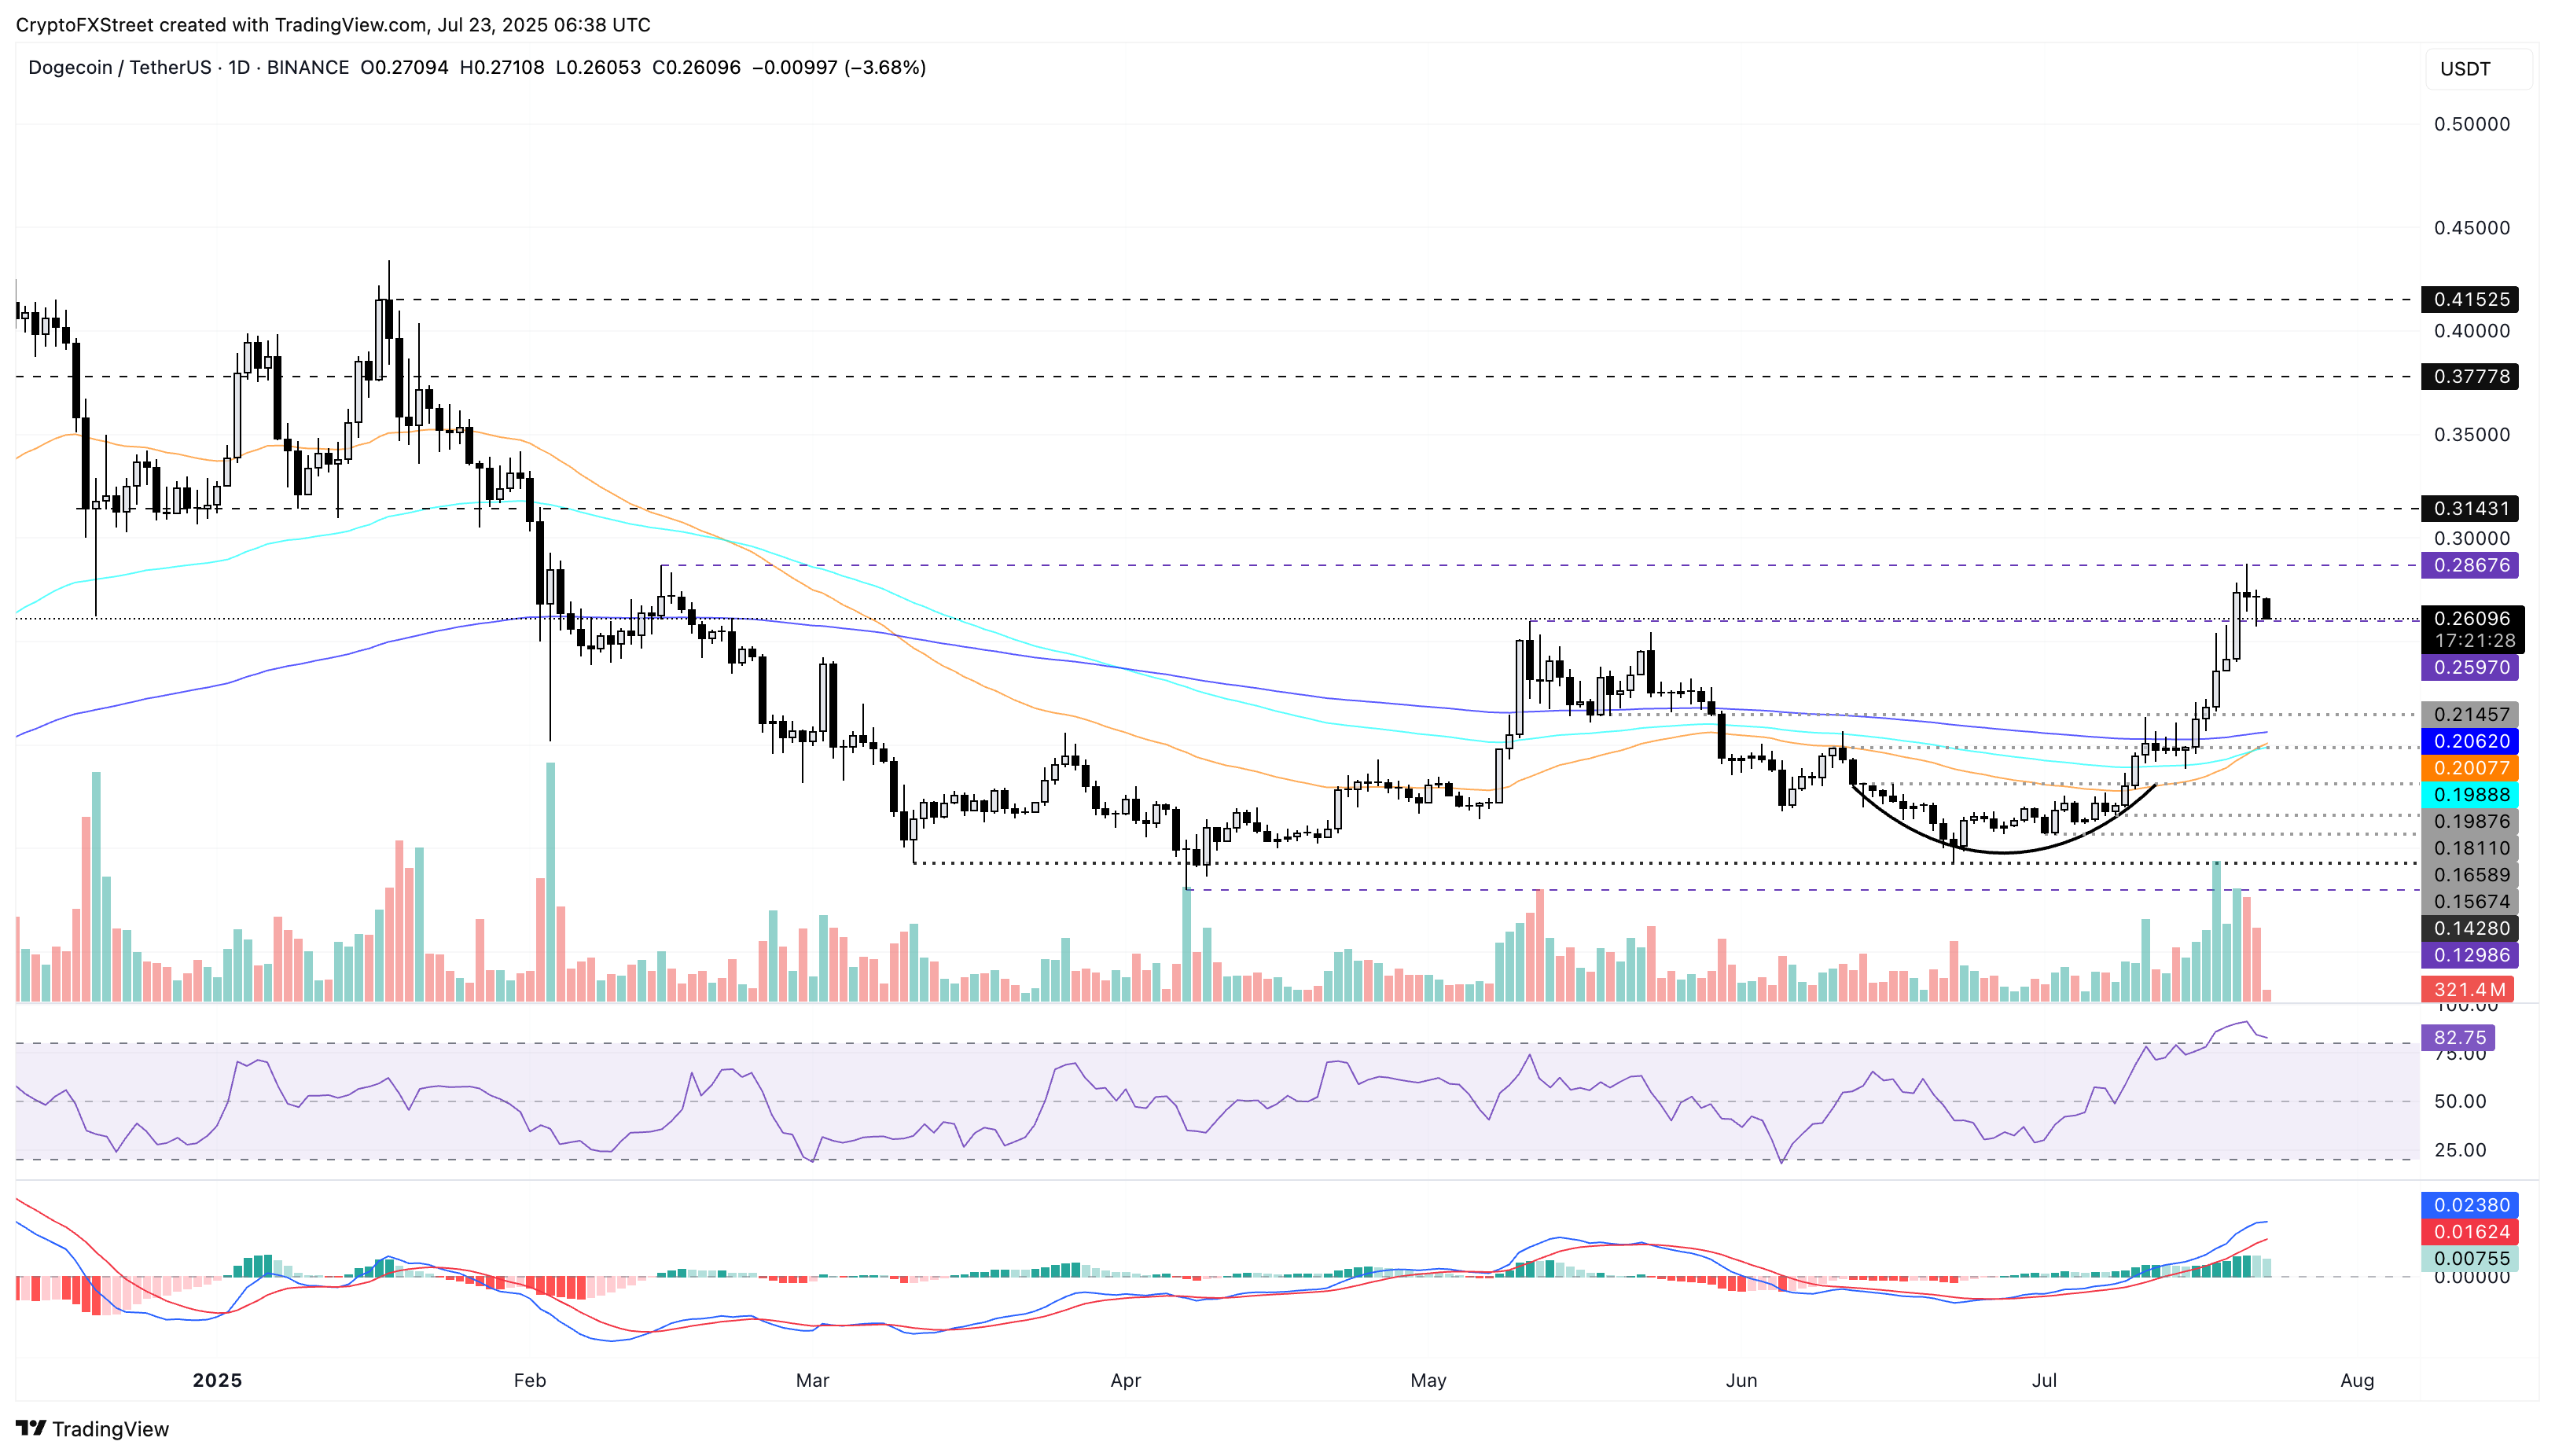
DOGE/USDT daily price chart.
If DOGE exceeds the overhead resistance at $0.2867, the uptrend could stretch towards $0.3143 level, last tested on February 2.
บทความแนะนำ


