Top altcoins Solana and Cardano show bearish signs in momentum indicators

แหล่งที่มา Fxstreet
  • Solana’s price extends its decline on Monday after falling more than 11% in the previous week.
  • Cardano’s price trades in red on Monday after correcting over 11% last week.
  • The MACD indicator shows a bearish crossover in SOL and ADA, suggesting a continuation of the decline.

Top altcoins Solana (SOL) and Cardano (ADA) extend their correction on Monday after declining more than 11% in the previous week. The technical outlook for both altcoins projects a continuation of the pullback, targeting a double-digit crash ahead as the Moving Average Convergence Divergence (MACD) indicator shows a bearish crossover in SOL and ADA.

Solana bears aim for the $155 mark 

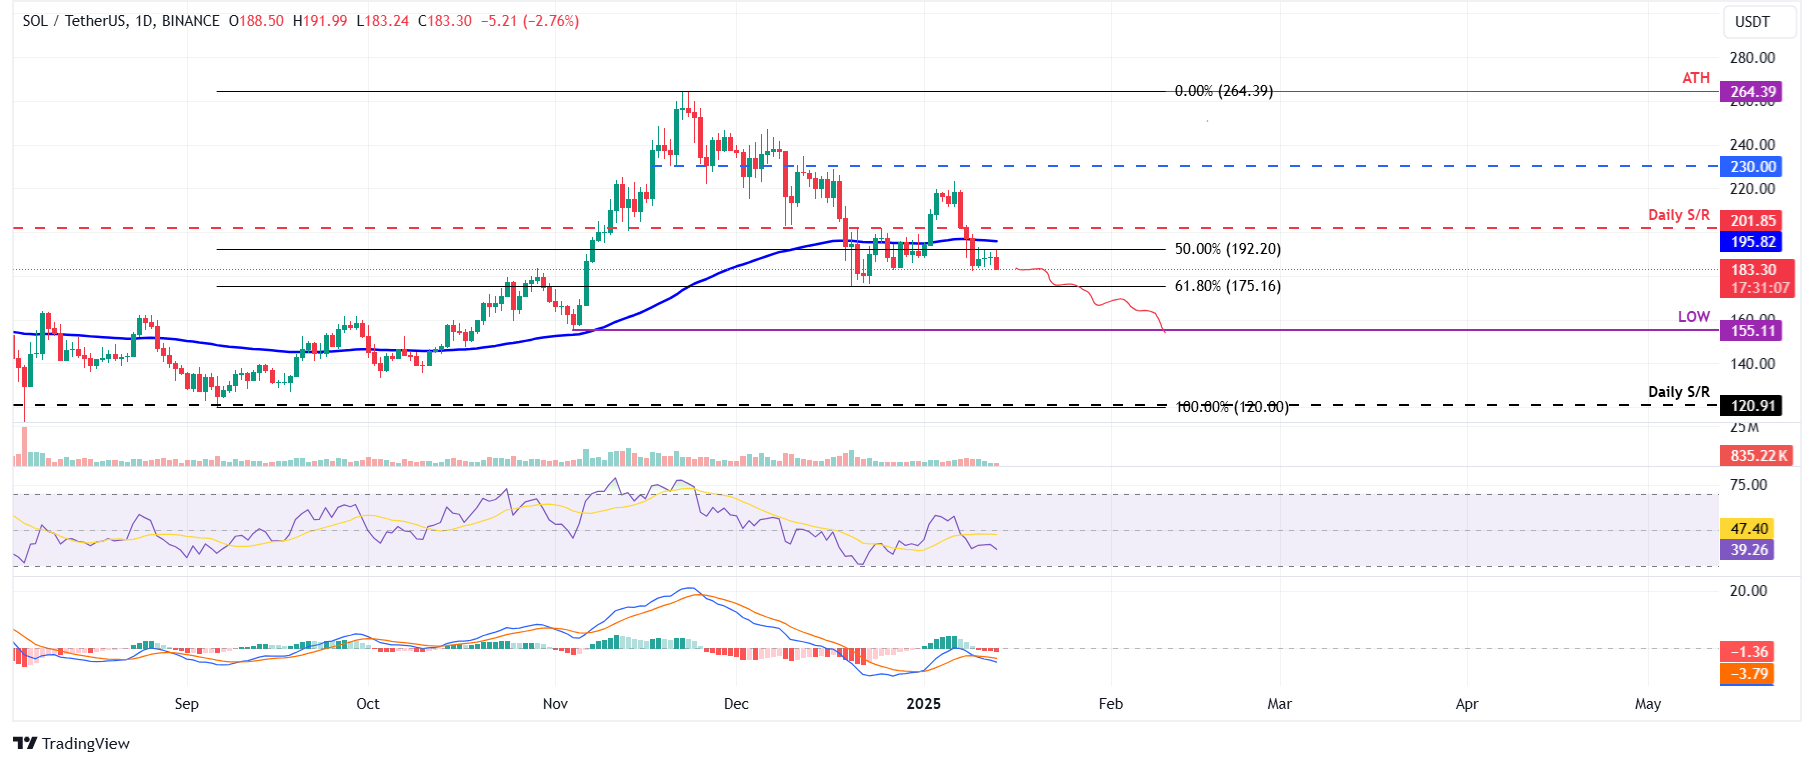
Solana price declined more than 11% and closed below the 50% price retracement level at $192.20 (drawn from the November 4 low of $155.11 to the November 22 all-time high of $264.39) last week. On Monday, it continues to trade down around $183.30, approaching its 61.8% Fibonacci retracement level of $175.16.

If SOL closes below $175.16, it could extend the decline by 15% from its current level to retest its November 4 low of $155.11.

The Relative Strength Index (RSI) on the daily chart reads 39, below its neutral level of 50 and points downwards, indicating strong bearish momentum. Additionally, the Moving Average Convergence Divergence (MACD) indicator also shows a bearish crossover on Friday, suggesting a downward trend.
SOL/USDT daily chart

SOL/USDT daily chart

However, if Solana's price recovers and closes above the $201.85 daily resistance level, it could extend the recovery to retest its January 6 high of $223.18.

Cardano price set for a downturn as momentum indicators show bearish signs

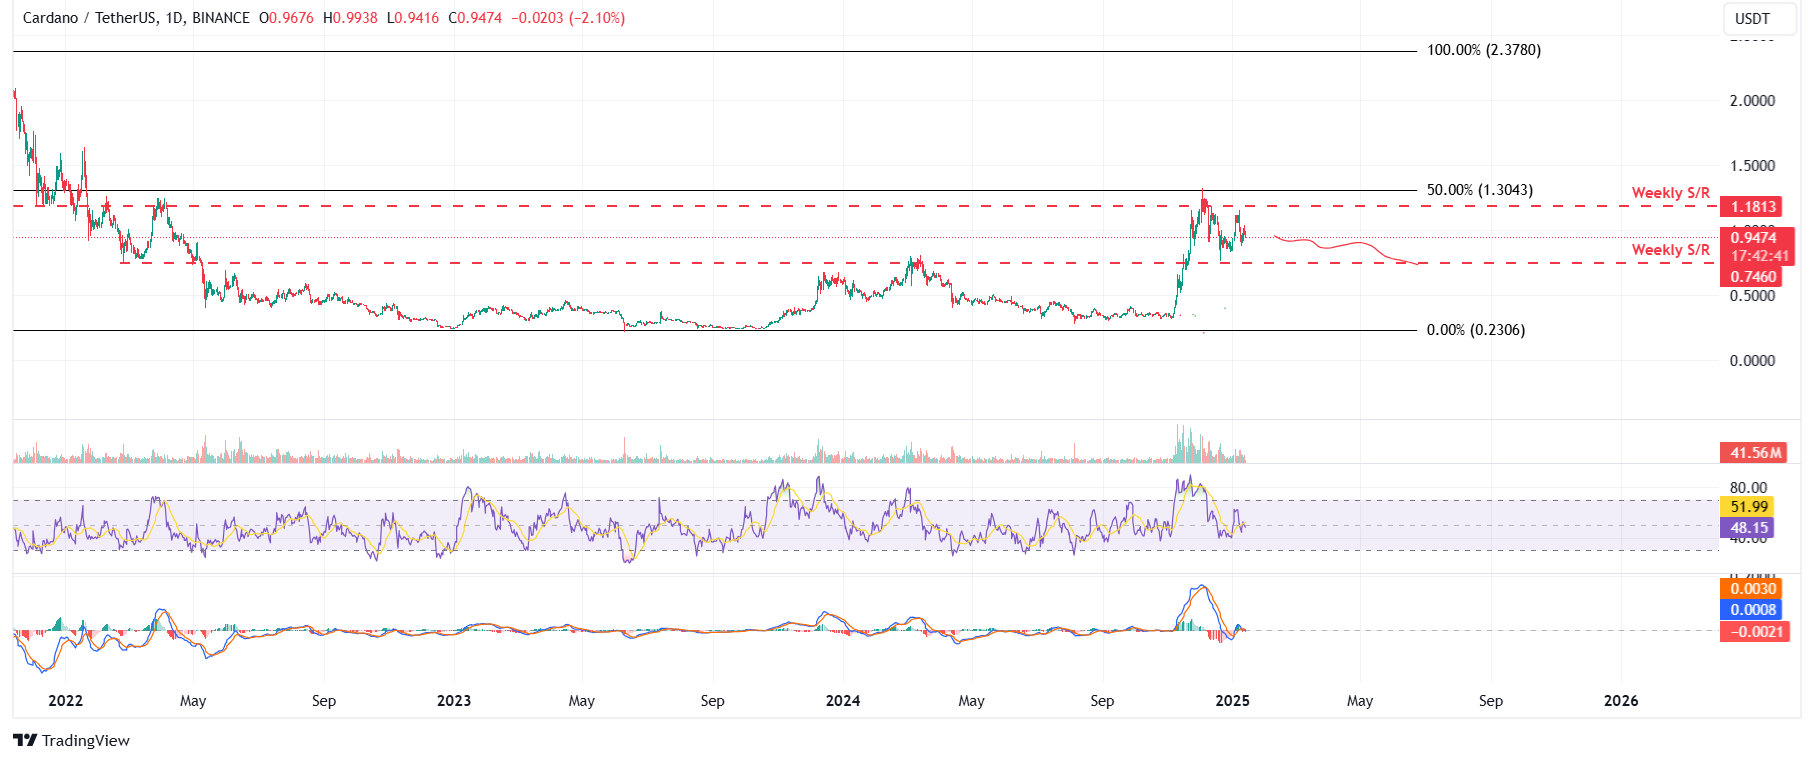
Cardano price faced rejection around its weekly resistance level of $1.18 and declined 11.31% in the previous week. At the time of writing on Monday, it continues its correction, trading around $0.94.

If ADA continues its pullback, it could extend the decline by 20% from its current level to retest its next weekly support at 0.74.

The RSI indicator on the daily chart reads 48, below its neutral level of 50 and points downwards, indicating bearish momentum. Additionally, the MACD also shows a bearish crossover on Sunday, suggesting a downward trend.
ADA/USDT daily chart

ADA/USDT daily chart

Conversely, if ADA recovers, it could extend the rally to retest its weekly resistance at $1.18.

ข้อจำกัดความรับผิดชอบ: เพื่อการอ้างอิงเท่านั้น ผลการดำเนินงานในอดีตไม่ได้บ่งบอกถึงผลลัพธ์ในอนาคต
placeholder
AUD/USD ถอยตัวก่อนการเปิดเผย CPI ของออสเตรเลียและรายงานการประชุม FOMC ของสหรัฐฯเงินดอลลาร์ออสเตรเลีย (AUD) กำลังเผชิญกับแรงกดดันครั้งใหม่เมื่อเทียบกับเงินดอลลาร์สหรัฐ (USD) ในวันอังคาร ขณะที่เงินดอลลาร์กลับมาฟื้นตัวทั่วทั้งตลาดหลังจากข้อมูลเศรษฐกิจสหรัฐที่หลากหลายและการฟื้นตัวของสภาพคล่องในตลาด
ผู้เขียน  FXStreet
5 เดือน 28 วัน พุธ
เงินดอลลาร์ออสเตรเลีย (AUD) กำลังเผชิญกับแรงกดดันครั้งใหม่เมื่อเทียบกับเงินดอลลาร์สหรัฐ (USD) ในวันอังคาร ขณะที่เงินดอลลาร์กลับมาฟื้นตัวทั่วทั้งตลาดหลังจากข้อมูลเศรษฐกิจสหรัฐที่หลากหลายและการฟื้นตัวของสภาพคล่องในตลาด
placeholder
คาดการณ์ราคาทองคำ: XAU/USD ขยายการปรับตัวลงใกล้ $3,250 จากความต้องการความเสี่ยงที่ดีขึ้นราคาทองคํา (XAU/USD) ปรับตัวลดลงต่อเนื่องมาอยู่ที่ประมาณ $3,265 ในช่วงเช้าของตลาดลงทุนเอเชียวันจันทร์ โลหะมีค่าร่วงลงใกล้ระดับต่ำสุดในรอบหนึ่งเดือนหลังจากข้อตกลงการค้าระหว่างสหรัฐฯ และจีนช่วยเพิ่มความต้องการเสี่ยง นักลงทุนรอการแสดงความคิดเห็นจากเฟดในวันจันทร์เพื่อเป็นแรงกระตุ้นใหม่
ผู้เขียน  FXStreet
6 เดือน 30 วัน จันทร์
ราคาทองคํา (XAU/USD) ปรับตัวลดลงต่อเนื่องมาอยู่ที่ประมาณ $3,265 ในช่วงเช้าของตลาดลงทุนเอเชียวันจันทร์ โลหะมีค่าร่วงลงใกล้ระดับต่ำสุดในรอบหนึ่งเดือนหลังจากข้อตกลงการค้าระหว่างสหรัฐฯ และจีนช่วยเพิ่มความต้องการเสี่ยง นักลงทุนรอการแสดงความคิดเห็นจากเฟดในวันจันทร์เพื่อเป็นแรงกระตุ้นใหม่
placeholder
ราคาน้ำมันดิบ WTI ลดลงใกล้ $67.00 จากปริมาณน้ำมันดิบคงคลังที่เพิ่มขึ้นในสหรัฐฯ และความไม่แน่นอนเกี่ยวกับภาษีศุลกากรน้ำมันดิบเวสต์เทกซัสอินเตอร์มีเดียต (WTI) ซึ่งเป็นเกณฑ์มาตรฐานน้ำมันดิบของสหรัฐฯ ซื้อขายอยู่ที่ประมาณ 67.15 ดอลลาร์ในช่วงเช้าของตลาดลงทุนเอเชียวันพฤหัสบดี ราคาน้ำมัน WTI ลดลงเนื่องจากความกังวลเกี่ยวกับความต้องการที่อ่อนแอลงหลังจากการเพิ่มขึ้นอย่างไม่คาดคิดในสต็อกน้ำมันดิบของสหรัฐฯ
ผู้เขียน  FXStreet
7 เดือน 10 วัน พฤหัส
น้ำมันดิบเวสต์เทกซัสอินเตอร์มีเดียต (WTI) ซึ่งเป็นเกณฑ์มาตรฐานน้ำมันดิบของสหรัฐฯ ซื้อขายอยู่ที่ประมาณ 67.15 ดอลลาร์ในช่วงเช้าของตลาดลงทุนเอเชียวันพฤหัสบดี ราคาน้ำมัน WTI ลดลงเนื่องจากความกังวลเกี่ยวกับความต้องการที่อ่อนแอลงหลังจากการเพิ่มขึ้นอย่างไม่คาดคิดในสต็อกน้ำมันดิบของสหรัฐฯ
placeholder
บิตคอยน์พุ่งทำสถิติใหม่แตะ 112,000 ดอลลาร์ รับแรงสนับสนุนจากองค์กรใหญ่TradingKey - ราคา "บิตคอยน์" ทำสถิติสูงสุดใหม่ตลอดกาลที่ระดับ 112,000 ดอลลาร์ หลังจากปรับตัวขึ้นอย่างต่อเนื่องตั้งแต่วันที่ 22 มิถุนายน โดยราคาก่อนหน้านี้อยู่ที่ราว 98,000 ดอลลาร์ แสดงถึงความต้องการที
ผู้เขียน  TradingKey
7 เดือน 10 วัน พฤหัส
TradingKey - ราคา "บิตคอยน์" ทำสถิติสูงสุดใหม่ตลอดกาลที่ระดับ 112,000 ดอลลาร์ หลังจากปรับตัวขึ้นอย่างต่อเนื่องตั้งแต่วันที่ 22 มิถุนายน โดยราคาก่อนหน้านี้อยู่ที่ราว 98,000 ดอลลาร์ แสดงถึงความต้องการที
placeholder
การคาดการณ์ราคา EUR/JPY: ยังคงมีแนวโน้มขาขึ้นเหนือระดับ 171.50 ขณะที่ RSI อยู่ในโซนซื้อมากเกินไปซึ่งควรระมัดระวังสำหรับขาขึ้นในช่วงเช้าของตลาดลงทุนยุโรปวันศุกร์ คู่ EURJPY ขยับขึ้นใกล้ 171.65
ผู้เขียน  FXStreet
เมื่อวาน 06: 03
ในช่วงเช้าของตลาดลงทุนยุโรปวันศุกร์ คู่ EURJPY ขยับขึ้นใกล้ 171.65
ตราสารที่เกี่ยวข้อง
goTop
quote