Bitcoin and Ethereum traders could watch this signal for the next bull run

แหล่งที่มา Fxstreet
  • Bitcoin and Ethereum mining wallets note a decline in supply held since the first half of 2024. 
  • The recent rebound in the combined supplies of Bitcoin and Ethereum mining wallets is a sign of a potential rally in the assets. 
  • BTC and ETH hover around key support levels on Friday. 

Crypto mining is the process by which new Bitcoin and Ethereum enter circulation. Data from crypto intelligence tracker shows that wallets of Bitcoin and Ethereum miners noted a decline in their holdings of the assets in the first half of the year. 

Analysts believe that a recovery in their holdings could signal a bull run in the two assets. 

This could signal a Bitcoin and Ethereum bull run

Analysts at crypto intelligence tracker Santiment said in a recent tweet on X that a recovery in the BTC and ETH holdings of miners’ wallets could be considered a sign of a bull run. Bitcoin and Ethereum mining wallets noted a steep decline in supply held during H1 2024, as seen in the chart below. 

Bitcoin mining wallets hold 2.14 million BTC, down 4% since April peak. Similarly, Ethereum mining wallets hold 1.18 million Ether tokens, down 4.5% from the 2024 peak. Analysts state that once the supply held by the mining wallet increases, it could be considered a sign of an incoming bull run in the two assets.

Bitcoin, Ethereum

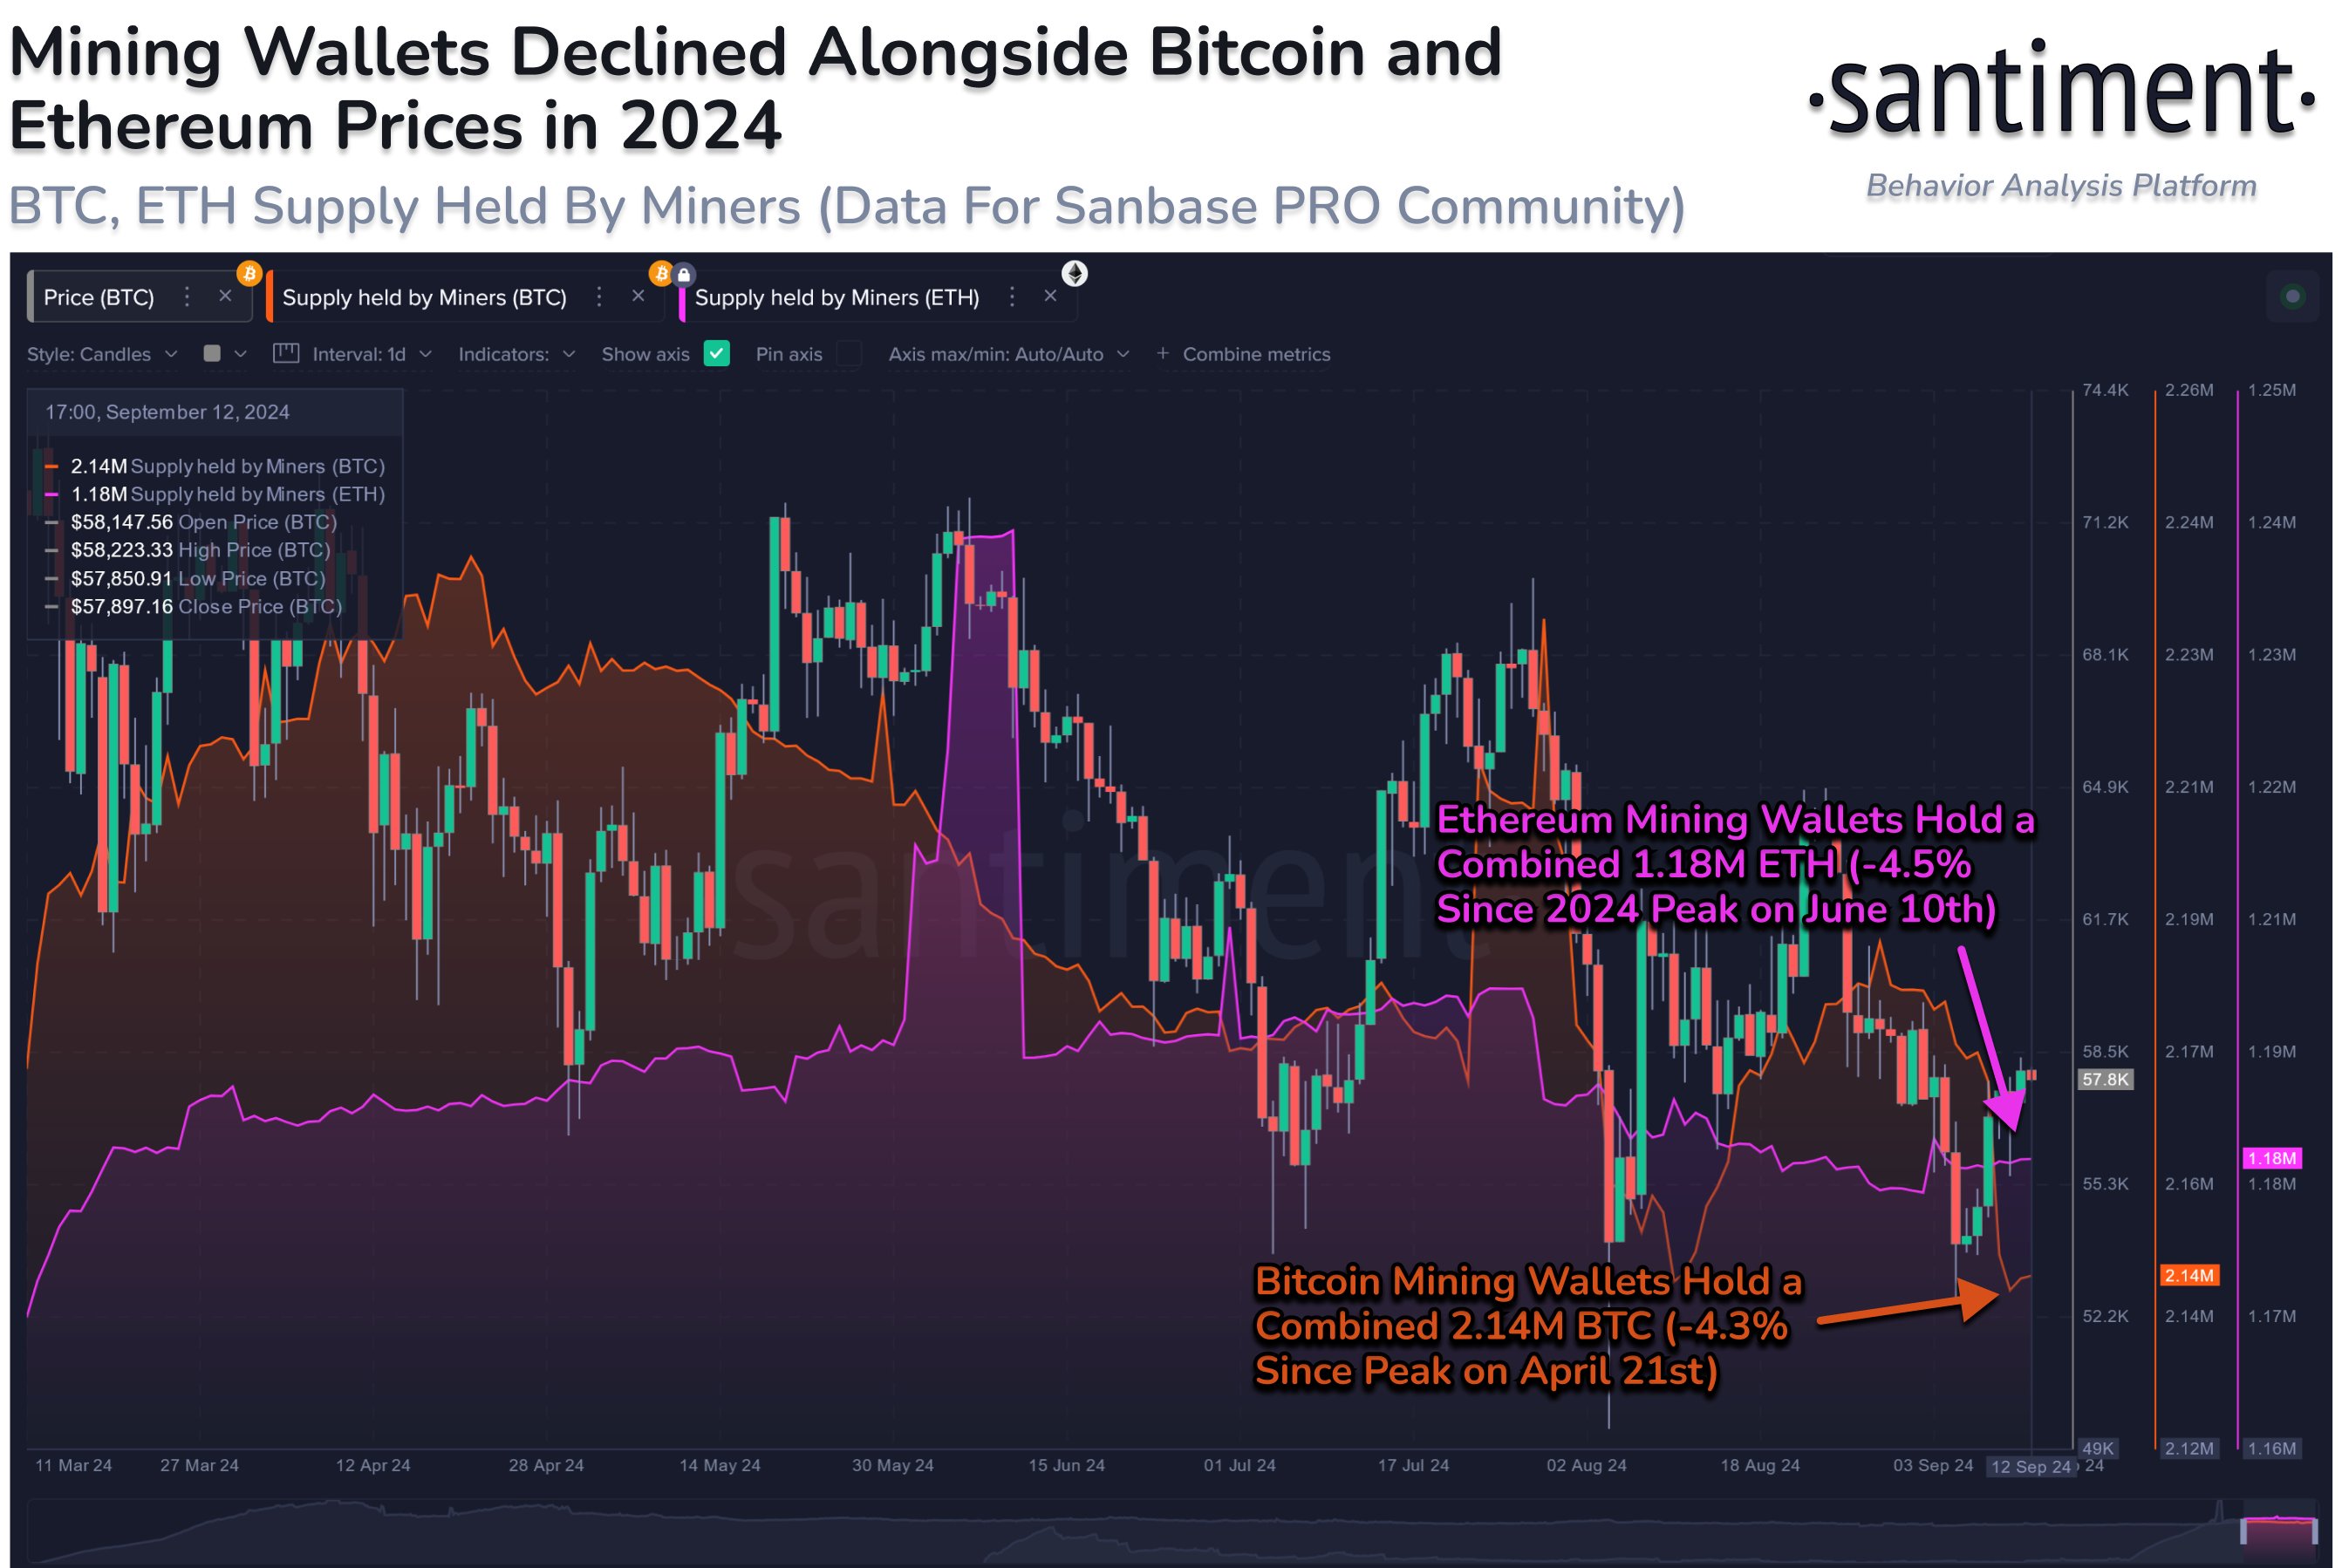
Bitcoin, Ethereum mining wallet supply 

The phenomenon can be better explained when one considers that Bitcoin and Ethereum miners typically sell their holdings to meet costs of operations. The selling pressure from miners adds to the profit-taking of traders and typically, negatively influences asset prices. 

If miners reduce the supply sold or transferred to centralized exchanges and hold on to their BTC, ETH asset holdings, it could ease selling pressure and signal an anticipation of gains in the two cryptocurrencies. 

Therefore, analysts consider an increase in supply of mining wallets as a sign of an approaching bull run. At the time of writing, Bitcoin trades at $57,940 and Ether at $2,349. 

Traders watch other signs like Bitcoin dominance, relative to altcoins and the performance of top 50 altcoins ranked by market capitalization against Bitcoin as the other signs for a bull run in BTC or alts. 

ข้อจำกัดความรับผิดชอบ: เพื่อการอ้างอิงเท่านั้น ผลการดำเนินงานในอดีตไม่ได้บ่งบอกถึงผลลัพธ์ในอนาคต
placeholder
วิเคราะห์หุ้น Intel (INTC): ทำไมราคาหุ้น Intel ถึงพุ่งสูงขึ้นเมื่อเร็วๆ นี้? ยังมีช่องว่างให้ปรับราคาขึ้นอีกหรือไม่? การลงทุนในหุ้น Intel ตอนนี้คุ้มค่าหรือไม่?TradingKey - หุ้น Intel (NASDAQ: INTC) ทะยานขึ้นอย่างแข็งแกร่งจากระดับต่ำสุดในรอบหลายปี ดึงดูดความสนใจนักลงทุนอย่างมากถึงปัจจัยหนุน โอกาสขาขึ้น และช่วงเวลาที่เหมาะสมในการลงทุนมุมมองของเราคือ อนาคตของ
ผู้เขียน  TradingKey
6 ชั่วโมงที่แล้ว
TradingKey - หุ้น Intel (NASDAQ: INTC) ทะยานขึ้นอย่างแข็งแกร่งจากระดับต่ำสุดในรอบหลายปี ดึงดูดความสนใจนักลงทุนอย่างมากถึงปัจจัยหนุน โอกาสขาขึ้น และช่วงเวลาที่เหมาะสมในการลงทุนมุมมองของเราคือ อนาคตของ
placeholder
ราคาทองคําปรับตัวสูงขึ้นท่ามกลางการเก็งกำไรเกี่ยวกับ Fed ที่ผ่อนคลายและความเสี่ยงทางภูมิศาสตร์; ขาดความเชื่อมั่นในแนวโน้มขาขึ้นทองคํา (XAU/USD) ดึงดูดแรงช้อนซื้อในช่วงเริ่มต้นของสัปดาห์ใหม่ และหยุดการย่อตัวเล็กน้อยในวันศุกร์จากบริเวณ $4,260 หรือบริเวณระดับสูงสุดนับตั้งแต่วันที่ 21 ตุลาคม
ผู้เขียน  FXStreet
8 ชั่วโมงที่แล้ว
ทองคํา (XAU/USD) ดึงดูดแรงช้อนซื้อในช่วงเริ่มต้นของสัปดาห์ใหม่ และหยุดการย่อตัวเล็กน้อยในวันศุกร์จากบริเวณ $4,260 หรือบริเวณระดับสูงสุดนับตั้งแต่วันที่ 21 ตุลาคม
placeholder
การคาดการณ์ราคาโลหะเงิน: XAGUSD ปรับตัวอยู่เหนือระดับ $58.00; ศักยภาพขาขึ้นยังคงไม่เปลี่ยนแปลงโลหะเงิน (XAGUSD) ขาดทิศทางที่ชัดเจนในระหว่างวันในวันจันทร์ และแกว่งไปมาระหว่างการปรับตัวขึ้นเล็กน้อยและการขาดทุนเล็กน้อยในช่วงตลาดลงทุนเอเชีย
ผู้เขียน  FXStreet
9 ชั่วโมงที่แล้ว
โลหะเงิน (XAGUSD) ขาดทิศทางที่ชัดเจนในระหว่างวันในวันจันทร์ และแกว่งไปมาระหว่างการปรับตัวขึ้นเล็กน้อยและการขาดทุนเล็กน้อยในช่วงตลาดลงทุนเอเชีย
placeholder
USDCAD ยังคงอยุ่ในขาลงจากวันศุกร์ที่ประมาณ 1.3800 นักลงทุนรอดูนโยบายของเฟดและ BoCในช่วงเซสชั่นเอเชียวันจันทร์ คู่ USD/CAD ปรับตัวลงใกล้ระดับต่ำสุดในรอบ 11 สัปดาห์ที่ประมาณ 1.3800 คู่ Loonie ร่วงลงอย่างมากในวันศุกร์หลังจากการเปิดเผยรายงานตลาดแรงงานของแคนาดาสำหรับเดือนพฤศจิกายน ซึ่งแสดงให้เห็นว่าอัตราการว่างงานลดลงอย่างมีนัยสำคัญเหลือ 6.5% จาก 6.9% ในเดือนตุลาคม เนื่องจากมีการเพิ
ผู้เขียน  FXStreet
10 ชั่วโมงที่แล้ว
ในช่วงเซสชั่นเอเชียวันจันทร์ คู่ USD/CAD ปรับตัวลงใกล้ระดับต่ำสุดในรอบ 11 สัปดาห์ที่ประมาณ 1.3800 คู่ Loonie ร่วงลงอย่างมากในวันศุกร์หลังจากการเปิดเผยรายงานตลาดแรงงานของแคนาดาสำหรับเดือนพฤศจิกายน ซึ่งแสดงให้เห็นว่าอัตราการว่างงานลดลงอย่างมีนัยสำคัญเหลือ 6.5% จาก 6.9% ในเดือนตุลาคม เนื่องจากมีการเพิ
placeholder
ดัชนีดอลลาร์สหรัฐอ่อนค่าลงต่ำกว่า 99.0 ท่ามกลางการเก็งการลดอัตราดอกเบี้ยของเฟดดัชนีดอลลาร์สหรัฐ (DXY) ซึ่งเป็นดัชนีมูลค่าของดอลลาร์สหรัฐ (USD) ที่วัดเทียบกับตะกร้าสกุลเงินทั่วโลก 6 สกุล เคลื่อนไหวในแดนลบอยู่ที่ประมาณ 98.90 ในช่วงชั่วโมงการซื้อขายของเอเชียในวันจันทร์
ผู้เขียน  FXStreet
11 ชั่วโมงที่แล้ว
ดัชนีดอลลาร์สหรัฐ (DXY) ซึ่งเป็นดัชนีมูลค่าของดอลลาร์สหรัฐ (USD) ที่วัดเทียบกับตะกร้าสกุลเงินทั่วโลก 6 สกุล เคลื่อนไหวในแดนลบอยู่ที่ประมาณ 98.90 ในช่วงชั่วโมงการซื้อขายของเอเชียในวันจันทร์
ตราสารที่เกี่ยวข้อง
goTop
quote