

Altcoin season may be closer as Bitcoin erases 15% value in 90 days, what to expect
- Bitcoin erased 15% value in the last three months, hovers around $56,500 on Wednesday.
- Crypto market capitalization, excluding Bitcoin and Ethereum, completes the second Elliot impulse wave and gears up for gains.
- Altcoin season index climbs to 55 as 32% of altcoins in top 50 outperformed Bitcoin over the last three months.
Bitcoin hovers around $56,500 at the time of writing on Wednesday. The largest cryptocurrency by market capitalization has erased 15% of its value in the last 90 days.
The altcoin season index at Blockchaincenter.net shows that 16 altcoins of the top 50 outperformed BTC in the same period.
By definition, when 75% of the top 50 altcoins ranked by market capitalization perform better than Bitcoin in a 90-day time frame, it is considered an altcoin season, and, as for now, we are not there yet.
Additionally, the crypto market capitalization chart, excluding Bitcoin and Ethereum, shows promising signs of a rally in altcoins.
These signs imply altcoin season is likely
The largest cryptocurrency is in a state of decline since its March 14 all-time high of $73,777. In the last 90 days, Bitcoin price has corrected by 15%. In the same timeframe, 16 altcoins in the top 50 have outperformed BTC.
Helium (HNT), AAVE, Tron (TRX), WhiteBIT Coin (WBT) and XRP are the top five altcoins that yielded the highest gains, and several other altcoins offered negative returns in the same timeframe.
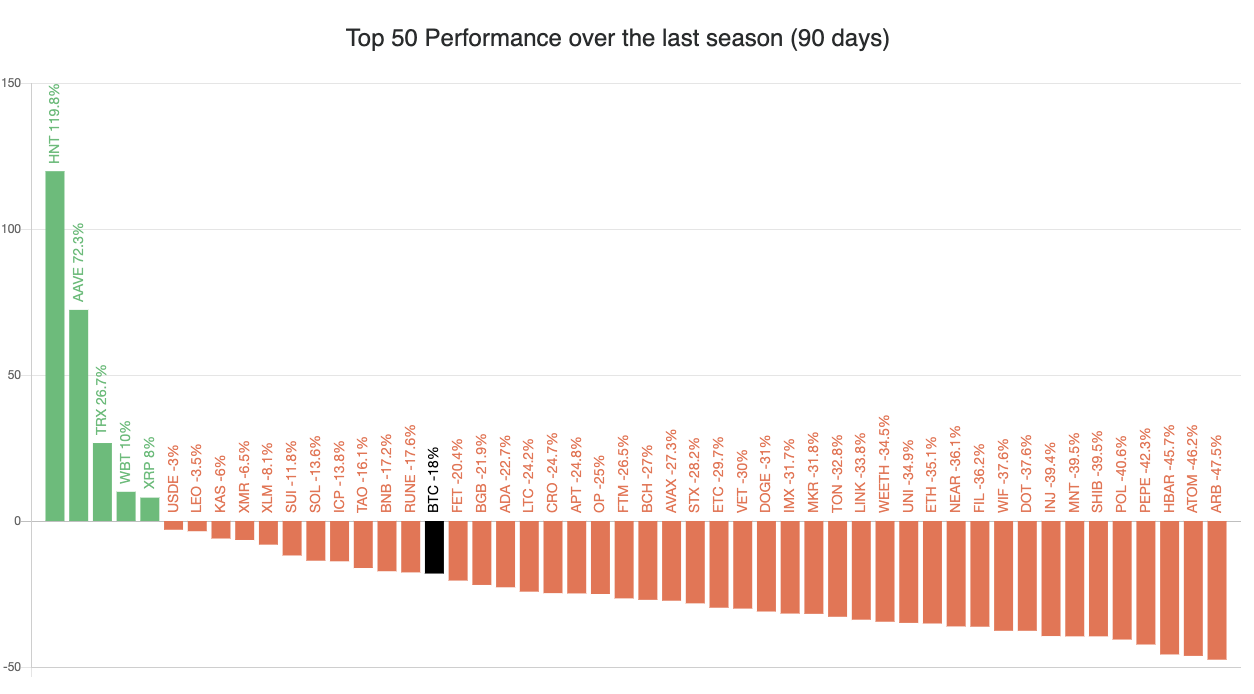
Top 50 altcoins’ performance over the last 90 days
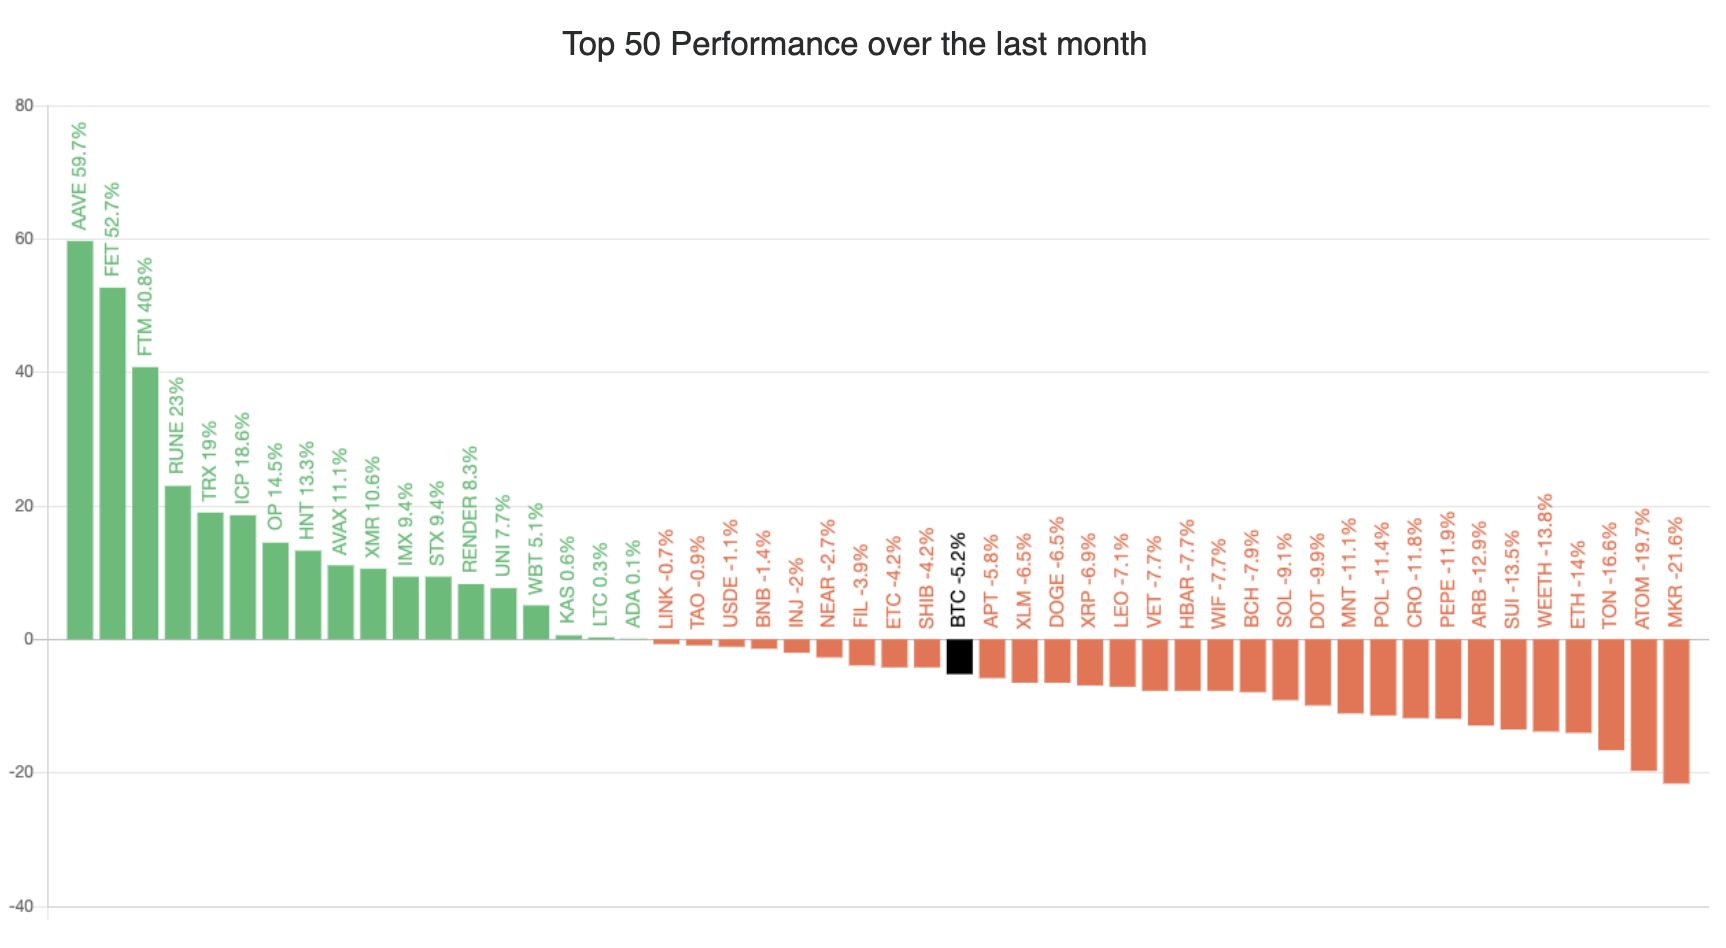
Top 50 altcoins performance last month
The altcoin season index at Blockchaincenter.net reads 55 on a scale of 0 to 100, which means it is not an altcoin month yet. Once the value crosses 75, it indicates an altcoin season.
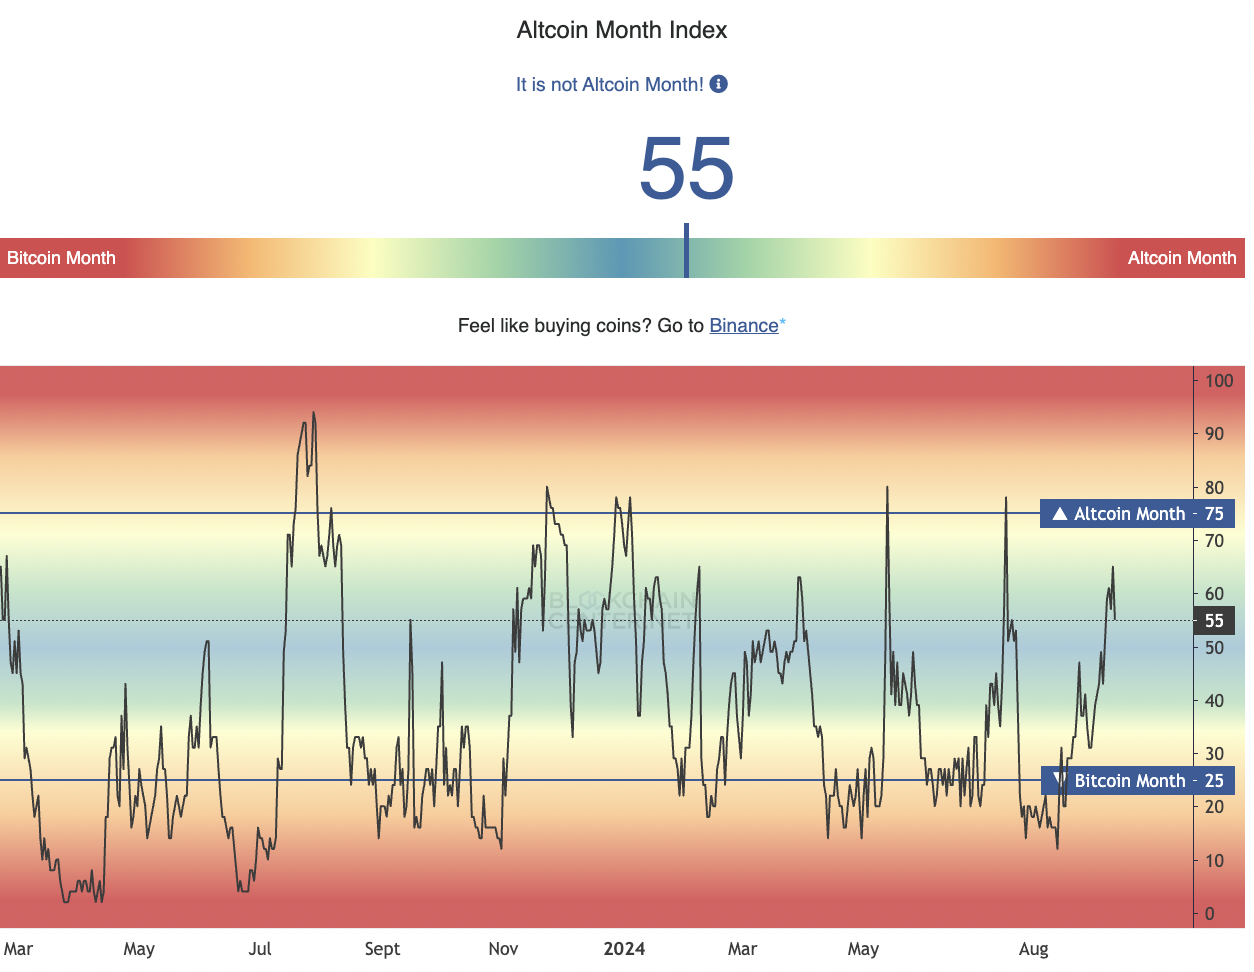
Altcoin Month Index from Blockchaincenter.net
Traders watch this metric closely to predict whether altcoins in the top 50 will extend gains this cycle.
On the other hand, the total market capitalization of all cryptocurrencies, excluding Bitcoin and Ethereum, is a key metric that examines the potential of a rally in altcoins.
Higher market capitalization results from higher prices of altcoins. In order to predict where altcoins are headed next, Elliott Impulse waves are used. They consist of five smaller-degree waves that move in the same direction, as part of a larger trend.
The TradingView chart below shows that the second Elliott impulse wave is complete, total market cap of altcoins (excluding BTC and Ether) could climb to $2 trillion by the end of the fifth wave.
The accumulation zone of October 2023 is similar to the chart pattern in the last few weeks, as seen in the weekly chart below. If the pattern repeats itself, an altcoin season rally is expected in Q4 2024 and 2025.
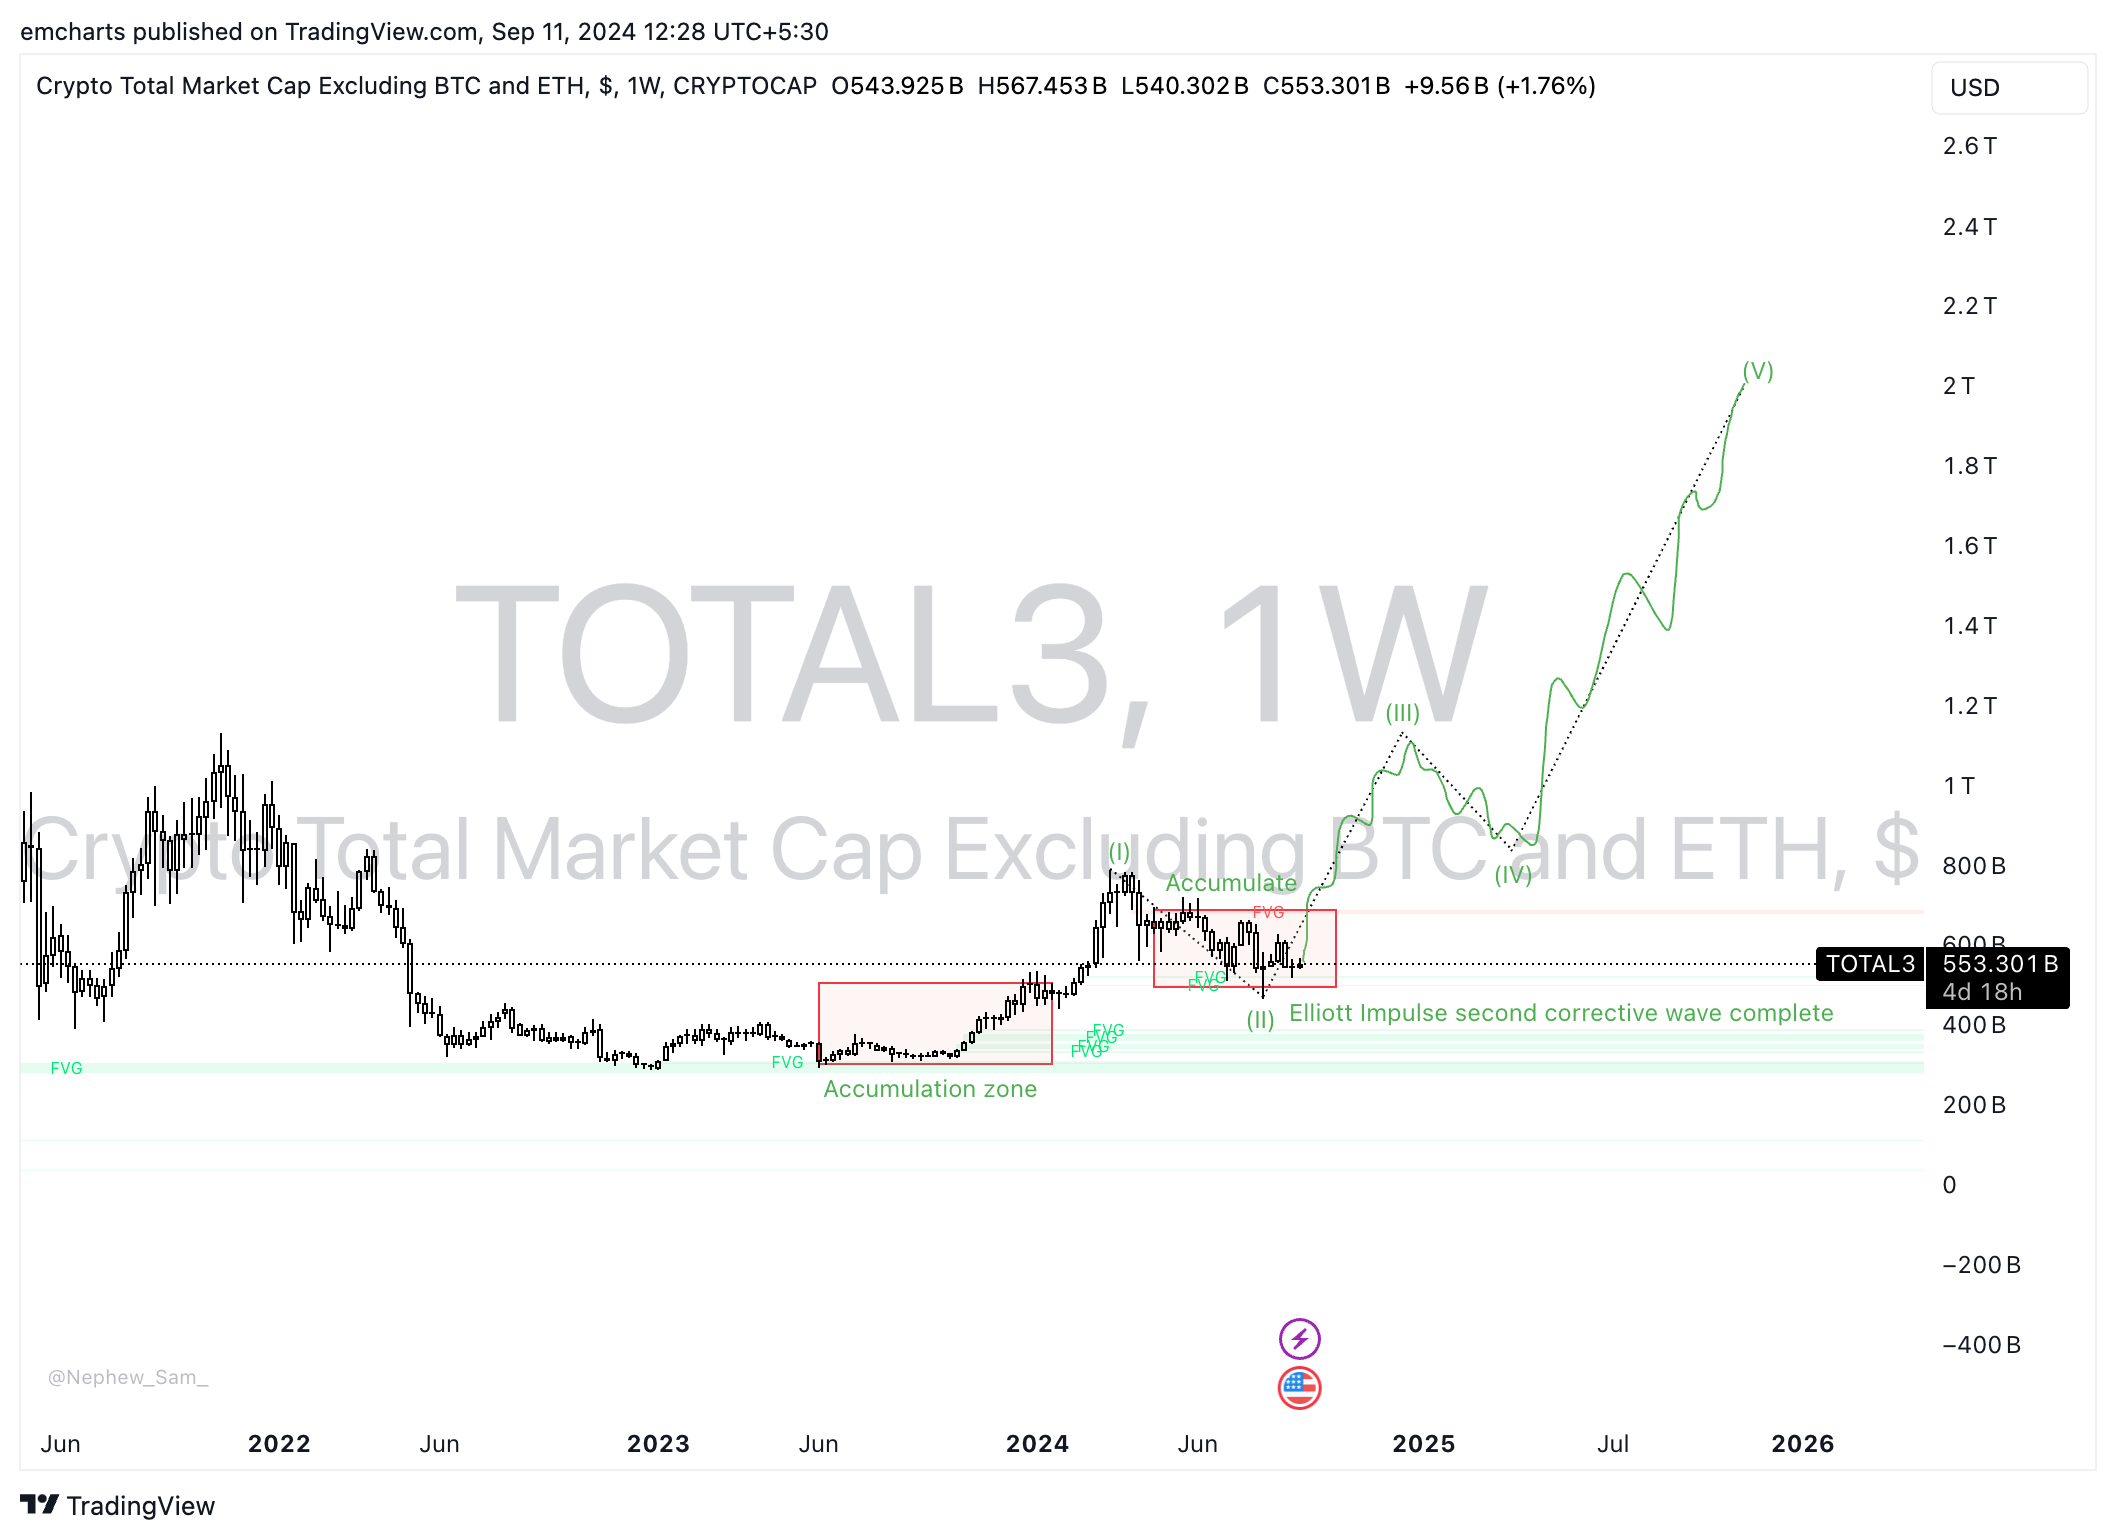
Crypto total market capitalization excluding BTC, ETH
Crypto analyst identifies three altcoins likely to gain in an altcoin season rally
Analyst at Crypto Banter (@Sheldon_Sniper) listed Arweave (AR), Render (RNDR) and Chainlink (LINK) as three altcoins that are likely to rally in the altseason. The analyst set price targets for the three altcoins and predicted between 37% and 200% gains in the three assets.
#CryptoInvestors keep asking me if #Altseason is starting..
— Sheldon The Sniper (@Sheldon_Sniper) September 10, 2024
These x3 #Altcoins are still in DCA zones, under trend.
Once they Break Trend, it will be too late.
Clock's ticking.#ARUSDT #RNDR #Chainlink pic.twitter.com/5bFEN6Fe7o
บทความแนะนำ


