

Solana could rally as Breakpoint conference approaches
- Solana witnessed the highest single-day daily active address growth on its network.
- SOL has historically rallied prior to the Solana Breakpoint conference.
- SOL could rally toward $163 if it sustains an extended move above the $136 key resistance.
Solana (SOL) is up 0.5% on Tuesday, following significant growth in its network daily active addresses. Investors anticipate a potential rally as the Solana Breakpoint conference approaches.
SOL needs other key metrics to catch up to fuel pre-Breakpoint rise
With ten days to the Solana Breakpoint annual conference, the Solana network is experiencing heightened network activity. According to data from Artemis, Solana witnessed its highest single-day daily active address (DAA) growth on Tuesday after adding over 5.4 million new addresses.
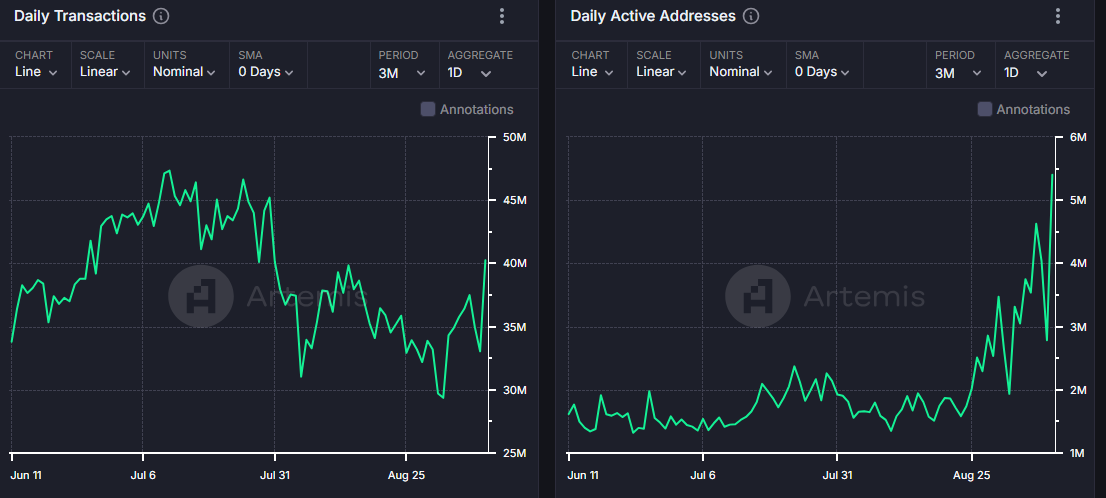
SOL Daily Active Addresses & Daily Transactions
Solana's daily transactions are also rising, growing by 22% to 40.3 million between September 8 and 9. This steady growth could help Solana's network fees recover from the downward trend it has been on since August.
Network fees are currently at around $595K, levels last seen before the meme coin frenzy in March. A similar trend is visible in Solana's decentralized exchange (DEX) trading volume, which declined by over 27% in August.
If Solana network fees and DEX trading volume increase as the Breakpoint conference approaches, it could fuel a SOL rise in the coming weeks. The Solana Breakpoint conference will run from September 20 - 21, 2024.
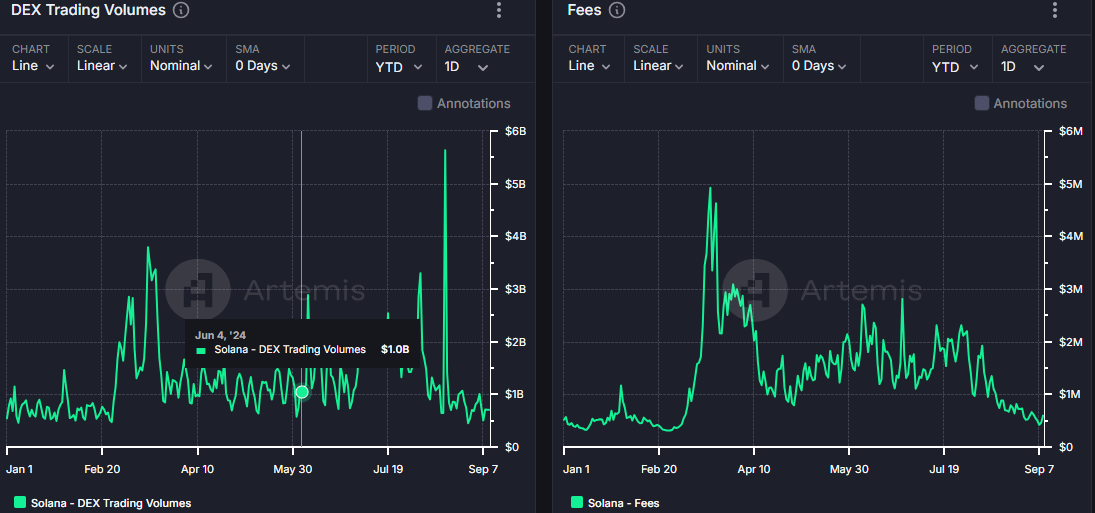
SOL DEX Trading Volume & Network Fees
According to analyst @ali_charts, SOL has historically seen a price rise two weeks before the Solana Breakpoint conference. He noted that SOL surged by 35% in 2021 and 2022 and by 60% in 2023 prior to the conference. As a result, it's crucial for investors to watch out for a potential price rise in the coming days.
During such conferences, projects tend to do product reveals, which may lead to a bullish spark. Hence, it may also prove beneficial to pay close attention to tokens within the Solana ecosystem.
On the flip side, industry events are also often treated as sell-the-news events, leading to a potential price decline within key projects.
SOL could rally further above key resistance
On the 4-hour chart, SOL is attempting to sustain a move above a key rectangle's resistance around $136. A sustained move above this level could see SOL rally toward $163. However, failure to trade extensively above $136 could see SOL decline toward the $120 support level.
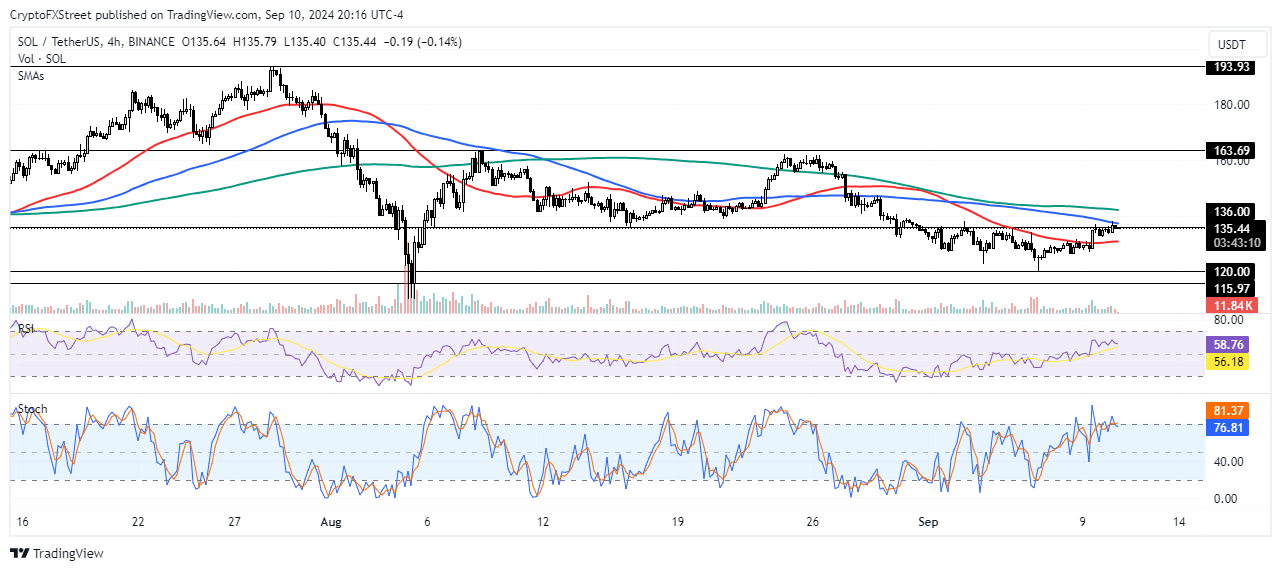
SOL/USDT 4-hour chart
The 200-day Simple Moving Average (SMA) stands as resistance on the way up and could prevent a further rise in SOL. The Relative Strength Index (RSI) is above the midline at 60, indicating rising bullish momentum. The %K and %D lines of the Stochastic Oscillator (Stoch) have crossed into the oversold region, meaning a short-term correction may be imminent.
In the short term, SOL could fall to $132 to liquidate positions worth $16.02 million.
บทความแนะนำ


