Bitcoin price poised for a potential relief rally before continuing its current downtrend
- Metaplanet secures ¥1 billion at a 0.1% APR loan; proceeds to fund additional purchases of Bitcoin on Thursday.
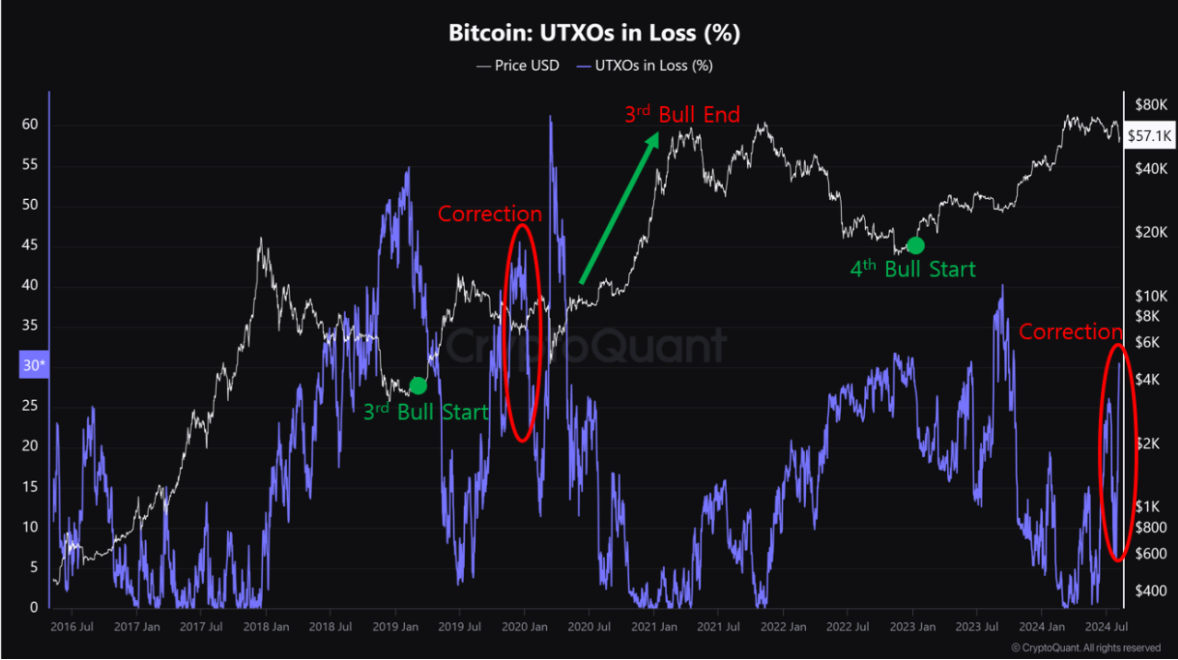
- Bitcoin UTXO loss (%) ratio is similar to the 2020 bull cycle.
- On-chain data indicates that funding rates have turned negative, highlighting prevailing bearish sentiment and the dominance of short sellers in the market.
Bitcoin's (BTC) price is recovering from initial weekly losses after a 7% drop on Monday, trading 3.8% higher at $57,245 at the time of writing on Thursday. Meanwhile, Metaplanet secured a ¥1 billion loan at a 0.1% Annual Percentage Rate (APR) on Thursday to fund additional Bitcoin purchases. However, on-chain data shows negative funding rates, indicating prevailing bearish sentiment and the dominance of short sellers. This suggests that the broader downward trend may continue in the coming days.
Daily digest market movers: Bitcoin holds $56,000 as Metaplanet secures funds to purchase BTC
- This follows Tuesday's announcement by Japanese investment and consulting firm Metaplanet, which plans to raise approximately $69.13 million for further investment in Bitcoin. On Thursday, Metaplanet secured a "¥1 billion 0.1% APR loan; proceeds to fund additional purchases of $BTC", a strategic move aimed at mitigating risks associated with Japan's significant debt and Japanese Yen volatility.
- Mirroring MicroStrategy's approach, which has accumulated 226,500 BTC worth $14.3 billion since 2020 under Michael Saylor, Metaplanet's adoption of Bitcoin as a reserve asset could shift towards broader cryptocurrency adoption among companies.
*Metaplanet secures ¥1 billion 0.1% APR loan; proceeds to fund additional purchases of $BTC* pic.twitter.com/seN6YdrnLO
— Metaplanet Inc. (@Metaplanet_JP) August 8, 2024
- Bitcoin's price has recently fallen from $70,000 to $49,000 and is struggling to sustain its upward momentum, primarily due to heightened selling activity in perpetual markets and a long-squeeze event.
- CryptoQuant's funding rates chart is crucial for gauging futures market sentiment. It has sharply declined, indicating aggressive short selling and the liquidation of long positions. With funding rates now negative, reflecting bearish sentiment and short seller dominance, which suggest that short traders are willing to pay long traders, suggesting a bearish sentiment for Bitcoin in the market.
-638587019704187483.png)
Bitcoin Funding Rates chart
- According to CryptoQuant, the percentage of Bitcoin UTXOs in loss as of 2024 is notably high, mirroring the significant correction experienced during the 2020 bull cycle.
- While the Fed's rapid and extensive quantitative easing in response to COVID-19 mitigated the 2020 crash, such immediate policy measures are less feasible now.
- Nevertheless, given the extended market adjustment period, there is a strong likelihood of future liquidity support through rate cuts and quantitative easing. Despite the recent severe market downturn, it may still be premature to definitively label the market as being in a bear phase.

Bitcoin UTXOs chart
Technical analysis: BTC eyes for a relief rally before downtrend resumes
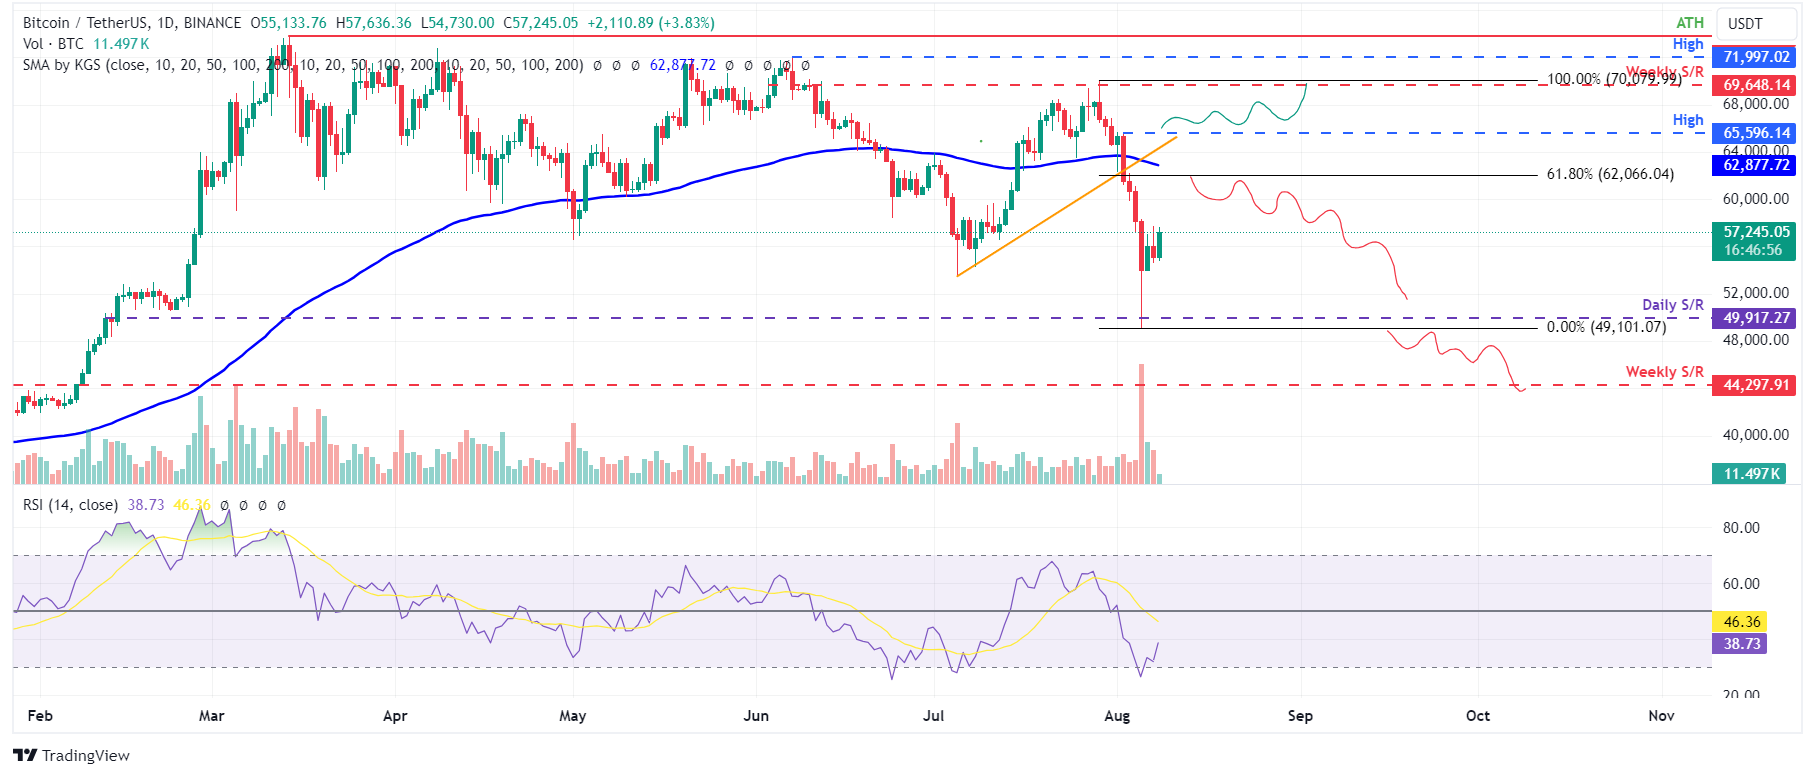
Bitcoin price broke below the ascending trendline (drawn from multiple swing lows starting July 5) on August 2, leading to a 12% decline over the following three days. However, it tested support at $49,917, bounced back with a 3.7% increase on Tuesday, and at the time of writing on Thursday, trades slightly higher by $3.8% at $57,245.
If BTC continues to rise, it could encounter resistance at the 61.8% Fibonacci retracement level of $62,066 (drawn from the swing high of $70,079 on July 29 to Monday's low of $49,101).
This level aligns with the broken trendline and the 100-day Exponential Moving Average (EMA) at around $62,887, marking it a critical reversal zone.
Failure to break above $62,066 might trigger a 19% crash, back to retest the $49,917 daily support level.
The Relative Strength Index (RSI) indicator in the daily chart is around 38, just above the oversold threshold. This indicates the possibility of a temporary relief rally before the downward trend resumes.

BTC/USDT daily chart
However, a close above the August 2 high of $65,596 would change the market structure by forming a higher high on the daily timeframe. Such a scenario might drive a 6% rise in Bitcoin's price to retest its weekly resistance at $69,648.
Bitcoin, altcoins, stablecoins FAQs
Bitcoin is the largest cryptocurrency by market capitalization, a virtual currency designed to serve as money. This form of payment cannot be controlled by any one person, group, or entity, which eliminates the need for third-party participation during financial transactions.
Altcoins are any cryptocurrency apart from Bitcoin, but some also regard Ethereum as a non-altcoin because it is from these two cryptocurrencies that forking happens. If this is true, then Litecoin is the first altcoin, forked from the Bitcoin protocol and, therefore, an “improved” version of it.
Stablecoins are cryptocurrencies designed to have a stable price, with their value backed by a reserve of the asset it represents. To achieve this, the value of any one stablecoin is pegged to a commodity or financial instrument, such as the US Dollar (USD), with its supply regulated by an algorithm or demand. The main goal of stablecoins is to provide an on/off-ramp for investors willing to trade and invest in cryptocurrencies. Stablecoins also allow investors to store value since cryptocurrencies, in general, are subject to volatility.
Bitcoin dominance is the ratio of Bitcoin's market capitalization to the total market capitalization of all cryptocurrencies combined. It provides a clear picture of Bitcoin’s interest among investors. A high BTC dominance typically happens before and during a bull run, in which investors resort to investing in relatively stable and high market capitalization cryptocurrency like Bitcoin. A drop in BTC dominance usually means that investors are moving their capital and/or profits to altcoins in a quest for higher returns, which usually triggers an explosion of altcoin rallies.


