


Pi Network Price Forecast: PI risks further decline in a bearish setup
- Pi Network is down over 6% on Monday, targeting the lower support trendline of a falling channel pattern around $0.075.
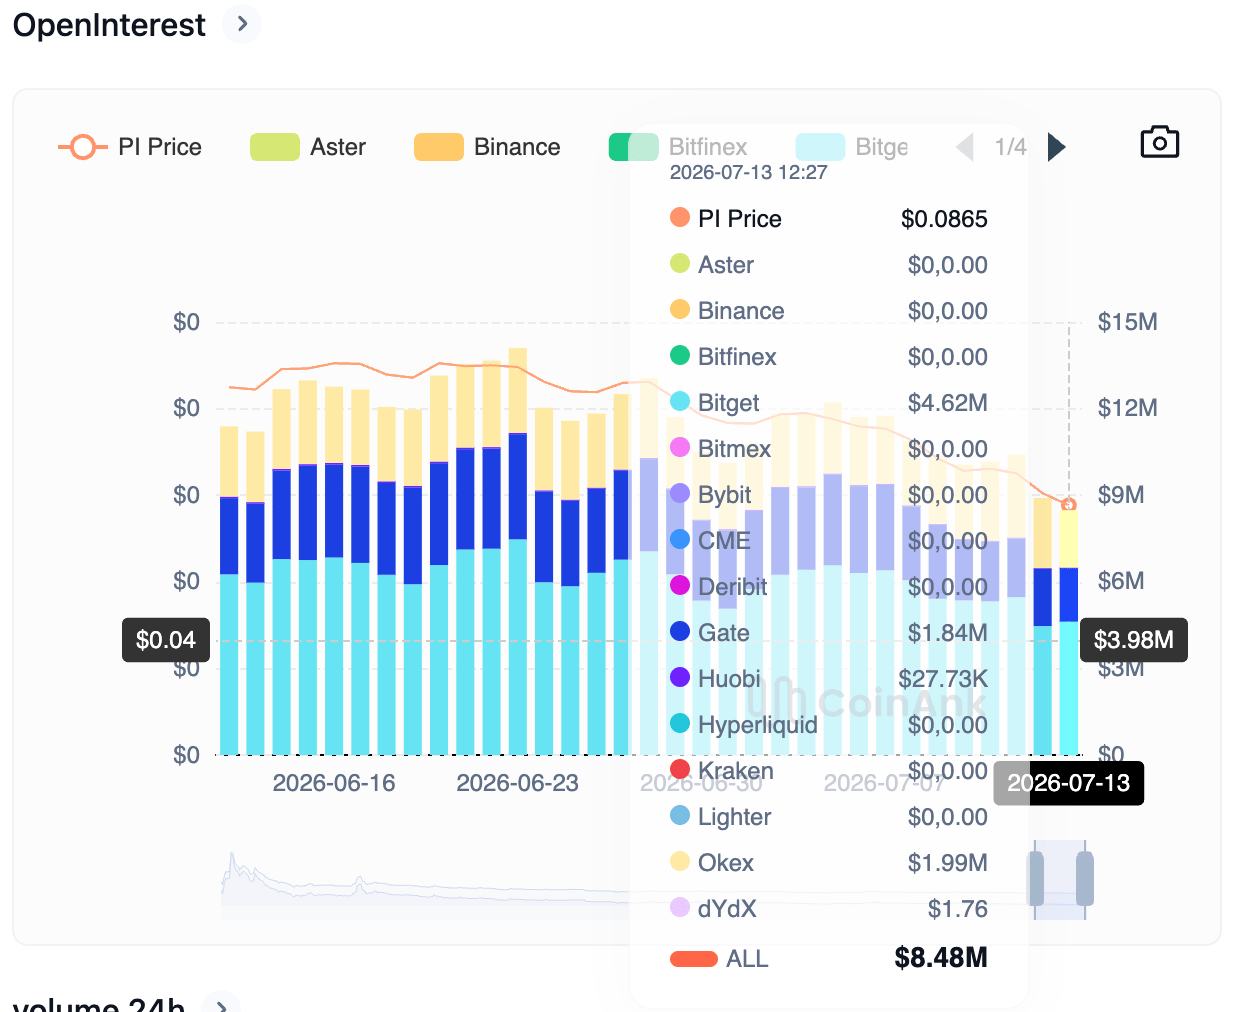
- PI Open Interest declines, signaling reduced risk appetite among traders amid the broader market's short-term corrective tone.
- The technical outlook for PI is bearish, with selling pressure remaining firm despite oversold conditions.
Pi Network (PI) remains in a steady declining trend, losing roughly 6% on Monday after a 7% drop the previous day. Retail demand is stretched thin, with Open Interest falling below $9 million on Monday, while the technical outlook suggests a steeper correction toward the lower support trendline of a falling channel pattern around $0.075.
Downside pressure adds on PI
Pi Network’s retail demand shows a steady decline. CoinAnk data show that the PI Open Interest (OI) has dropped to $8.48 million on Monday, down from $8.91 million the previous day, suggesting a reduction in leveraged positions.
In an exclusive interview with FXStreet, Sky Liu, founder of the Ju crypto exchange, shared key insights on Pi Network’s declining trend and dip-buying opportunities. Liu said, “Assigning a definitive price floor to Pi Network at this stage would be speculative. The asset is still in an early phase of price discovery, where valuation is driven more by liquidity conditions, circulating supply dynamics, and market participation than by established fundamental metrics.”
In addition, Liu highlighted token unlocks as a driver of selling pressure. “If supply continues to outpace demand, downside pressure could persist despite periodic technical rebounds,” said Liu.
For traders eyeing to buy the dip in PI, Liu said, “I would avoid making decisions solely based on how far the price has already declined. In highly volatile markets, confirmation of trend stabilization, sustained trading volume, and improving order book depth are generally more reliable indicators than attempting to identify an exact bottom.”
Looking ahead, Liu expects medium- to long-term valuation of PI will depend on the pace of ecosystem development, real user activity, and the market's ability to establish efficient price discovery. Until those factors become more evident, elevated volatility should be considered part of the asset's normal trading profile.
How low will Pi Network price go?
Pi Network has maintained a steep corrective trend since late April, forming a falling channel pattern on the daily chart. At the time of writing, PI is down 6% on Monday, heading toward the lower support trendline near $0.075.
If PI slips below $0.075, the 1.618% Fibonacci extension level, measured over the previous downswing from $0.1998 to $0.1183, at $0.0679, emerges as the next key support zone.
Momentum on the daily chart remains heavy, with the Relative Strength Index (RSI) at 15 indicating intense selling pressure and oversold conditions. At the same time, the Moving Average Convergence Divergence (MACD) descends into negative territory with its signal line, while histograms below the zero line expand, reaffirming firm sell-side pressure.
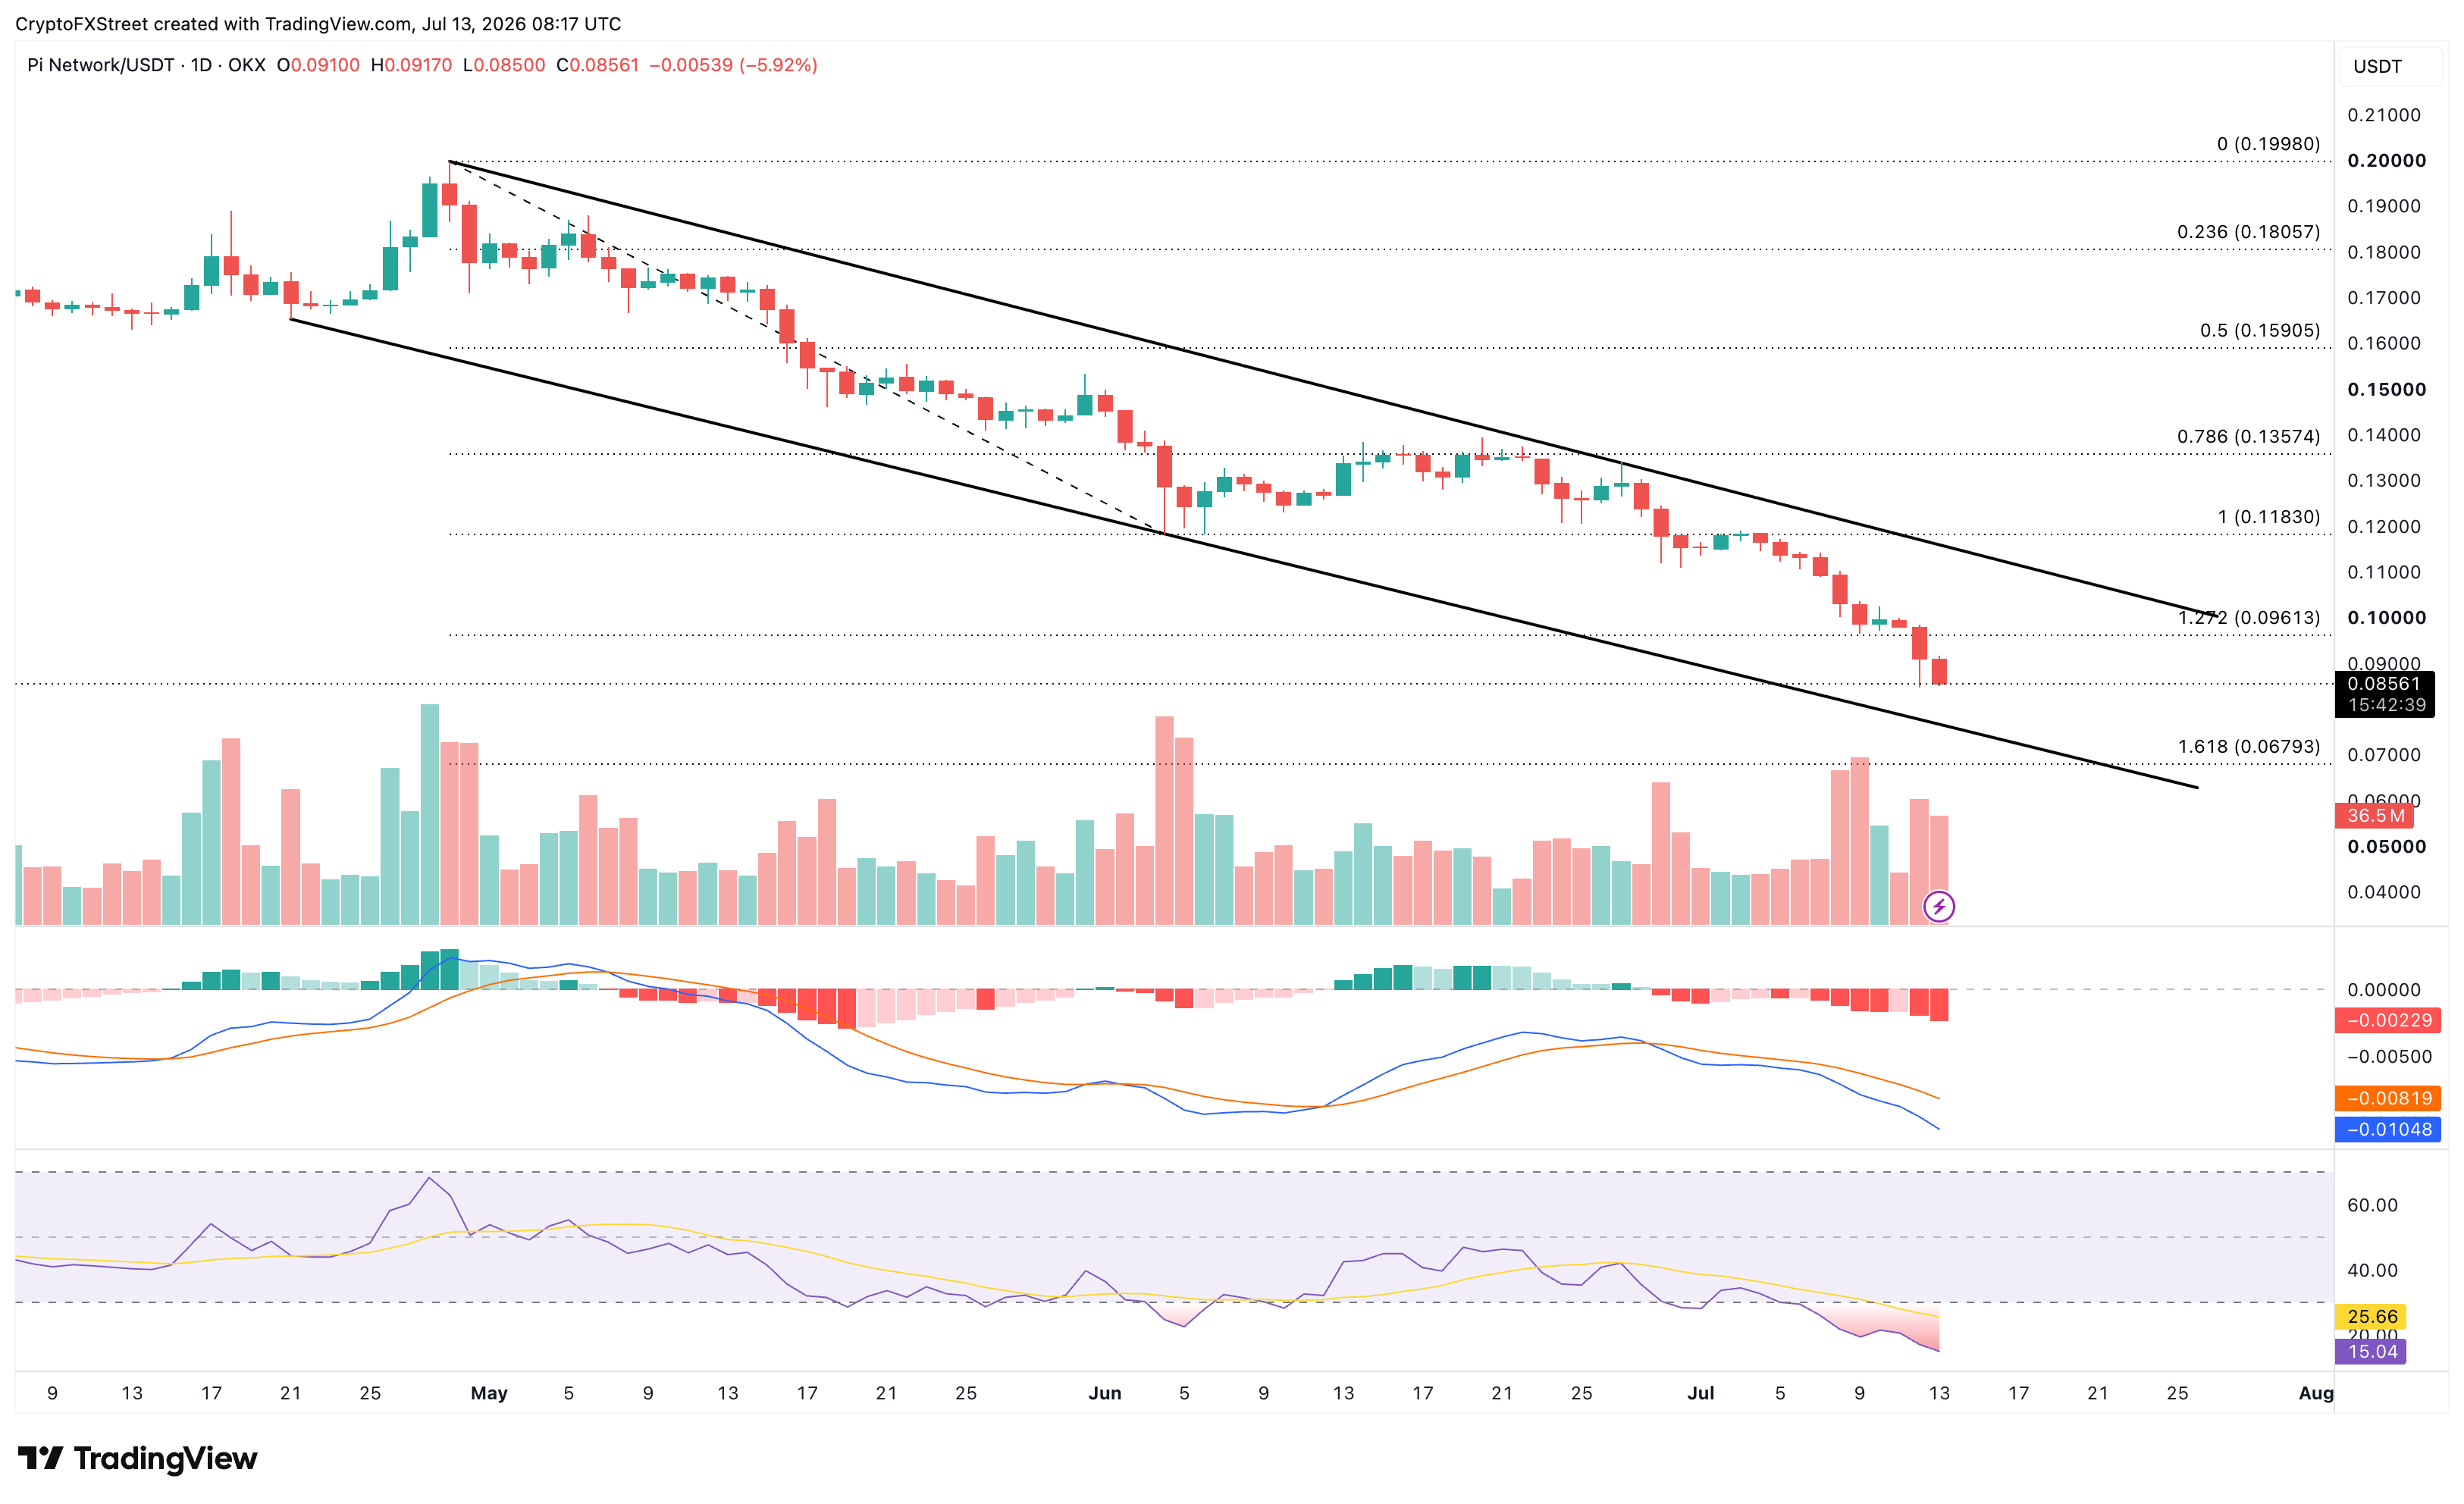
Looking up, a potential rebound from the support trendline near $0.075 could test to reclaim the 1.272% Fibonacci extension level at $0.0961, followed by the $0.1000 psychological threshold.
Crypto ETF FAQs
An Exchange-Traded Fund (ETF) is an investment vehicle or an index that tracks the price of an underlying asset. ETFs can not only track a single asset, but a group of assets and sectors. For example, a Bitcoin ETF tracks Bitcoin’s price. ETF is a tool used by investors to gain exposure to a certain asset.
Yes. The first Bitcoin futures ETF in the US was approved by the US Securities & Exchange Commission in October 2021. A total of seven Bitcoin futures ETFs have been approved, with more than 20 still waiting for the regulator’s permission. The SEC says that the cryptocurrency industry is new and subject to manipulation, which is why it has been delaying crypto-related futures ETFs for the last few years.
Yes. The SEC approved in January 2024 the listing and trading of several Bitcoin spot Exchange-Traded Funds, opening the door to institutional capital and mainstream investors to trade the main crypto currency. The decision was hailed by the industry as a game changer.
The main advantage of crypto ETFs is the possibility of gaining exposure to a cryptocurrency without ownership, reducing the risk and cost of holding the asset. Other pros are a lower learning curve and higher security for investors since ETFs take charge of securing the underlying asset holdings. As for the main drawbacks, the main one is that as an investor you can’t have direct ownership of the asset, or, as they say in crypto, “not your keys, not your coins.” Other disadvantages are higher costs associated with holding crypto since ETFs charge fees for active management. Finally, even though investing in ETFs reduces the risk of holding an asset, price swings in the underlying cryptocurrency are likely to be reflected in the investment vehicle too.
บทความแนะนำ


