

Monero Price Forecast: XMR on the verge of a breakdown

แหล่งที่มา Fxstreet
  • Monero near the key trendline support on Friday after declining more than 9% so far this week.
  • Derivatives metrics back the bearish outlook, with open interest declining and short bets rising.
  • The technical indicators continue to flash bearish signals, suggesting the risk of deeper losses ahead.

Monero (XMR) is slipping toward the key trendline support on Friday after losing over 9% so far this week. A daily close below this support zone could trigger further sell-offs. This breakdown is supported by the weakening derivatives metrics alongside bearish momentum.

Derivatives traders turn bearish

XMR’s derivatives data supports a negative outlook. CoinGlass data shows that the futures’ Open Interest (OI) on the Binance exchange for Monero slips to $29.01 million on Friday, down from the May 21 peak of $35 million. A declining OI indicates money flowing out of the market and a reduction in new buying interest, which could weaken momentum and increase the risk of further downside in Monero price. 
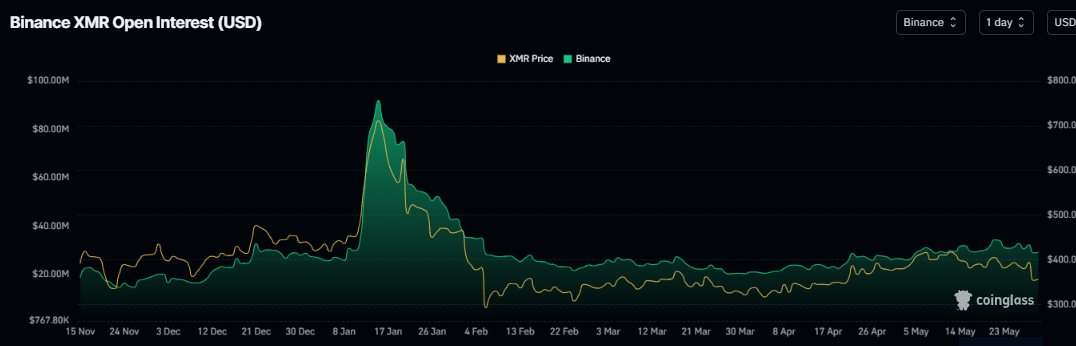
XMR open interest on the Binance chart. Source: Coinglass

In addition, CoinGlass’ long-to-short ratio for Monero read 0.9 on Friday. The ratio being below one indicates bearish sentiment, as traders are betting that XMR's price will fall.
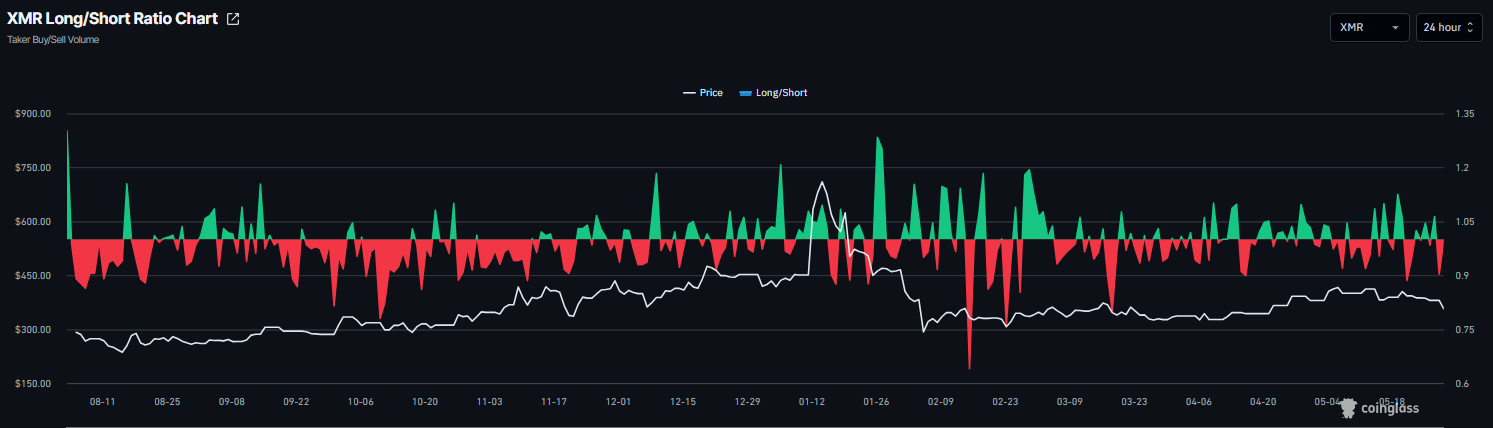
XMR long-to-short ratio chart. Source: Coinglass

Monero Price Forecast: XMR slides toward critical support after sharp weekly losses

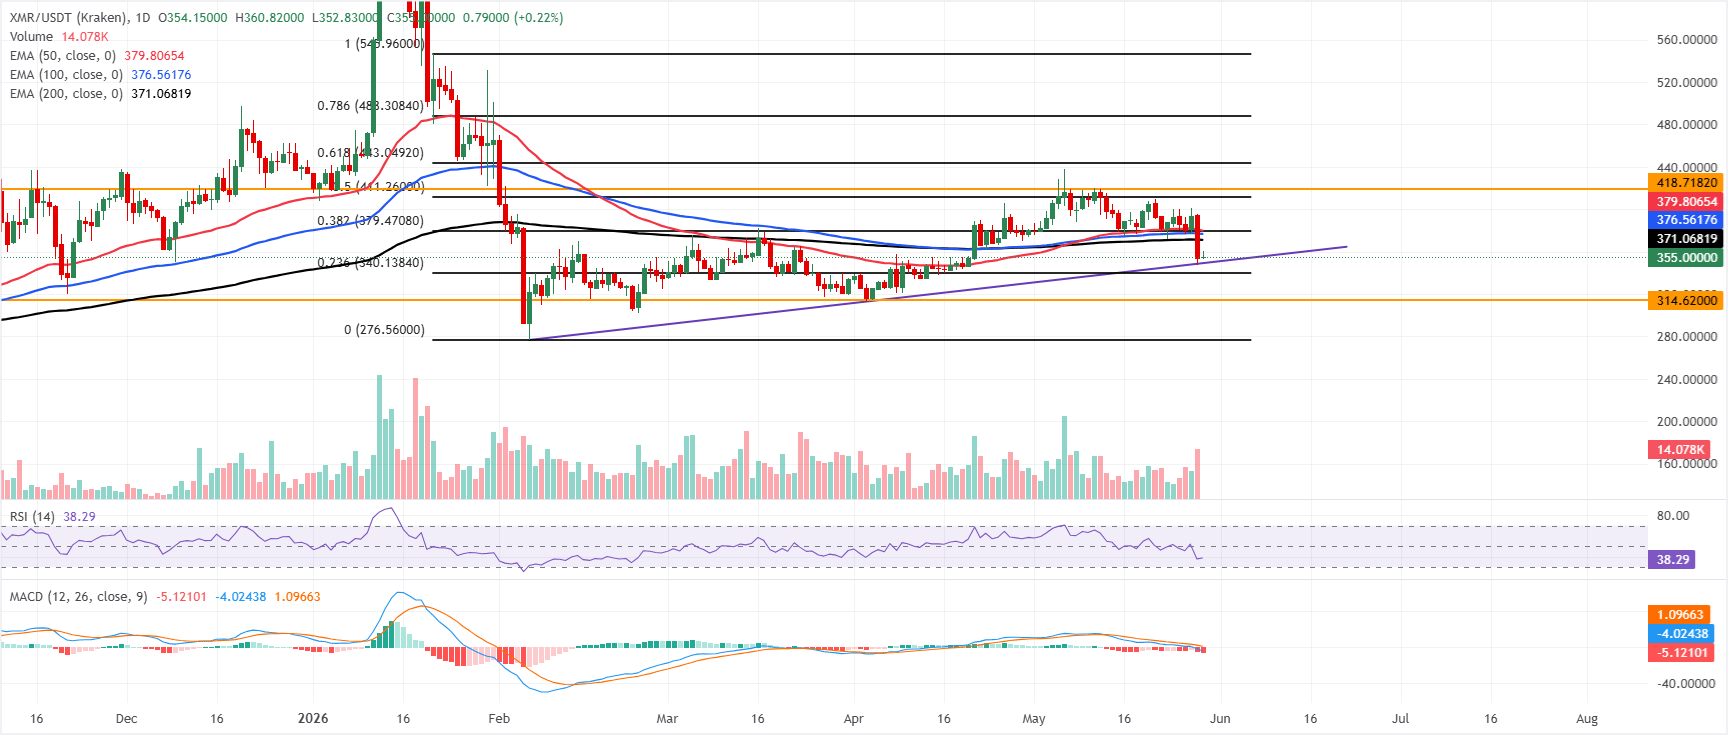
Monero price trades at $355, maintaining a bearish near-term tone as it holds below the 50-day, 100-day and 200-day Exponential Moving Averages (EMAs), clustered between roughly $371 and $380. 

The Relative Strength Index (RSI) on the daily chart, at about 38, signals weak momentum but stops short of oversold territory, while the Moving Average Convergence Divergence (MACD) remains below zero, suggesting downside pressure is still dominant despite some prior stabilization.

On the topside, initial resistance is seen at the 200-day EMA around $371.06, followed by the 100-day EMA at $376.56 and the 38.2% Fibonacci retracement of the latest swing at $379.47, with the 50-day EMA just above at $379.80 forming a dense supply band. Further hurdles emerge at the 50% retracement at $411.26 and the horizontal barrier near $418.72. 

On the downside, immediate support aligns with the rising trendline area around $349.02, ahead of the 23.6% Fibonacci retracement level at $340.14; a clearer bearish extension would open the way toward the more distant horizontal floor at $314.62.
(The technical analysis of this story was written with the help of an AI tool.)

ข้อจำกัดความรับผิดชอบ: เพื่อการอ้างอิงเท่านั้น ผลการดำเนินงานในอดีตไม่ได้บ่งบอกถึงผลลัพธ์ในอนาคต
placeholder
บิตคอยน์ร่วงลงต่ำกว่า 73,000 ดอลลาร์. ได้รับผลกระทบจากข้อมูลเงินเฟ้อ PCE, BTC หลุดจาก 10 อันดับแรกของรายชื่อสินทรัพย์ระดับโลก ข้อมูลดัชนี PCE เดือนเม.ย. ของสหรัฐฯ บ่งชี้ว่าการปรับลดอัตราดอกเบี้ยของธนาคารกลางสหรัฐฯ ยังไม่มีวี่แววจะเกิดขึ้น ขณะที่กระแสเงินทุนไหลทะลักจาก Bitcoin เข้าสู่หุ้นกลุ่ม AI และแนวโน้มขาลงอา
ผู้เขียน  TradingKey
9 ชั่วโมงที่แล้ว
ข้อมูลดัชนี PCE เดือนเม.ย. ของสหรัฐฯ บ่งชี้ว่าการปรับลดอัตราดอกเบี้ยของธนาคารกลางสหรัฐฯ ยังไม่มีวี่แววจะเกิดขึ้น ขณะที่กระแสเงินทุนไหลทะลักจาก Bitcoin เข้าสู่หุ้นกลุ่ม AI และแนวโน้มขาลงอา
placeholder
WTI ปรับตัวลดลงใกล้ระดับ 87.00 ดอลลาร์ เนื่องจากความเป็นไปได้ในการขยายเวลาหยุดยิงระหว่างสหรัฐฯ กับอิหร่านในวันศุกร์ ราคาน้ำมันดิบเวสต์เทกซัสอินเตอร์มีเดียต (WTI) เกณฑ์มาตรฐานน้ํามันดิบของสหรัฐฯ ปรับตัวลดลงต่อเนื่องเป็นวันที่สามติดต่อกัน เคลื่อนไหวอยู่ที่ประมาณ 87.20 ดอลลาร์ต่อบาร์เรลในช่วงเวลาการซื้อขายของเอเชีย
ผู้เขียน  FXStreet
15 ชั่วโมงที่แล้ว
ในวันศุกร์ ราคาน้ำมันดิบเวสต์เทกซัสอินเตอร์มีเดียต (WTI) เกณฑ์มาตรฐานน้ํามันดิบของสหรัฐฯ ปรับตัวลดลงต่อเนื่องเป็นวันที่สามติดต่อกัน เคลื่อนไหวอยู่ที่ประมาณ 87.20 ดอลลาร์ต่อบาร์เรลในช่วงเวลาการซื้อขายของเอเชีย
placeholder
WTI กลับมายืนเหนือ 91.00 ดอลลาร์ ขณะที่ความตึงเครียดในตะวันออกกลางยังคงดำเนินต่อไปในช่วงเซสชันเอเชียวันพฤหัสบดี West Texas Intermediate (WTI) – ราคาน้ำมันดิบอ้างอิงของสหรัฐฯ – ได้รับแรงหนุนเชิงบวก และฟื้นตัวจากขาลงในวันก่อนหน้าส่วนใหญ่ ซึ่งเป็นระดับต่ำสุดตั้งแต่วันที่ 21 เมษายน WTI แตะระดับสูงสุดรายวันใหม่ในชั่วโมงล่าสุด และกำลังพยายามปรับตัวขึ้นเกินระดับ $91.00 ท่ามกลางความเสี่ย
ผู้เขียน  FXStreet
เมื่อวาน 08: 34
ในช่วงเซสชันเอเชียวันพฤหัสบดี West Texas Intermediate (WTI) – ราคาน้ำมันดิบอ้างอิงของสหรัฐฯ – ได้รับแรงหนุนเชิงบวก และฟื้นตัวจากขาลงในวันก่อนหน้าส่วนใหญ่ ซึ่งเป็นระดับต่ำสุดตั้งแต่วันที่ 21 เมษายน WTI แตะระดับสูงสุดรายวันใหม่ในชั่วโมงล่าสุด และกำลังพยายามปรับตัวขึ้นเกินระดับ $91.00 ท่ามกลางความเสี่ย
placeholder
ดัชนีดอลลาร์สหรัฐพุ่งขึ้นใกล้ระดับ 99.50 ขณะที่อิหร่านขู่ตอบโต้ความหวังในข้อตกลงสหรัฐ-อิหร่านดอลลาร์สหรัฐ (USD) ดึงดูดแรงซื้ออย่างมีนัยสำคัญในช่วงการซื้อขายของเอเชียวันพฤหัสบดี เนื่องจากอิหร่านตอบโต้การโจมตีของสหรัฐฯ ใกล้สนามบินบันดาร์อาบาส ตามรายงานของสำนักข่าวทัสนิม
ผู้เขียน  FXStreet
เมื่อวาน 06: 06
ดอลลาร์สหรัฐ (USD) ดึงดูดแรงซื้ออย่างมีนัยสำคัญในช่วงการซื้อขายของเอเชียวันพฤหัสบดี เนื่องจากอิหร่านตอบโต้การโจมตีของสหรัฐฯ ใกล้สนามบินบันดาร์อาบาส ตามรายงานของสำนักข่าวทัสนิม
placeholder
คาดการณ์โลหะเงิน: ยังคงปรับตัวลดลงต่ำกว่า $77.00 เพราะความตึงเครียดระหว่างสหรัฐฯ-อิหร่านอีกครั้งในตลาดลงทุนเอเชียวันพุธ ราคาโลหะเงิน (XAG/USD) ยังคงทรงตัวในระดับต่ำเป็นวันที่สองติดต่อกัน เคลื่อนไหวอยู่ที่ประมาณ $76.90 ต่อทรอยออนซ์ โลหะเงินยังคงปรับตัวลดลงเนื่องจากความตึงเครียดอีกครั้ง และความไม่แน่นอนรอบๆ ช่องแคบฮอร์มุซที่มีความสำคัญเชิงยุทธศาสตร์ อย่างไรก็ตาม เทรดเดอร์ติดตามความคืบหน้าในความเ
ผู้เขียน  FXStreet
5 เดือน 27 วัน พุธ
ในตลาดลงทุนเอเชียวันพุธ ราคาโลหะเงิน (XAG/USD) ยังคงทรงตัวในระดับต่ำเป็นวันที่สองติดต่อกัน เคลื่อนไหวอยู่ที่ประมาณ $76.90 ต่อทรอยออนซ์ โลหะเงินยังคงปรับตัวลดลงเนื่องจากความตึงเครียดอีกครั้ง และความไม่แน่นอนรอบๆ ช่องแคบฮอร์มุซที่มีความสำคัญเชิงยุทธศาสตร์ อย่างไรก็ตาม เทรดเดอร์ติดตามความคืบหน้าในความเ
goTop
quote