


Top 3 Price Prediction: Bitcoin, Ethereum, Ripple – BTC slides toward breakdown, ETH struggles, XRP loses momentum
- Bitcoin stalls near $73,600 on Friday after declining more than 4.4% so far this week.
- Ethereum drops over 4.5%, retesting the crucial $2,000 support, a daily close below could trigger further losses.
- XRP trades near the key support at $1.30, a firm close below suggests a deeper correction.
Bitcoin (BTC), Ethereum (ETH) and Ripple (XRP) struggle on Friday after correcting over 4.4%, 4.5% and 3% so far this week. BTC is trading below $74,000, ETH dropped to $2,000, and XRP is hovering near $1.30. Momentum indicators for these top three cryptocurrencies by market capitalization suggest bearish strength is gaining traction and poses a risk of deeper losses if key support levels are breached.
Bitcoin bears tighten their grip as key supports crack
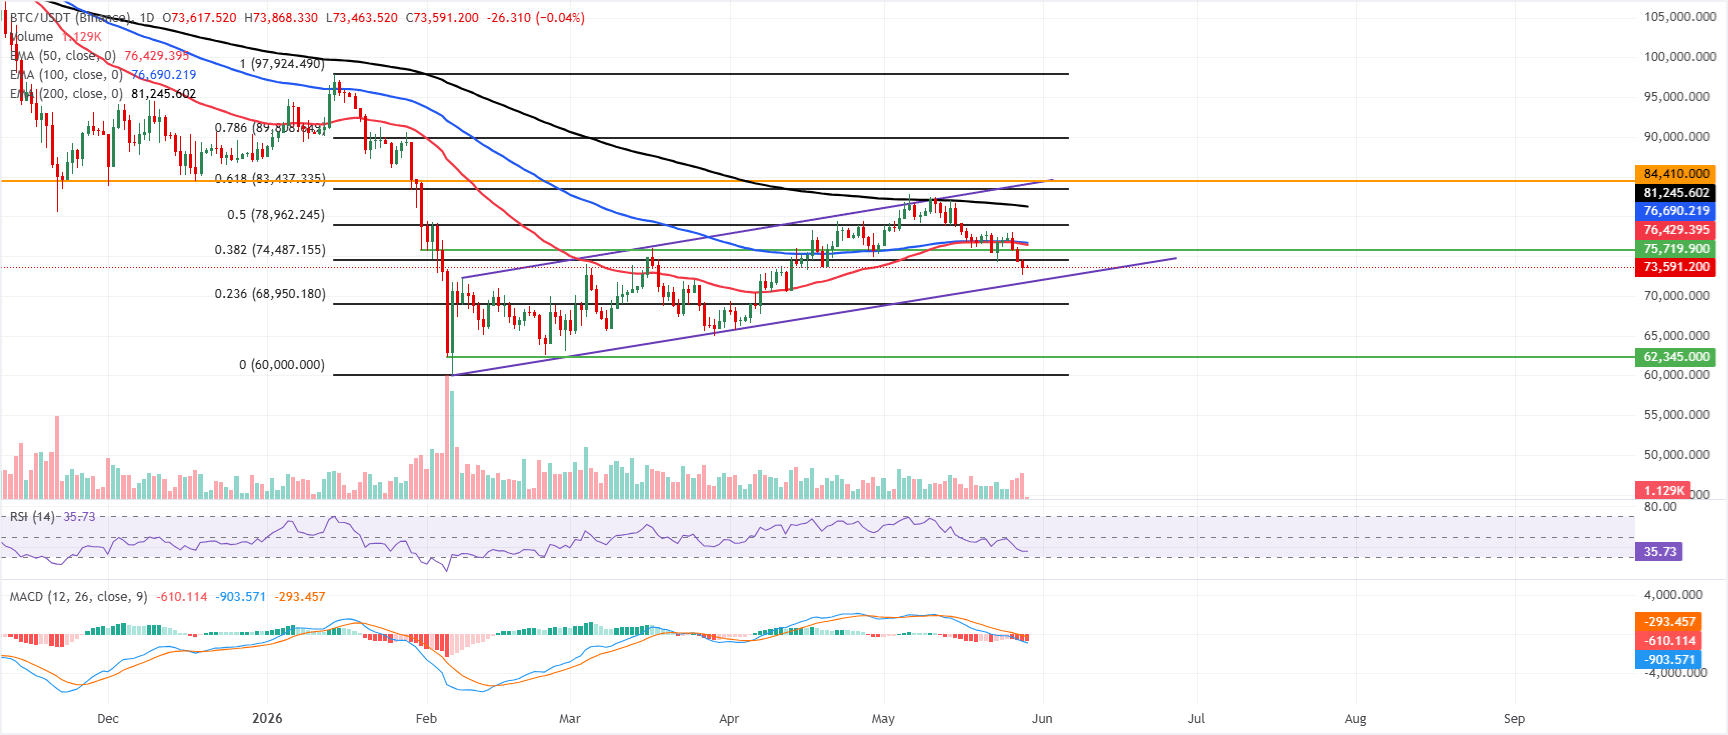
Bitcoin price trades at $73,600, maintaining a bearish near-term bias as it sits beneath the 50-day, 100-day, and 200-day Exponential Moving Averages (EMAs), clustered between roughly $76,430 and $81,226.
The Crypto King has also slipped below the 38.2% Fibonacci retracement at $74,487 of the $60,000–$97,924.49 leg, hinting that recent weakness is extending rather than merely consolidating. The Relative Strength Index (RSI) hovers around 35, indicating bearish momentum but not yet deeply oversold, while the Moving Average Convergence Divergence (MACD) remains negative and below the signal line, reinforcing downside pressure despite intermittent relief bounces.
On the topside, initial resistance appears at the 38.2% Fibonacci retracement at $74,487, with stronger supply emerging near the 50-day EMA at $76,429 and the 100-day EMA at $76,690. Above these, the 50% retracement at $78,962 and the 200-day EMA at $81,225 mark a broader cap ahead of the 61.8% retracement at $83,437 and the horizontal barrier at $84,410.
On the downside, immediate protection is seen around the former trendline break region near $71,727, ahead of the 23.6% retracement at $68,950; a sustained break below this Fibonacci floor would open the door to a deeper corrective leg within the broader uptrend.
Ethereum drops to $2,000
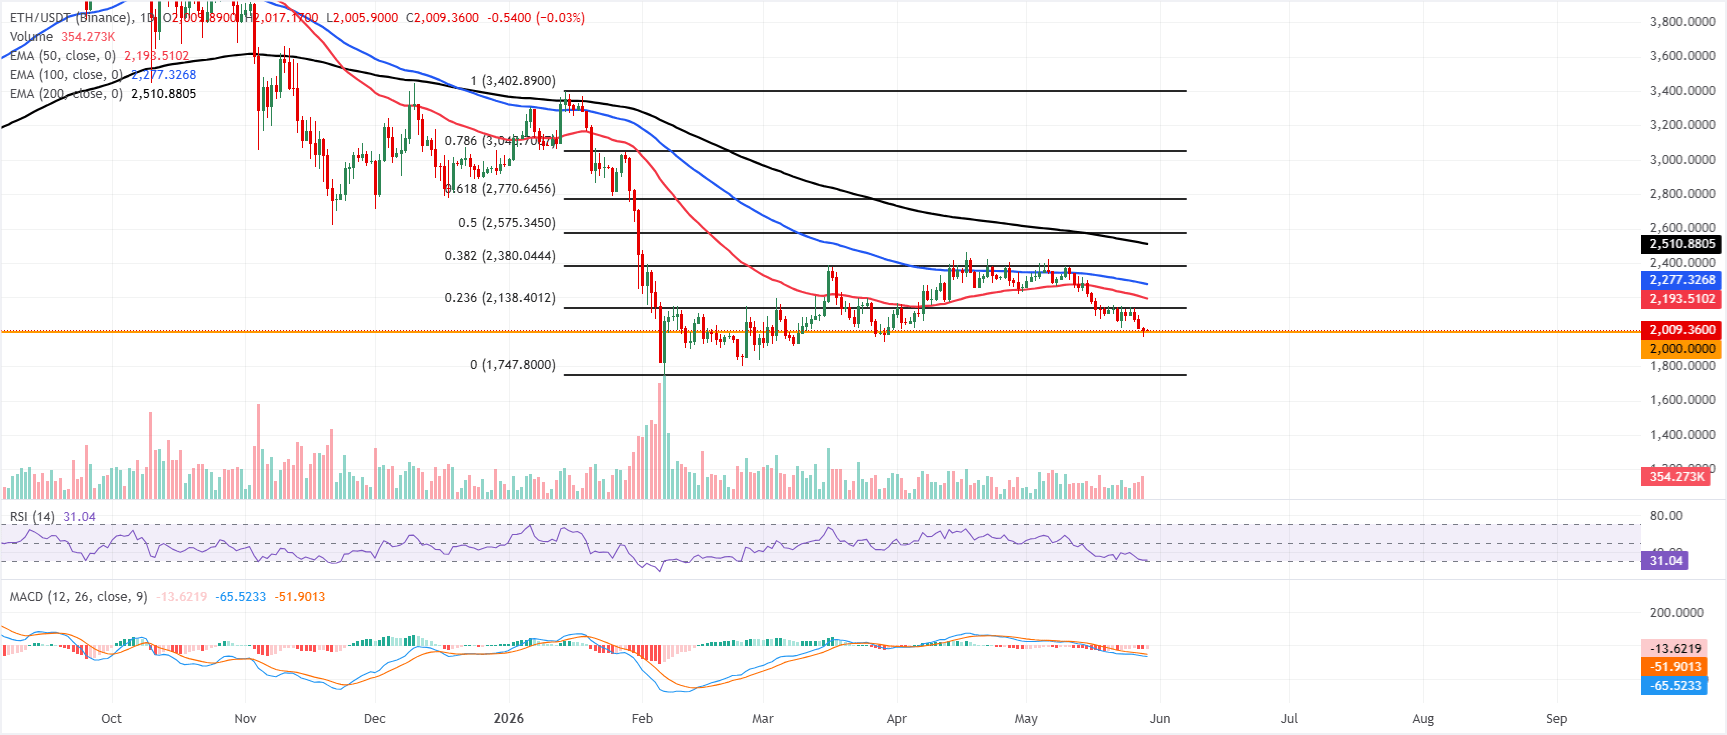
Ethereum price trades at $2,009, maintaining a bearish near-term tone as it holds well below the 50-day, 100-day, and 200-day EMAs, clustered between roughly $2,190 and $2,510. The 23.6% Fibonacci retracement of the latest swing at about $2,138 and the 50-day EMA near $2,193 form the first band of overhead supply, while the 100-day EMA around $2,277 and the 38.2% retracement close to $2,380 reinforce the broader downside bias.
Momentum indicators echo the weak structure, with the RSI on the daily chart hovering just above oversold territory at 31 and the MACD remaining negative, suggesting persistent selling pressure even as the short-term downside may start to look stretched.
On the downside, immediate support is seen at the psychological and horizontal level around $2,000, where a clear break would expose the broader swing low region anchored near the $1,747 Fibonacci base.
On the topside, any bounce is likely to face initial resistance at the 23.6% retracement around $2,138, followed by the 50-day EMA near $2,193; a daily close above these would be needed to ease pressure and allow a corrective move toward the 100-day EMA at about $2,277 and the 38.2% retracement near $2,380, while the 200-day EMA up at roughly $2,511 remains a more distant cap within the prevailing bearish framework.
XRP could extend losses if it closes below $1.300 support
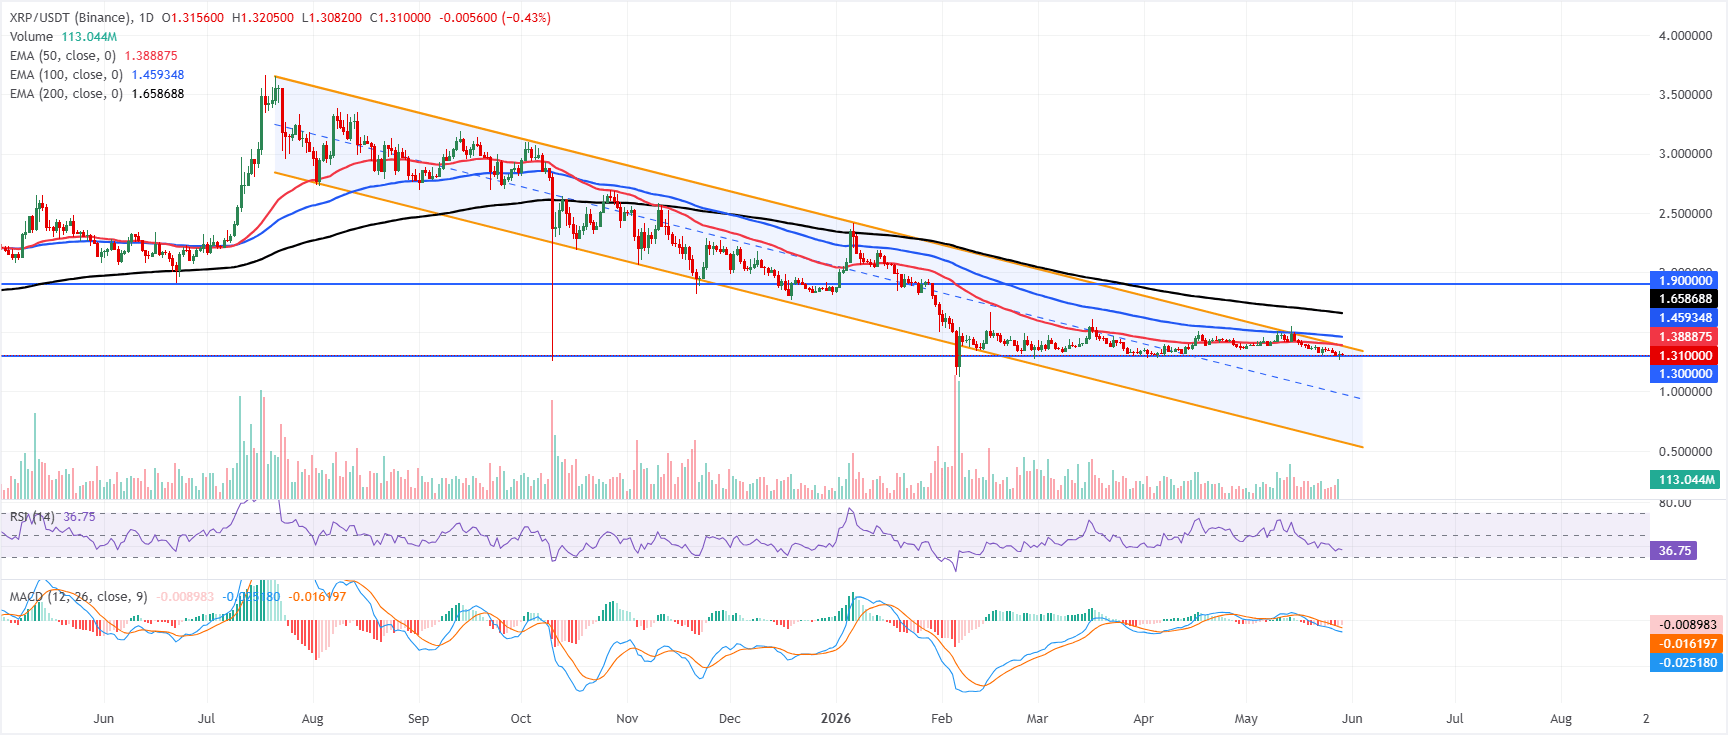
XRP trades at $1.310, maintaining a bearish near-term bias as price remains below the 50-day, 100-day, and 200-day EMAs. XRP also sits below the descending parallel channel ceiling around $1.382, underscoring persistent topside pressure. Momentum corroborates the soft tone, with the RSI hovering in the mid-30s and the MACD remaining in negative territory, suggesting ongoing downside risk, while rebounds are likely to be sold.
On the topside, initial resistance is seen at the channel boundary near $1.382, followed by the 50-day EMA around $1.388; above that, the 100-day EMA near $1.459 and the 200-day EMA near $1.658 form a broader supply band ahead of the horizontal barrier at $1.900.
On the downside, immediate support is aligned with the horizontal floor at $1.300, and a clear break below this level would likely open the door to a deeper extension of the prevailing downtrend.
(The technical analysis of this story was written with the help of an AI tool.)
Cryptocurrency prices FAQs
Token launches influence demand and adoption among market participants. Listings on crypto exchanges deepen the liquidity for an asset and add new participants to an asset’s network. This is typically bullish for a digital asset.
A hack is an event in which an attacker captures a large volume of the asset from a DeFi bridge or hot wallet of an exchange or any other crypto platform via exploits, bugs or other methods. The exploiter then transfers these tokens out of the exchange platforms to ultimately sell or swap the assets for other cryptocurrencies or stablecoins. Such events often involve an en masse panic triggering a sell-off in the affected assets.
Macroeconomic events like the US Federal Reserve’s decision on interest rates influence crypto assets mainly through the direct impact they have on the US Dollar. An increase in interest rate typically negatively influences Bitcoin and altcoin prices, and vice versa. If the US Dollar index declines, risk assets and associated leverage for trading gets cheaper, in turn driving crypto prices higher.
Halvings are typically considered bullish events as they slash the block reward in half for miners, constricting the supply of the asset. At consistent demand if the supply reduces, the asset’s price climbs.
บทความแนะนำ


