

Ethereum Price Forecast: ETH jumps alongside a spike in open interest, realized price could limit upside
Ethereum price today: $2,150
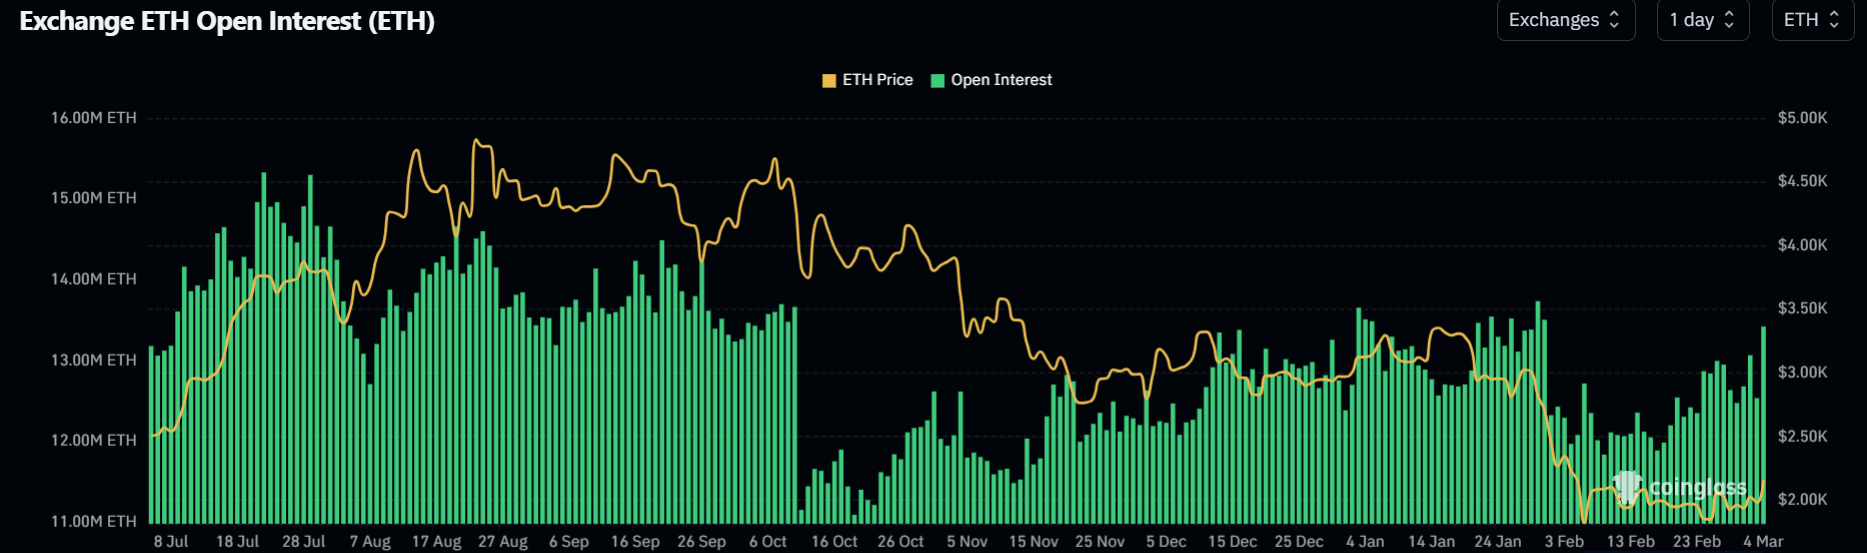
- Ethereum has reclaimed $2,100 as its open interest rose to 13.43M ETH following improved sentiment across risk assets.
- ETH's average onchain cost basis could stall further price gains as investors may distribute after breaking even.
- ETH could test the 50-day EMA if it sees a daily close above $2,108.
Ethereum (ETH) has jumped above $2,100 on Wednesday, following a general recovery across the crypto market.
The move was accompanied by a spike in Ethereum's open interest (OI), which has increased to 13.43M ETH — its highest level since January 31. The top altcoin's OI has been rising since February 19, adding 1.2M ETH over the past two weeks. The growth comes amid $152 million in Ethereum liquidations over the past 24 hours, dominated by $129 million in short liquidations, according to Coinglass data.
Open interest is the total worth of outstanding contracts in a derivatives market. A jump in OI indicates that investors are building positions again.
Despite ETH's OI increase, funding rates have continued to show consistent negative and positive readings, indicating uncertainty from investors.
Meanwhile, ETH is approaching the average onchain cost basis of investors, or its realized price, at $2,300 following its recent rise. Historically, a rise toward the realized price tends to spark short-term distribution, as some investors favor a move to the sidelines after breaking even. However, a firm move above the level could establish it as a key support level.
-1772660780819-1772660780820.png)
The recent rise in ETH follows positive sentiment across risk assets after a New York Times report on Wednesday alleged that operatives from the Iranian Ministry of Intelligence indirectly reached out to US intelligence agencies with a ceasefire offer.
Ethereum Price Forecast: ETH breaks $2,108 resistance, eyes 50-day EMA
In the daily chart, ETH trades at $2,150. The near-term bias turns mildly bullish as price holds above the 20-day Exponential Moving Average (EMA), which has flattened and is now edging higher, signaling a shift from correction to early recovery within a broader downtrend that remains capped by the declining 50-day EMA near $2,298.
The Relative Strength Index (RSI) at 53 is above its neutral level, confirming improving upside momentum after oversold readings seen in recent weeks. On the other hand, the Stochastic Oscillator (Stoch) pushing into overbought territory near 91 signals stretched short-term conditions that would favor dips rather than fresh breakdowns if a pullback unfolds.
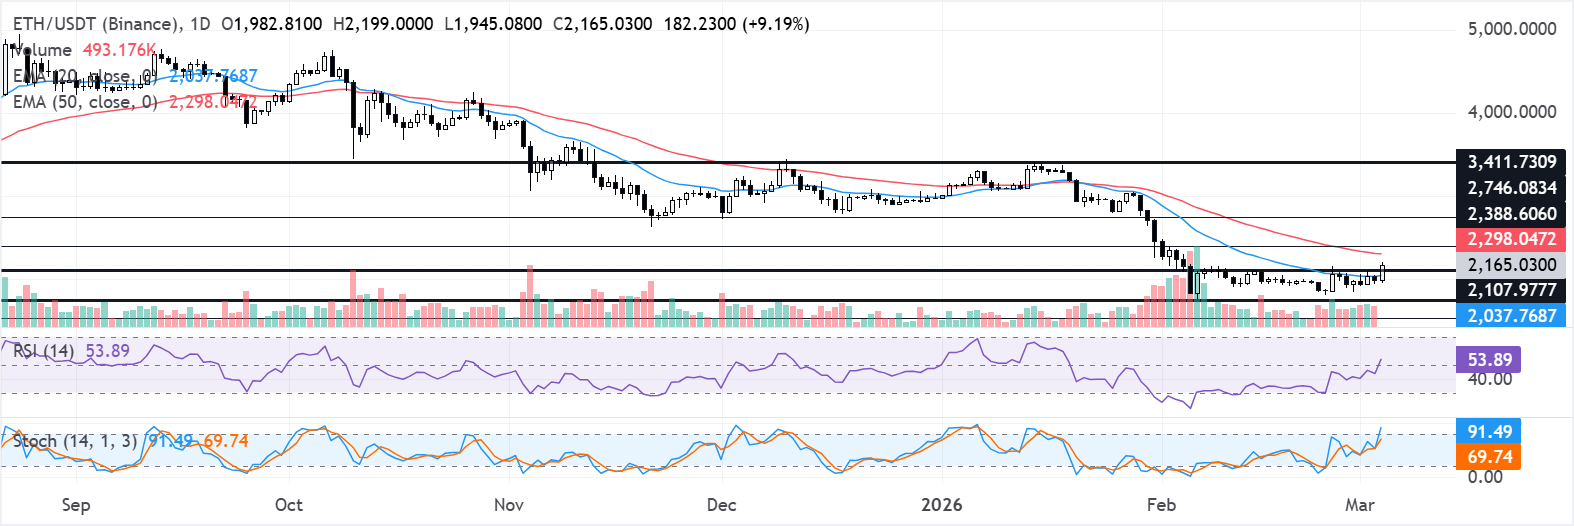
Immediate support appears at $2,108, where recent price action converges with the rising 20-day EMA. A break below there would expose the secondary support around $1,741 ahead of $1,524. On the upside, initial resistance is located at $2,390, aligning with the zone just beneath the 50-day EMA and marking the first meaningful hurdle for the nascent rebound, followed by $2,746 and then $3,411 if buyers extend control.
A sustained move above $2,108 keeps the short-term bullish bias intact, while a daily close below that level would weaken the recovery structure and refocus attention on the lower supports.
(The technical analysis of this story was written with the help of an AI tool.)
บทความแนะนำ


