

Ripple Price Forecast: XRP steadies above $2.00 as supply in profit drops to 13-month low
- XRP remains above short-term support at $2.00, with the 50, 100, and 200-day EMAs capping potential rebounds.
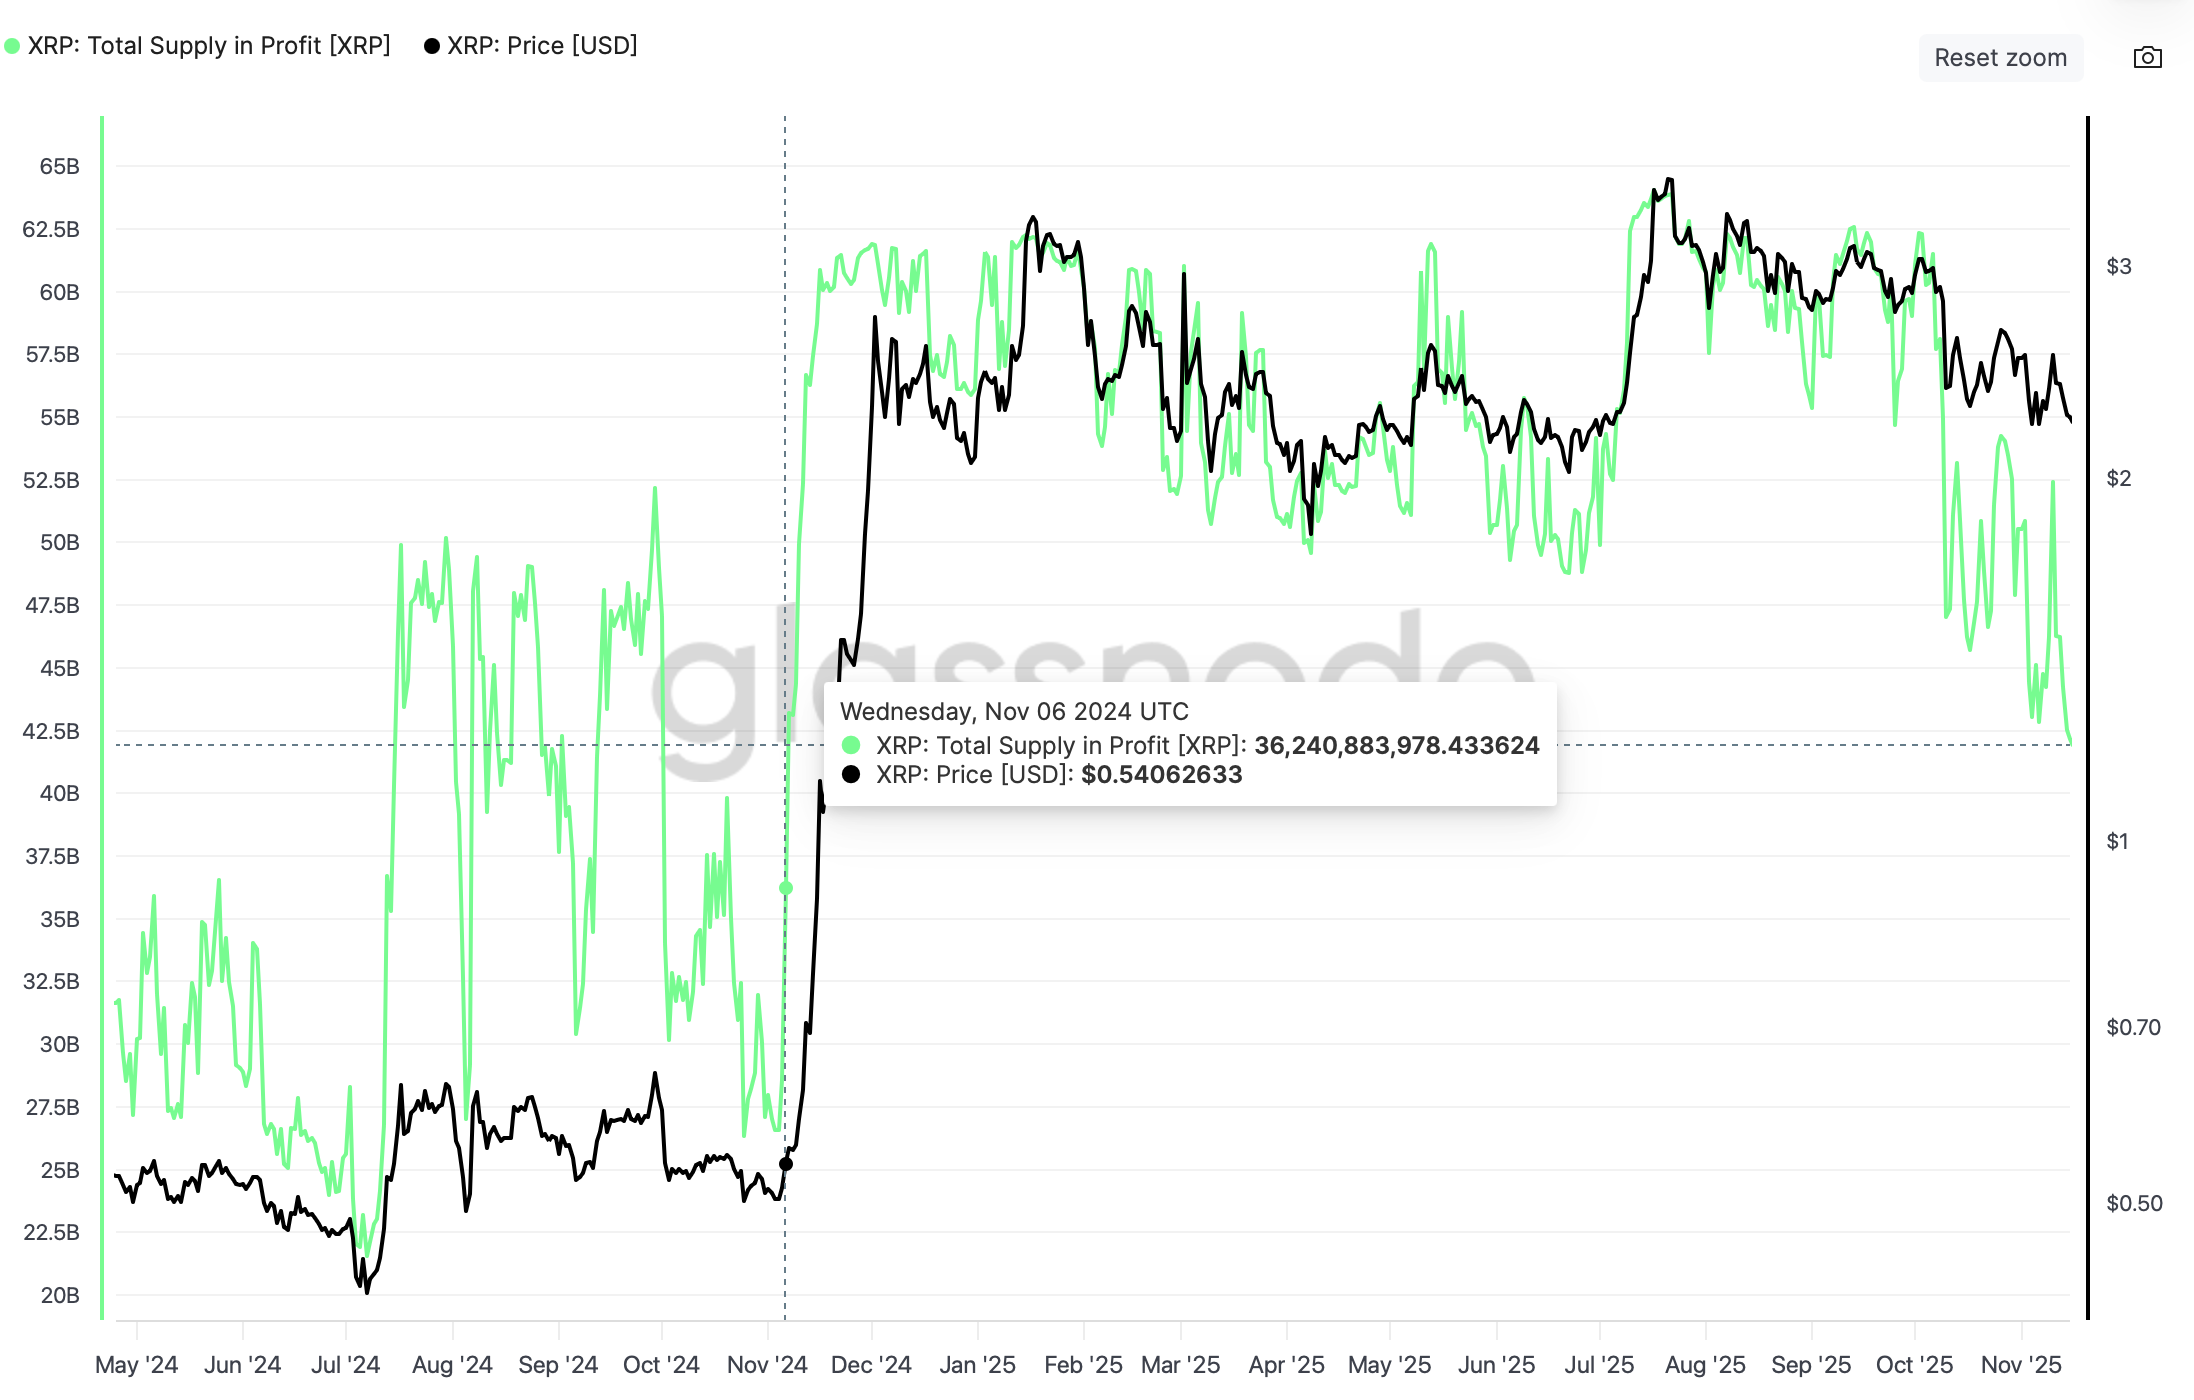
- Supply in profit drops to 42 billion XRP, matching levels last seen in November 2024.
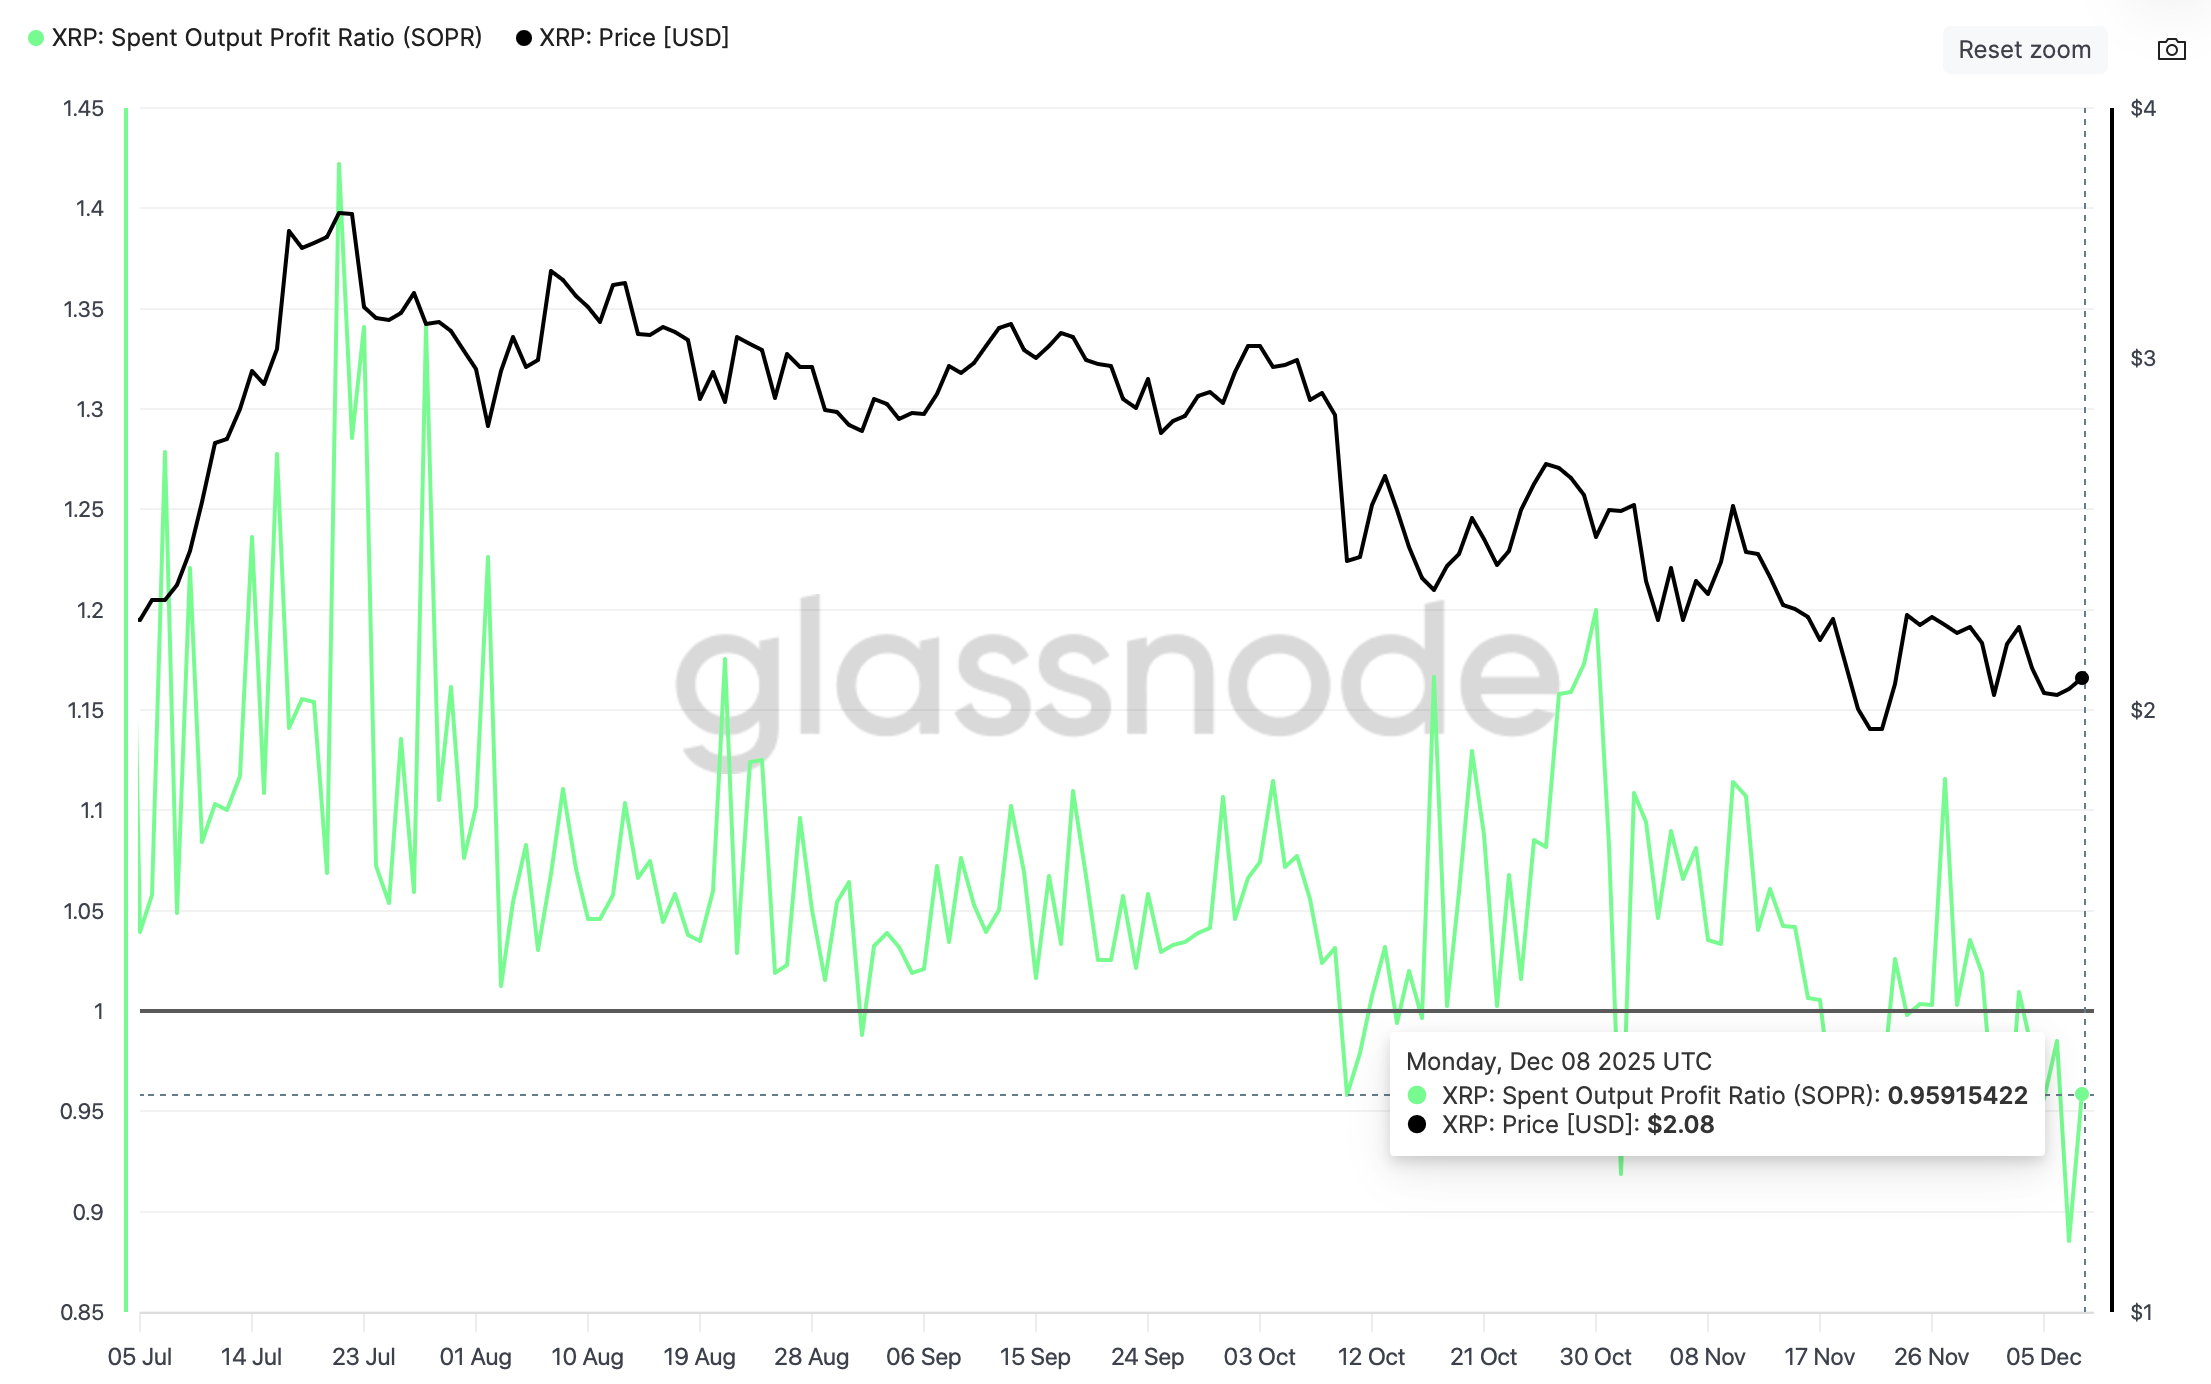
- XRP SOPR resets toward the mean line, hinting at a potential price rebound despite persistent risk-off sentiment.
Ripple (XRP) is extending its consolidation above a key $2.00 support level at the time of writing on Tuesday, as the broader cryptocurrency market struggles with increasing macroeconomic uncertainty.
The Federal Reserve (Fed) is expected to release its monetary policy decision on Wednesday. According to the CME FedWatch Tool, approximately 87% of interest rate traders are expecting a 25-basis-point cut. It would be positive for riskier assets like XRP, Bitcoin (BTC) and Ethereum (ETH) if the Fed lowers interest rates.
However, leaving the rates unchanged may hurt the crypto market as a whole, which could explain the persistent macroeconomic uncertainty.

Can XRP rebound as supply in profit shrinks?
The supply in profit on the XRP Ledger (XRPL) has significantly decreased to 42 billion XRP, from a record high of 68 billion in July. The approximately 38% decline holds near levels last seen in November 2024, suggesting that investors have been taking profit.
,Aggressive selling for profit reduces potential selling pressure, which could pave the way for a rebound in XRP's price. In other words, as supply in profit shrinks, it also narrows the supply available for sale. Traders are unlikely to sell if they are facing unrealized losses.
Still on supply dynamics, the Spent Output Profit Ratio (SOPR) is computed by dividing the price at which tokens were sold by the price paid per token. An SOPR value above 1 indicates that investors are facing unrealized gains and are likely to sell. The higher the value is above the mean line, the higher the risk of a correction.
On the other hand, an SOPR value below 1 indicates that investors are facing unrealized losses. With the current SOPR at 0.9591 and rising, XRP could rebound in the short term.
Technical outlook: XRP extends sideways trading
XRP is trading above its $2.00 short-term support, while the 50-day Exponential Moving Average (EMA) at $2.27, 100-day EMA at $2.43 and 200-day EMA at $2.47 slope lower, affirming an overall bearish outlook. The SuperTrend indicator on the daily chart sits at $2.39, reinforcing overhead resistance and keeping rallies capped.
The Relative Strength Index at 45 (neutral) on the same chart shows only modest improvement. A move above 50 could tilt momentum to the upside. Still, the descending trend line from the $3.66 record high limits gains, with resistance seen near $2.60.
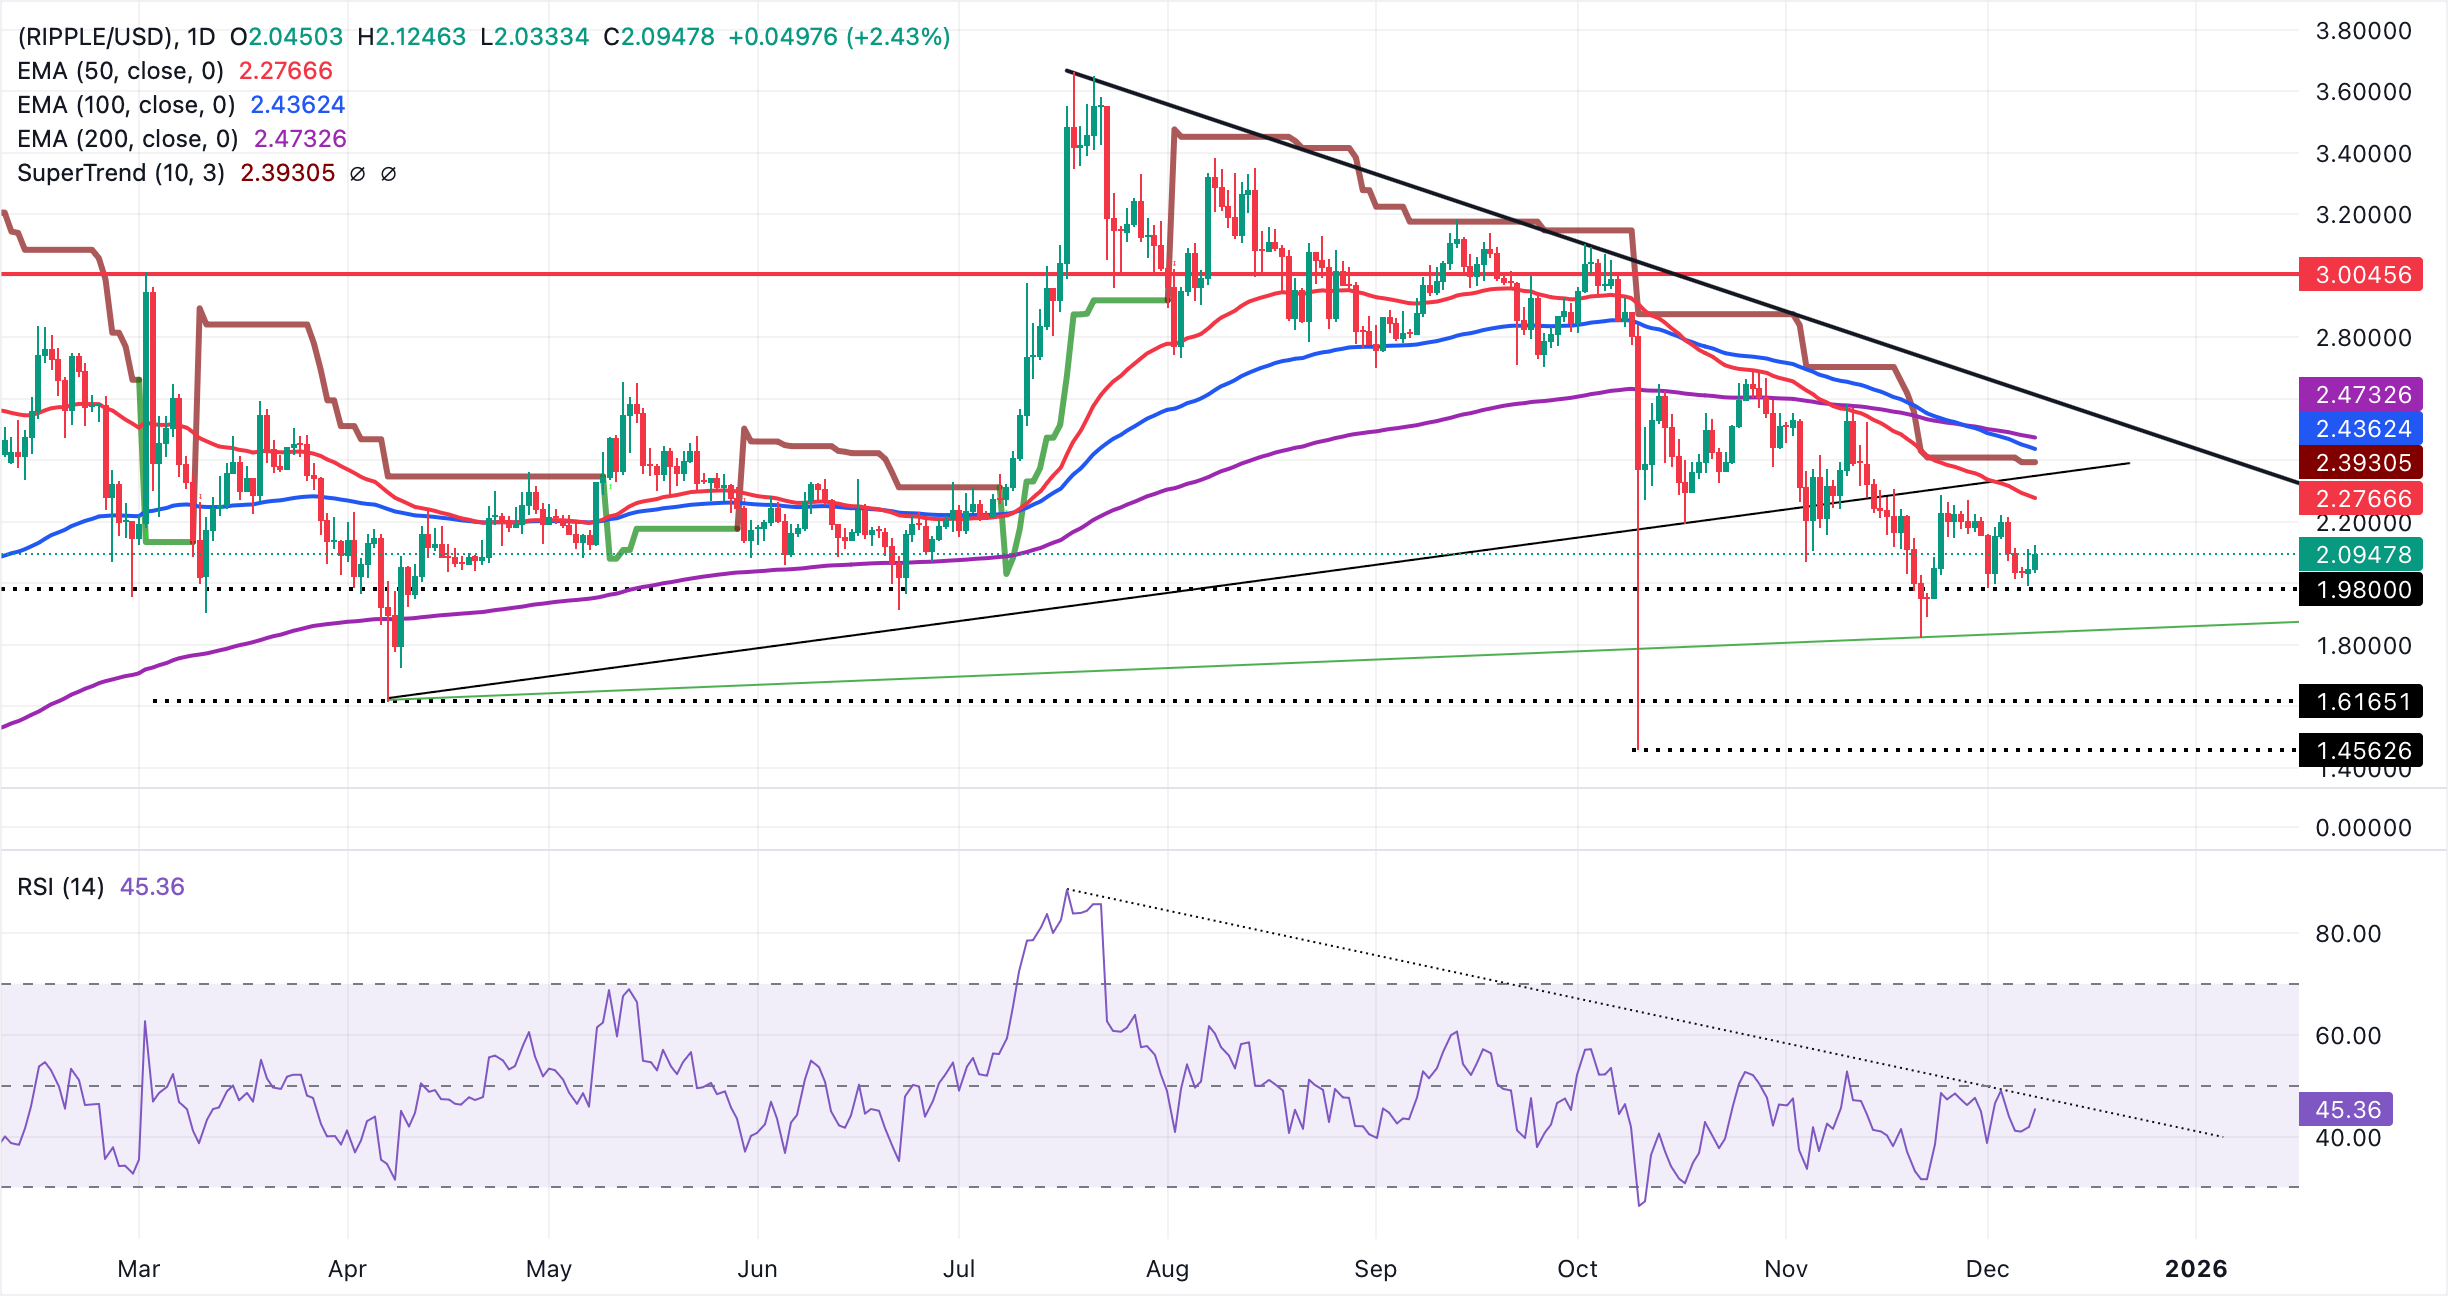
Initial resistance is concentrated between the 50-day and 100-day EMAs at $2.27–$2.43, with $2.60 as a higher barrier on a break of the descending line. On the downside, the rising trend line from $1.62 offers support near $1.82. Reclaiming the 50-day EMA at $2.27 would ease downward pressure and open room for an extended push upward.
Cryptocurrency metrics FAQs
The developer or creator of each cryptocurrency decides on the total number of tokens that can be minted or issued. Only a certain number of these assets can be minted by mining, staking or other mechanisms. This is defined by the algorithm of the underlying blockchain technology. On the other hand, circulating supply can also be decreased via actions such as burning tokens, or mistakenly sending assets to addresses of other incompatible blockchains.
Market capitalization is the result of multiplying the circulating supply of a certain asset by the asset’s current market value.
Trading volume refers to the total number of tokens for a specific asset that has been transacted or exchanged between buyers and sellers within set trading hours, for example, 24 hours. It is used to gauge market sentiment, this metric combines all volumes on centralized exchanges and decentralized exchanges. Increasing trading volume often denotes the demand for a certain asset as more people are buying and selling the cryptocurrency.
Funding rates are a concept designed to encourage traders to take positions and ensure perpetual contract prices match spot markets. It defines a mechanism by exchanges to ensure that future prices and index prices periodic payments regularly converge. When the funding rate is positive, the price of the perpetual contract is higher than the mark price. This means traders who are bullish and have opened long positions pay traders who are in short positions. On the other hand, a negative funding rate means perpetual prices are below the mark price, and hence traders with short positions pay traders who have opened long positions.
(The technical analysis of this story was written with the help of an AI tool)
บทความแนะนำ


