

Crypto Today: Bitcoin, Ethereum, XRP pare gains despite increasing hopes of upcoming Fed rate cut
- Bitcoin struggles under $94,150 resistance even as investors continue to almost fully price in a Fed rate cut next week.
- Ethereum builds recovery momentum above $3,100, supported by a MACD buy signal.
- XRP edges lower below the 50-, 100, and 200-day EMAs as risk-off sentiment persists.
Bitcoin (BTC) is steadying above $91,000 at the time of writing on Friday. Resistance at $94,150 capped recovery on Wednesday, but in the meantime, bulls have contained downside risks above $90,000.
Ethereum (ETH) remains above $3,100, reflecting positive sentiment ahead of the Federal Reserve's (Fed) monetary policy meeting on December 10. Ripple (XRP), on the other hand, is edging lower toward the $2.00 pivotal level as sentiment surrounding the token remains weak.
Bitcoin, Ethereum, XRP hold firm ahead of Fed monetary policy meeting
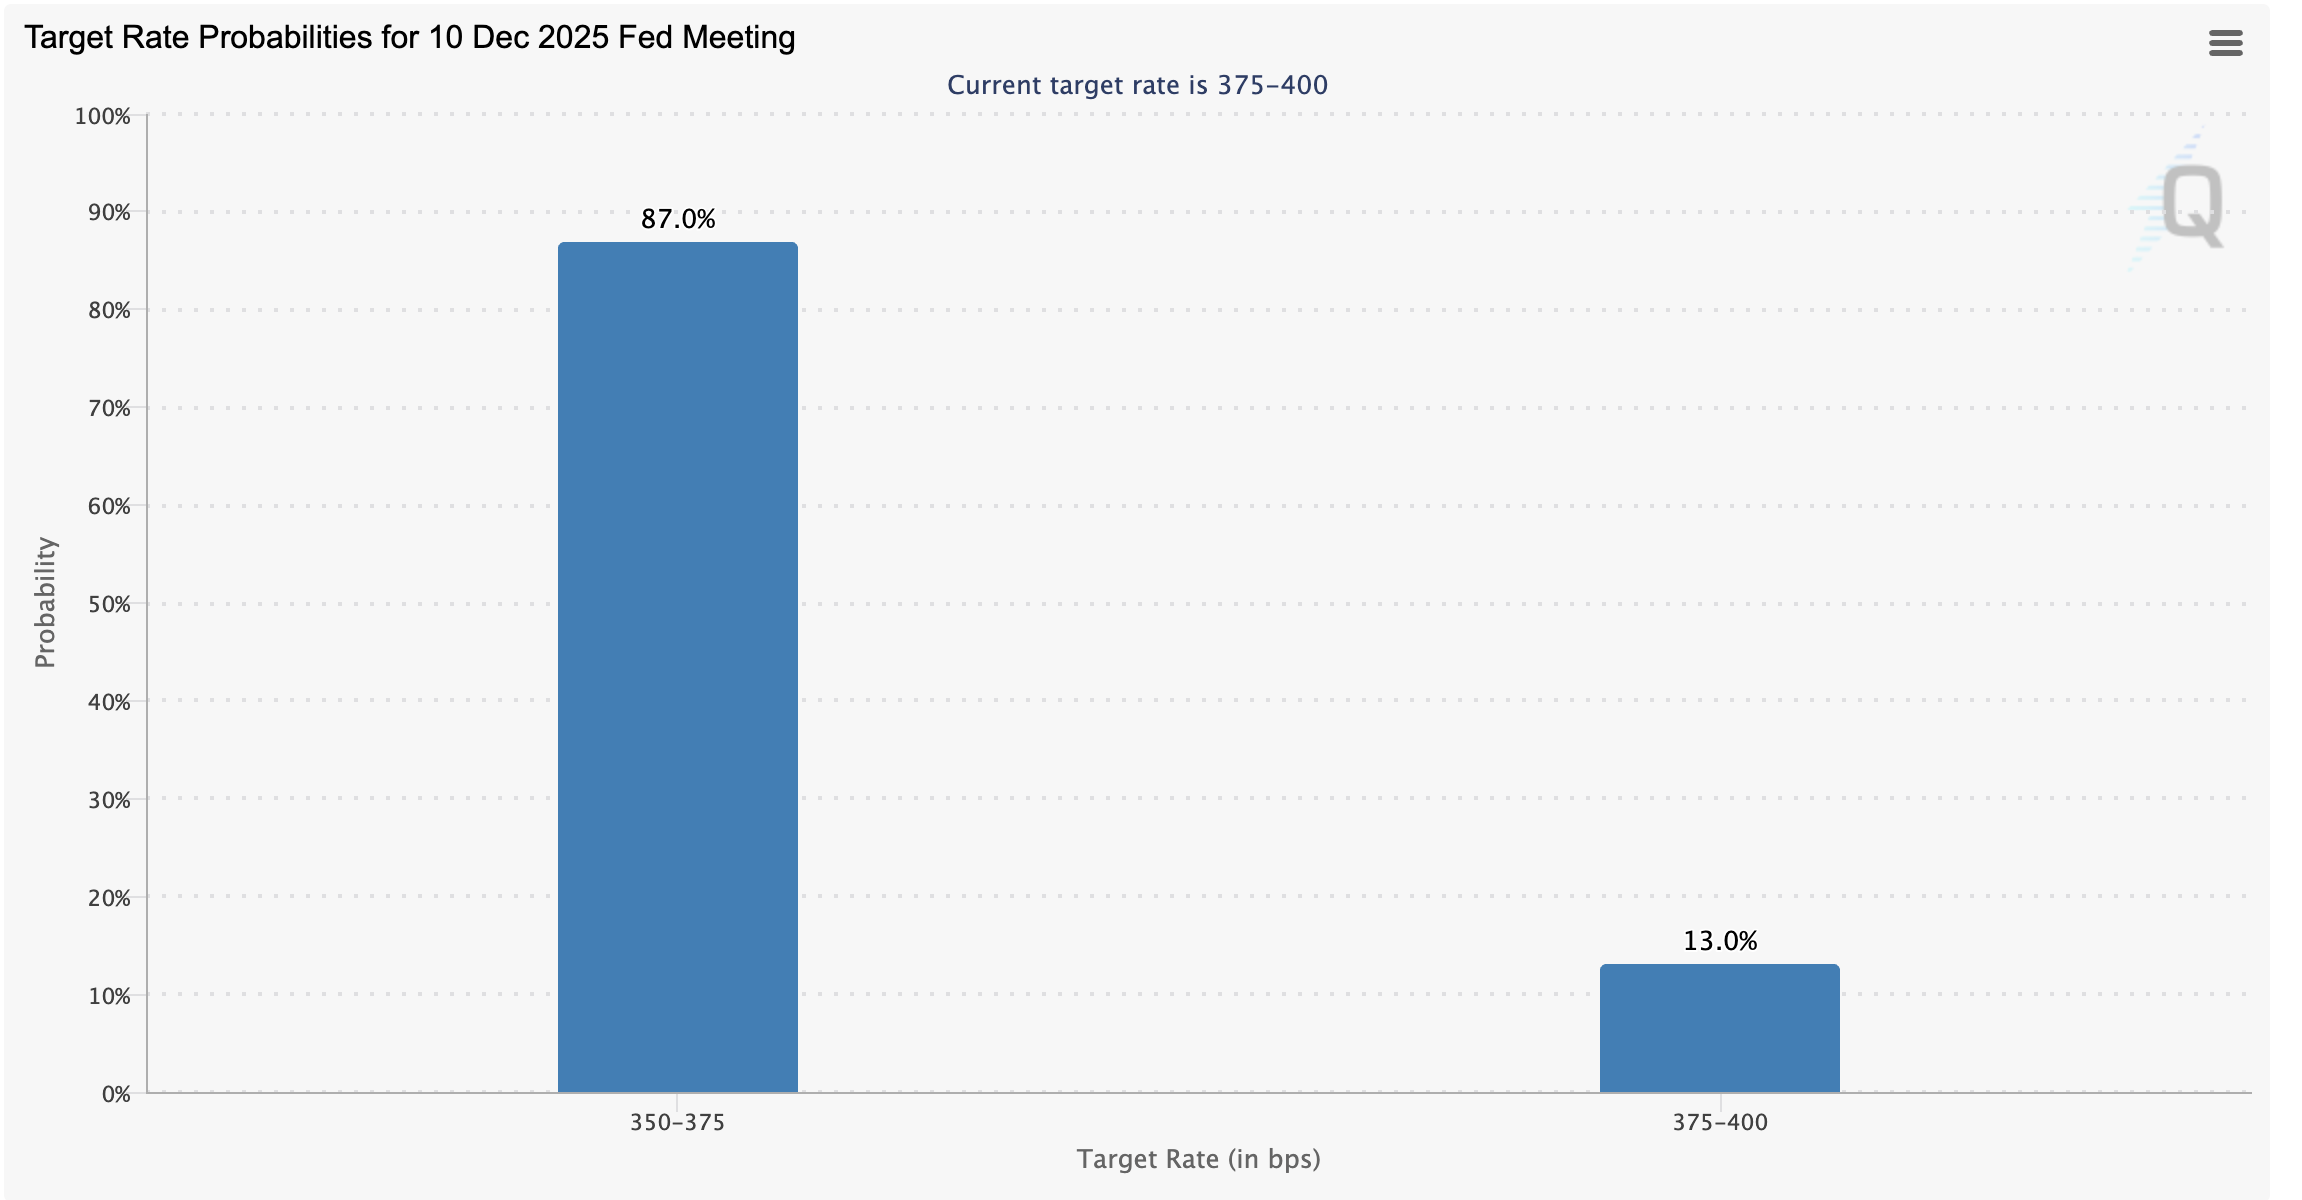
The next Fed interest rate decision is expected on December 10, and markets, including crypto, are pricing in an 87% probability of a 25-basis-point cut from 3.75–4.00% to 3.50–3.75%.
If the majority of Fed officials vote in favor of lowering rates by 25 bps, this would mark the third rate cut this year following the reductions in September and October. Market participants highlight a cooling labor market in the United States (US) and slightly easing inflation as the main factors supporting a rate cut.
Fed Chair Jerome Powell said in October that a December rate cut was not guaranteed and that the central bank would base its decision on economic data. The uncertainty surrounding the Fed's monetary policy triggered volatility in the crypto market, with Bitcoin plummeting to near $80,000 on November 21.
Bitcoin has since recovered above $90,000 but remains below a short-term resistance at $94,150. Ethereum shows strength, although its upside is capped below $3,200, while XRP is edging closer to $2.00 at the time of writing.
Chart of the day: Can Bitcoin hold key support?
Bitcoin is trading above the pivotal $91,000 level at the time of writing on Friday, as sellers push to regain control following the recovery from Monday's low of $83,822.
The Moving Average Convergence Divergence (MACD) indicator on the daily chart has maintained a bullish outlook since November 26, when the blue MACD line crossed above the red signal line.
Green historian bars above the mean line reinforce the bullish thesis. However, the indicator remains below the same mean line, which could cap recovery potential.
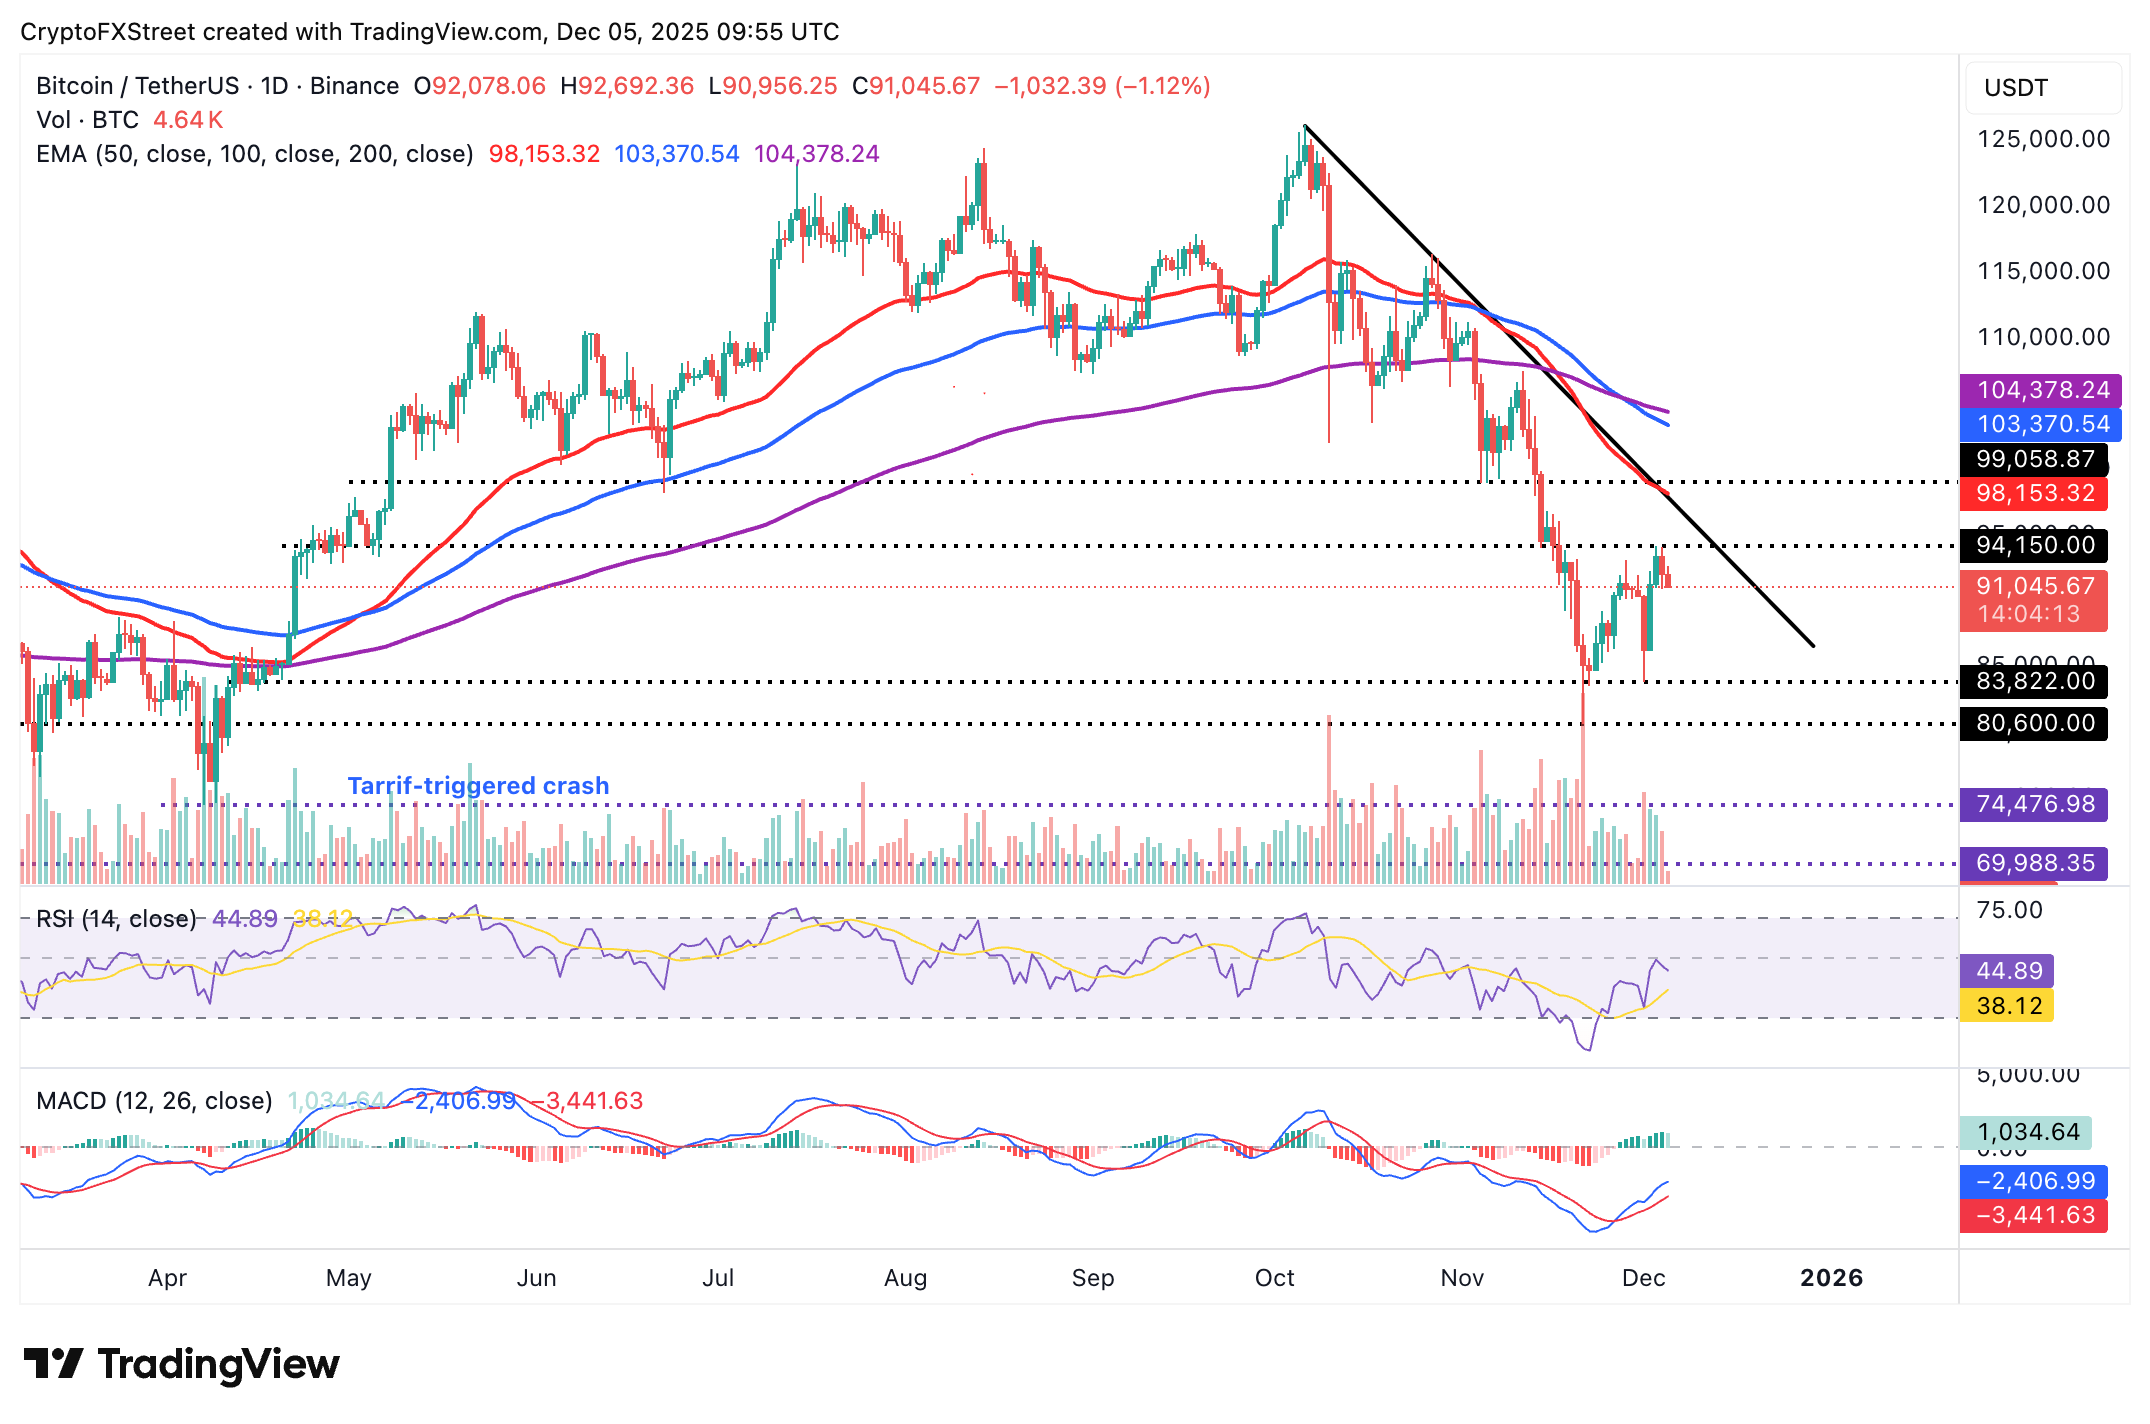
The descending Relative Strength Index (RSI) holds at 44, suggesting increasing bearish momentum. Bitcoin also sits below the 50-day Exponential Moving Average (EMA) at $98,153, the 100-day EMA at 103,370 and the 200-day EMA at $104,378, all of which may limit rebounds. A break below $90,000 could also accelerate the decline toward $80,000.
Altcoins update: Ethereum, XRP upside capped
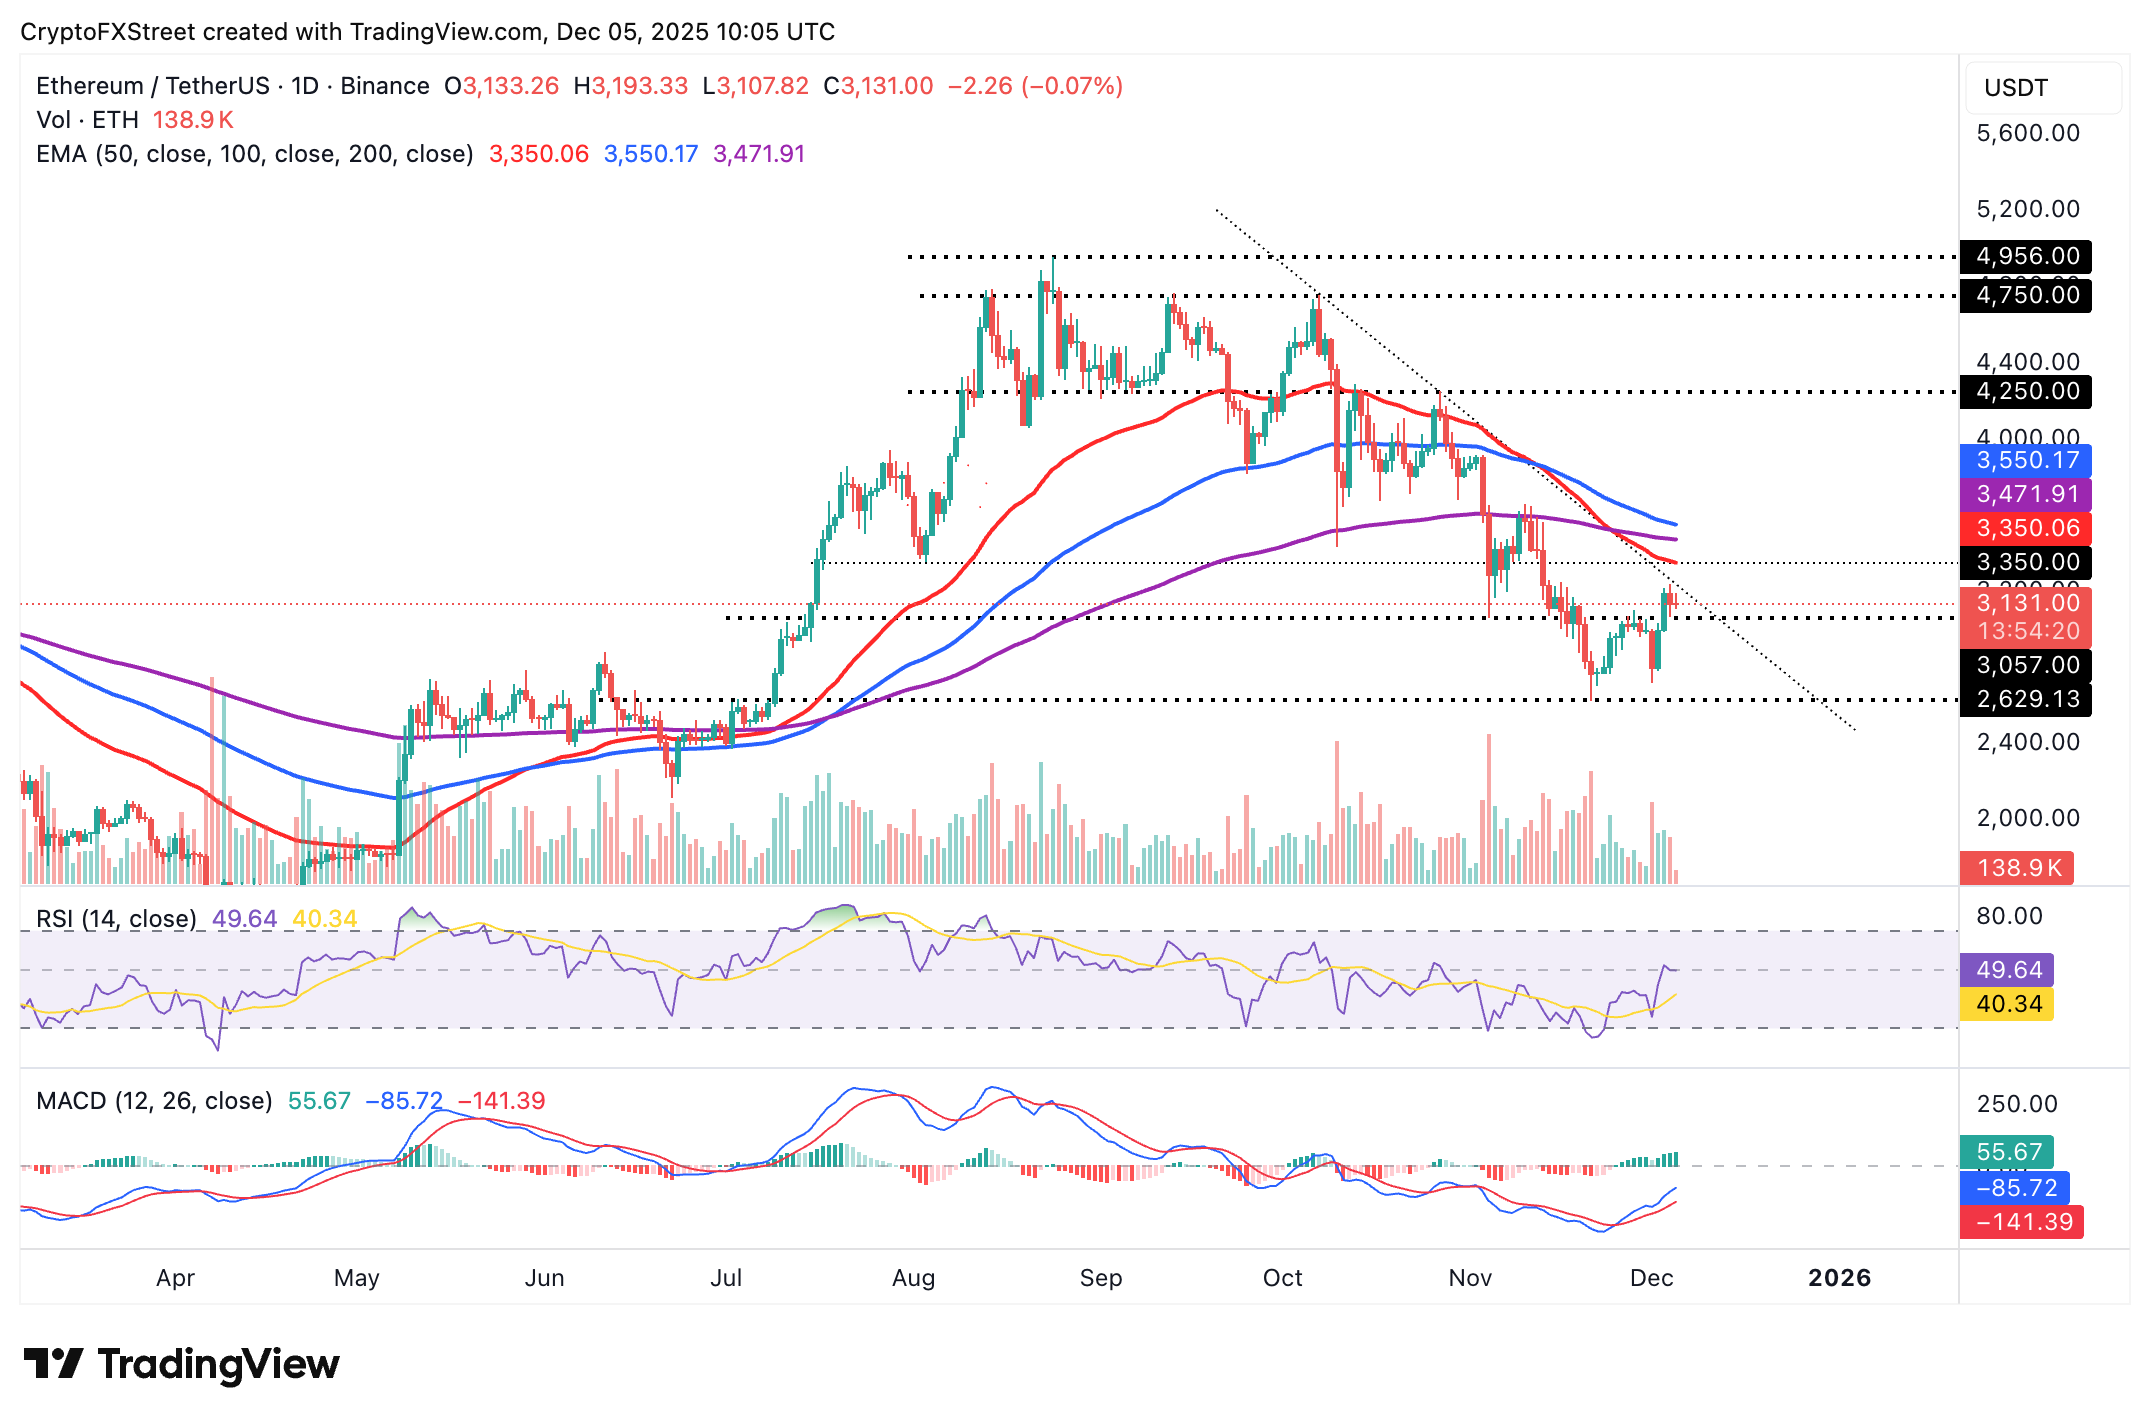
Ethereum is trading above its short-term $3,100 support at the time of writing on Friday. An attempt to push above a descending trendline resistance faltered this week, opening ETH to increasing downside risks.
The RSI on the daily chart has declined slightly below the midline, suggesting a bearish bias. Ethereum also sits below the 50-day EMA at $3,350, the 200-day EMA at $3,471 and the 100-day EMA at $3,550, capping potential rebounds.
Still, the MACD is rising toward the mean line and has maintained a buy signal since November 25. Green histogram bars are expanding above the mean line, indicating increasing bullish momentum. A break above the descending trendline would reinforce the bullish thesis for a breakout toward $4,000.
Meanwhile, XRP is trading at $2.06 at the time of writing, with the price below the declining 50-, 100- and 200-day EMAs, which signal a persistent bearish bias. The 50-day EMA at $2.30 caps rebounds, keeping the near-term tone heavy. The MACD indicator eases in positive territory on the daily chart, with the line hovering near its signal and a contracting histogram suggesting waning momentum.
The RSI at 42 (neutral-to-bearish) underscores limited buying pressure, and the pair would stay under strain while it holds beneath the moving averages.
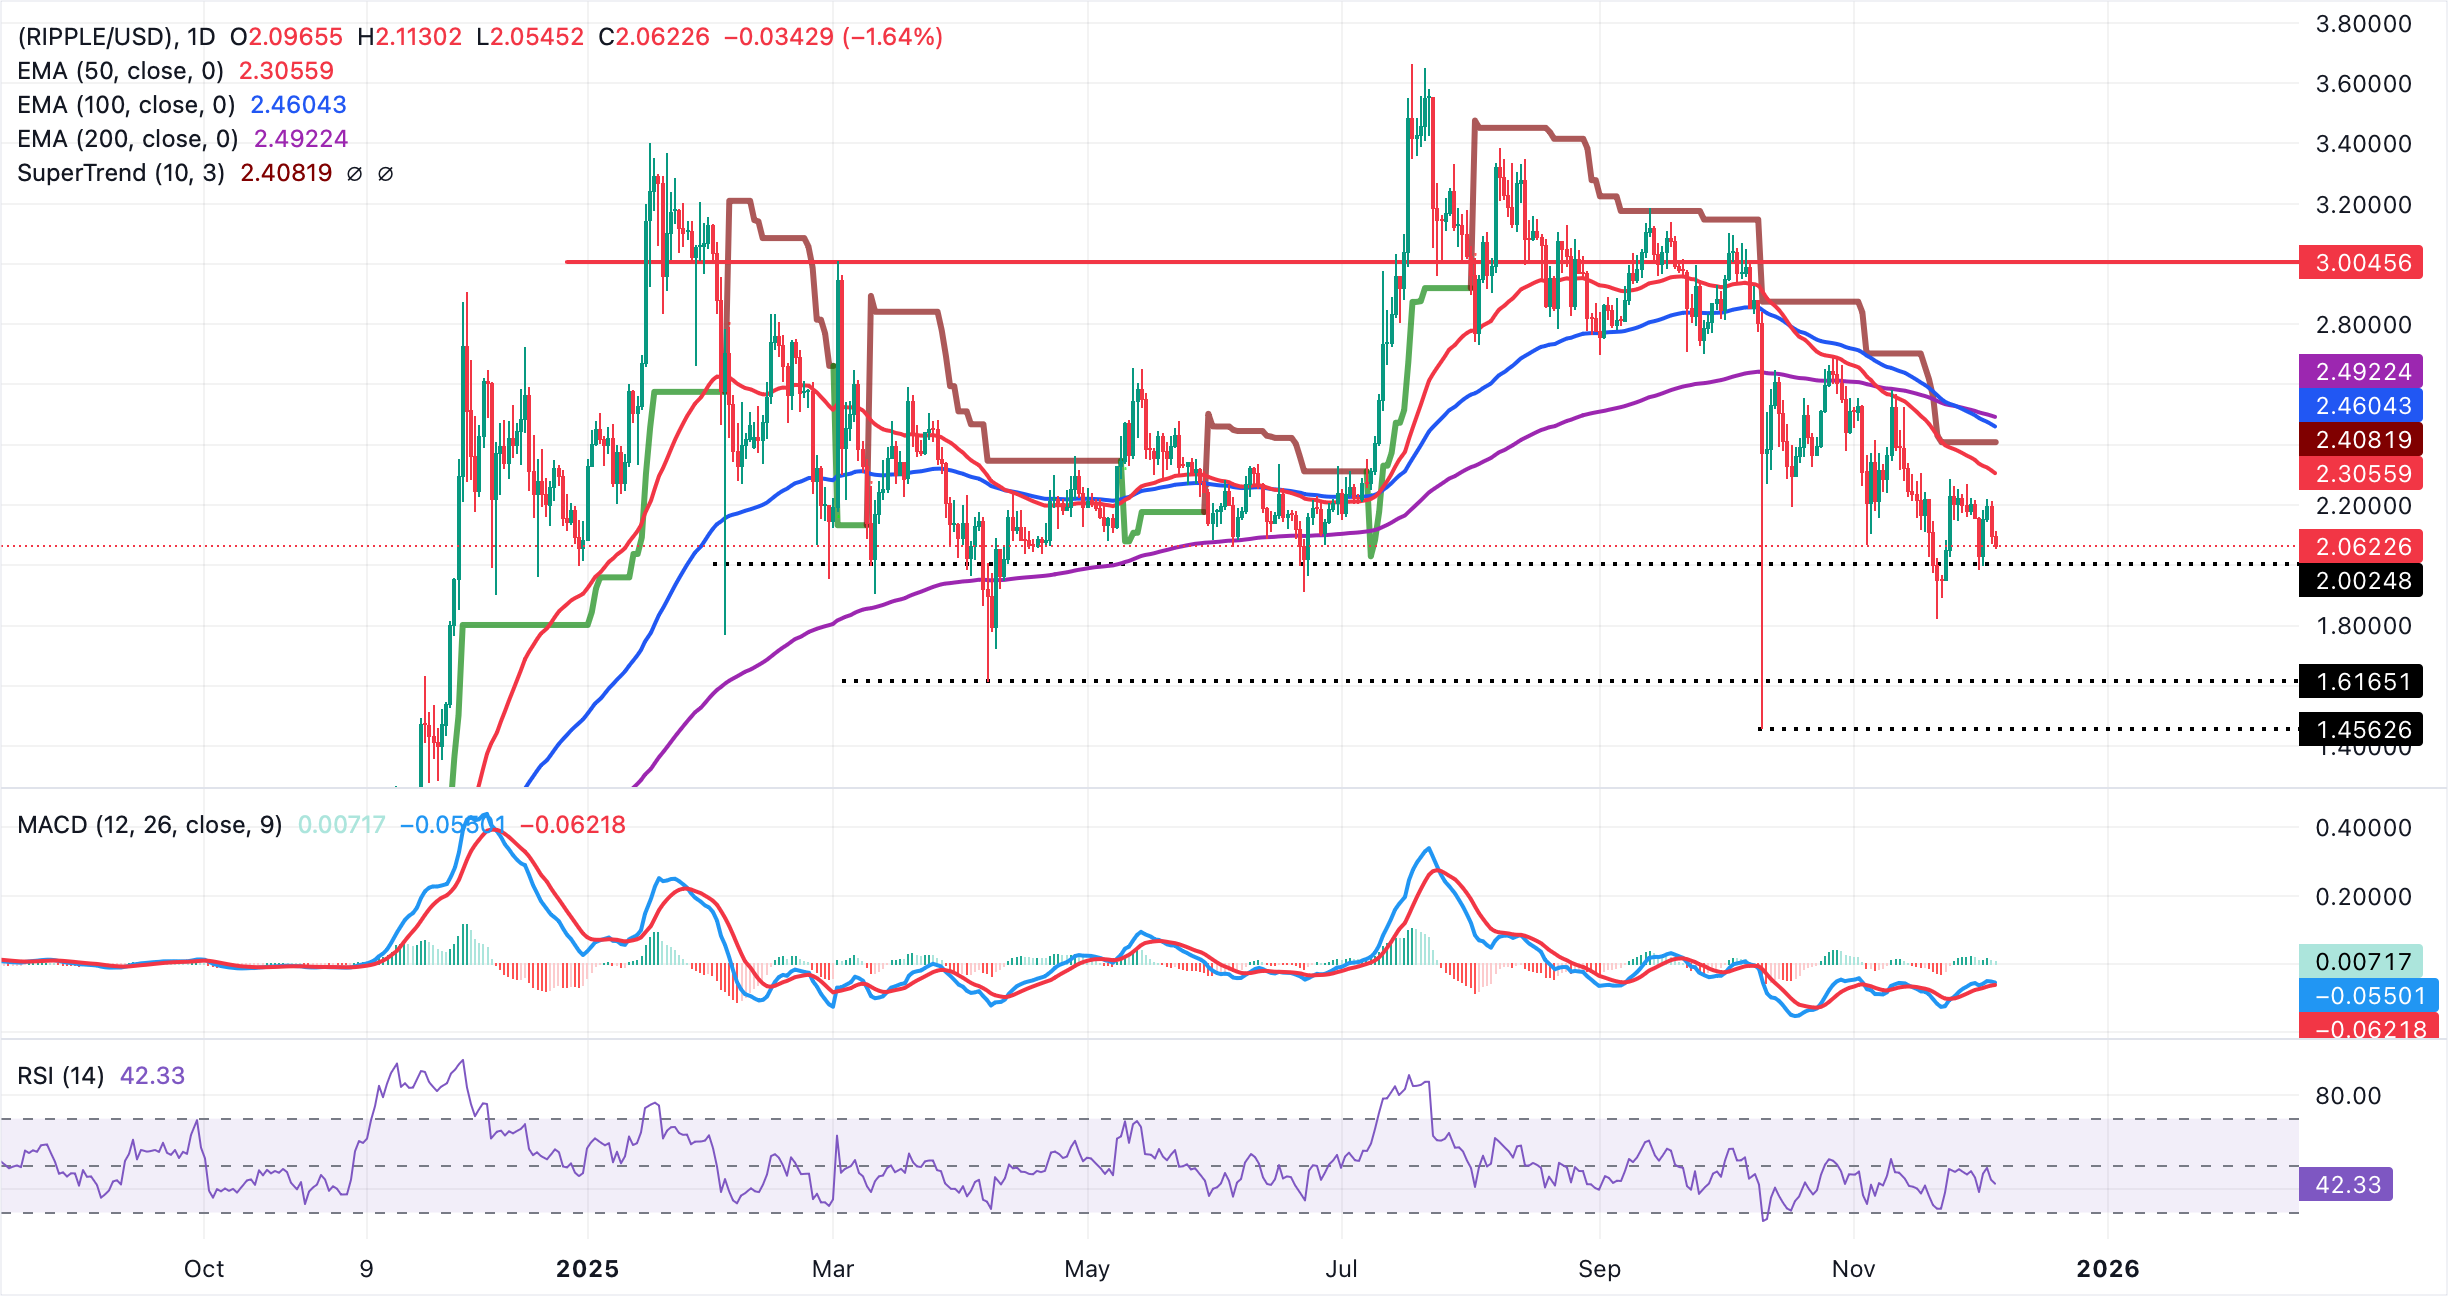
The medium-term picture remains pressured for XRP, with the 100-day EMA at $2.46 and the 200-day EMA at $2.49 forming an upper barrier and extending the cap on rallies. At the same time, the SuperTrend prints at $2.40 as immediate resistance. A break above would expose the $2.46–$2.49 area, whereas failure to clear these levels would keep XRP/USD vulnerable to further consolidation.
Cryptocurrency prices FAQs
Token launches influence demand and adoption among market participants. Listings on crypto exchanges deepen the liquidity for an asset and add new participants to an asset’s network. This is typically bullish for a digital asset.
A hack is an event in which an attacker captures a large volume of the asset from a DeFi bridge or hot wallet of an exchange or any other crypto platform via exploits, bugs or other methods. The exploiter then transfers these tokens out of the exchange platforms to ultimately sell or swap the assets for other cryptocurrencies or stablecoins. Such events often involve an en masse panic triggering a sell-off in the affected assets.
Macroeconomic events like the US Federal Reserve’s decision on interest rates influence crypto assets mainly through the direct impact they have on the US Dollar. An increase in interest rate typically negatively influences Bitcoin and altcoin prices, and vice versa. If the US Dollar index declines, risk assets and associated leverage for trading gets cheaper, in turn driving crypto prices higher.
Halvings are typically considered bullish events as they slash the block reward in half for miners, constricting the supply of the asset. At consistent demand if the supply reduces, the asset’s price climbs.
(The technical analysis of this story was written with the help of an AI tool)
บทความแนะนำ


