

Ripple Price Forecast: XRP surges as weekly asset inflows hit $28 million
- XRP regains momentum, rising above $2.50 on Monday.
- XRP investment product inflows averaged $28 million last week, signaling a return to risk-on sentiment.
- The short-term technical picture turns bullish, supported by a MACD buy signal and an uptrending RSI.
Ripple (XRP) rises alongside crypto majors, including Bitcoin (BTC) and Ethereum (ETH), to trade above $2.50 at the time of writing on Monday. Short-term technical analysis and the return of risk-off sentiment reinforce XRP’s short-term bullish outlook in the broader cryptocurrency market.
XRP fund inflows rise, supporting recovery
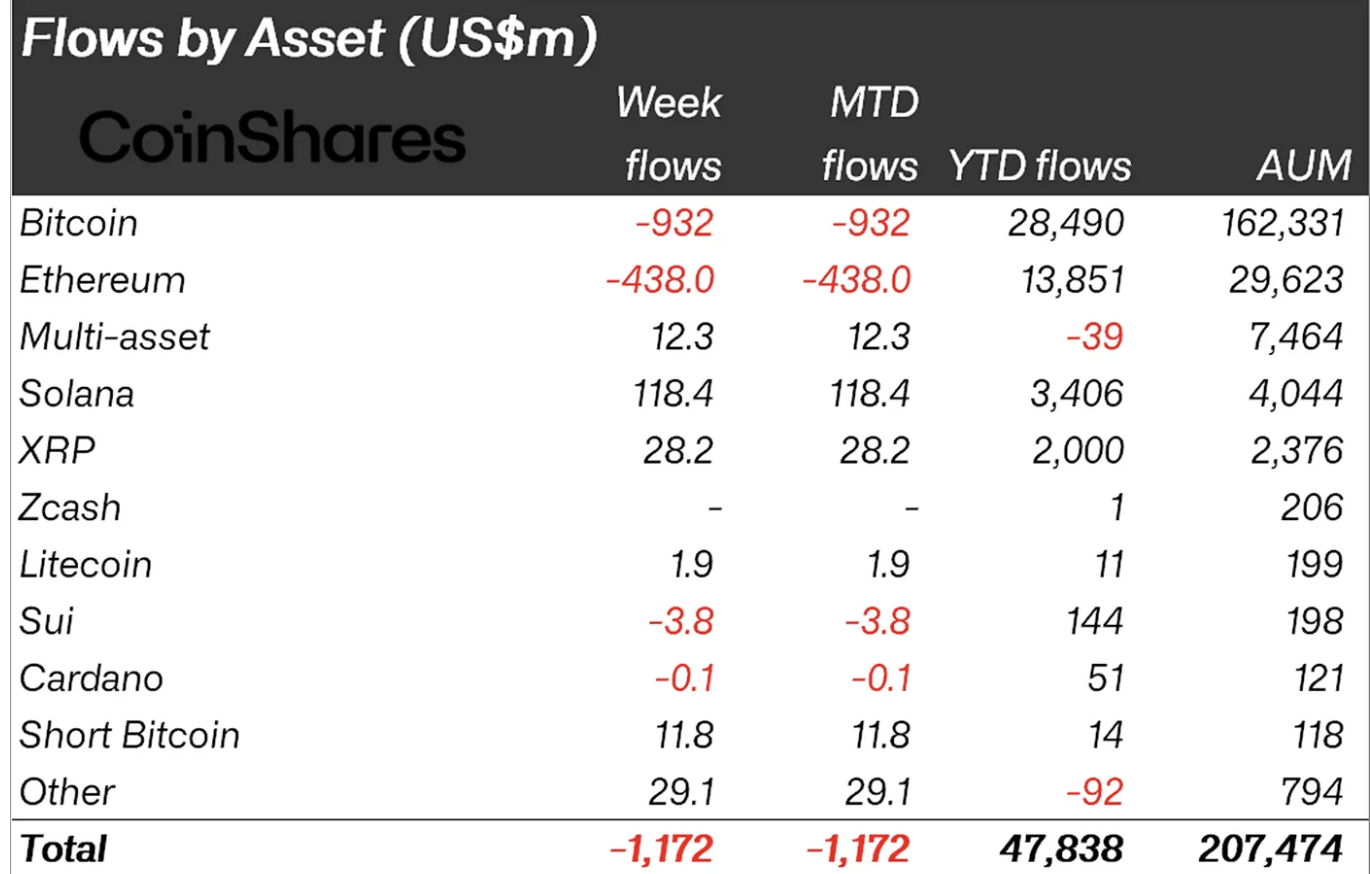
Digital asset investment products experienced outflows last week, except for a few select coins, such as XRP, which recorded inflows, defying risk-off sentiment. According to CoinShares, XRP’s weekly inflow volume averaged $28 million last week, bringing the total assets under management (AUM) to $2.4 billion.
In comparison, Bitcoin and Ethereum faced significant outflows of $932 million and $438 million, respectively. In total, digital asset investment products experienced outflows of $1.17 billion. CoinShares stated that the outflows were due to “post-liquidity cascade volatility and uncertainty over a potential United States (US) rate cut.”
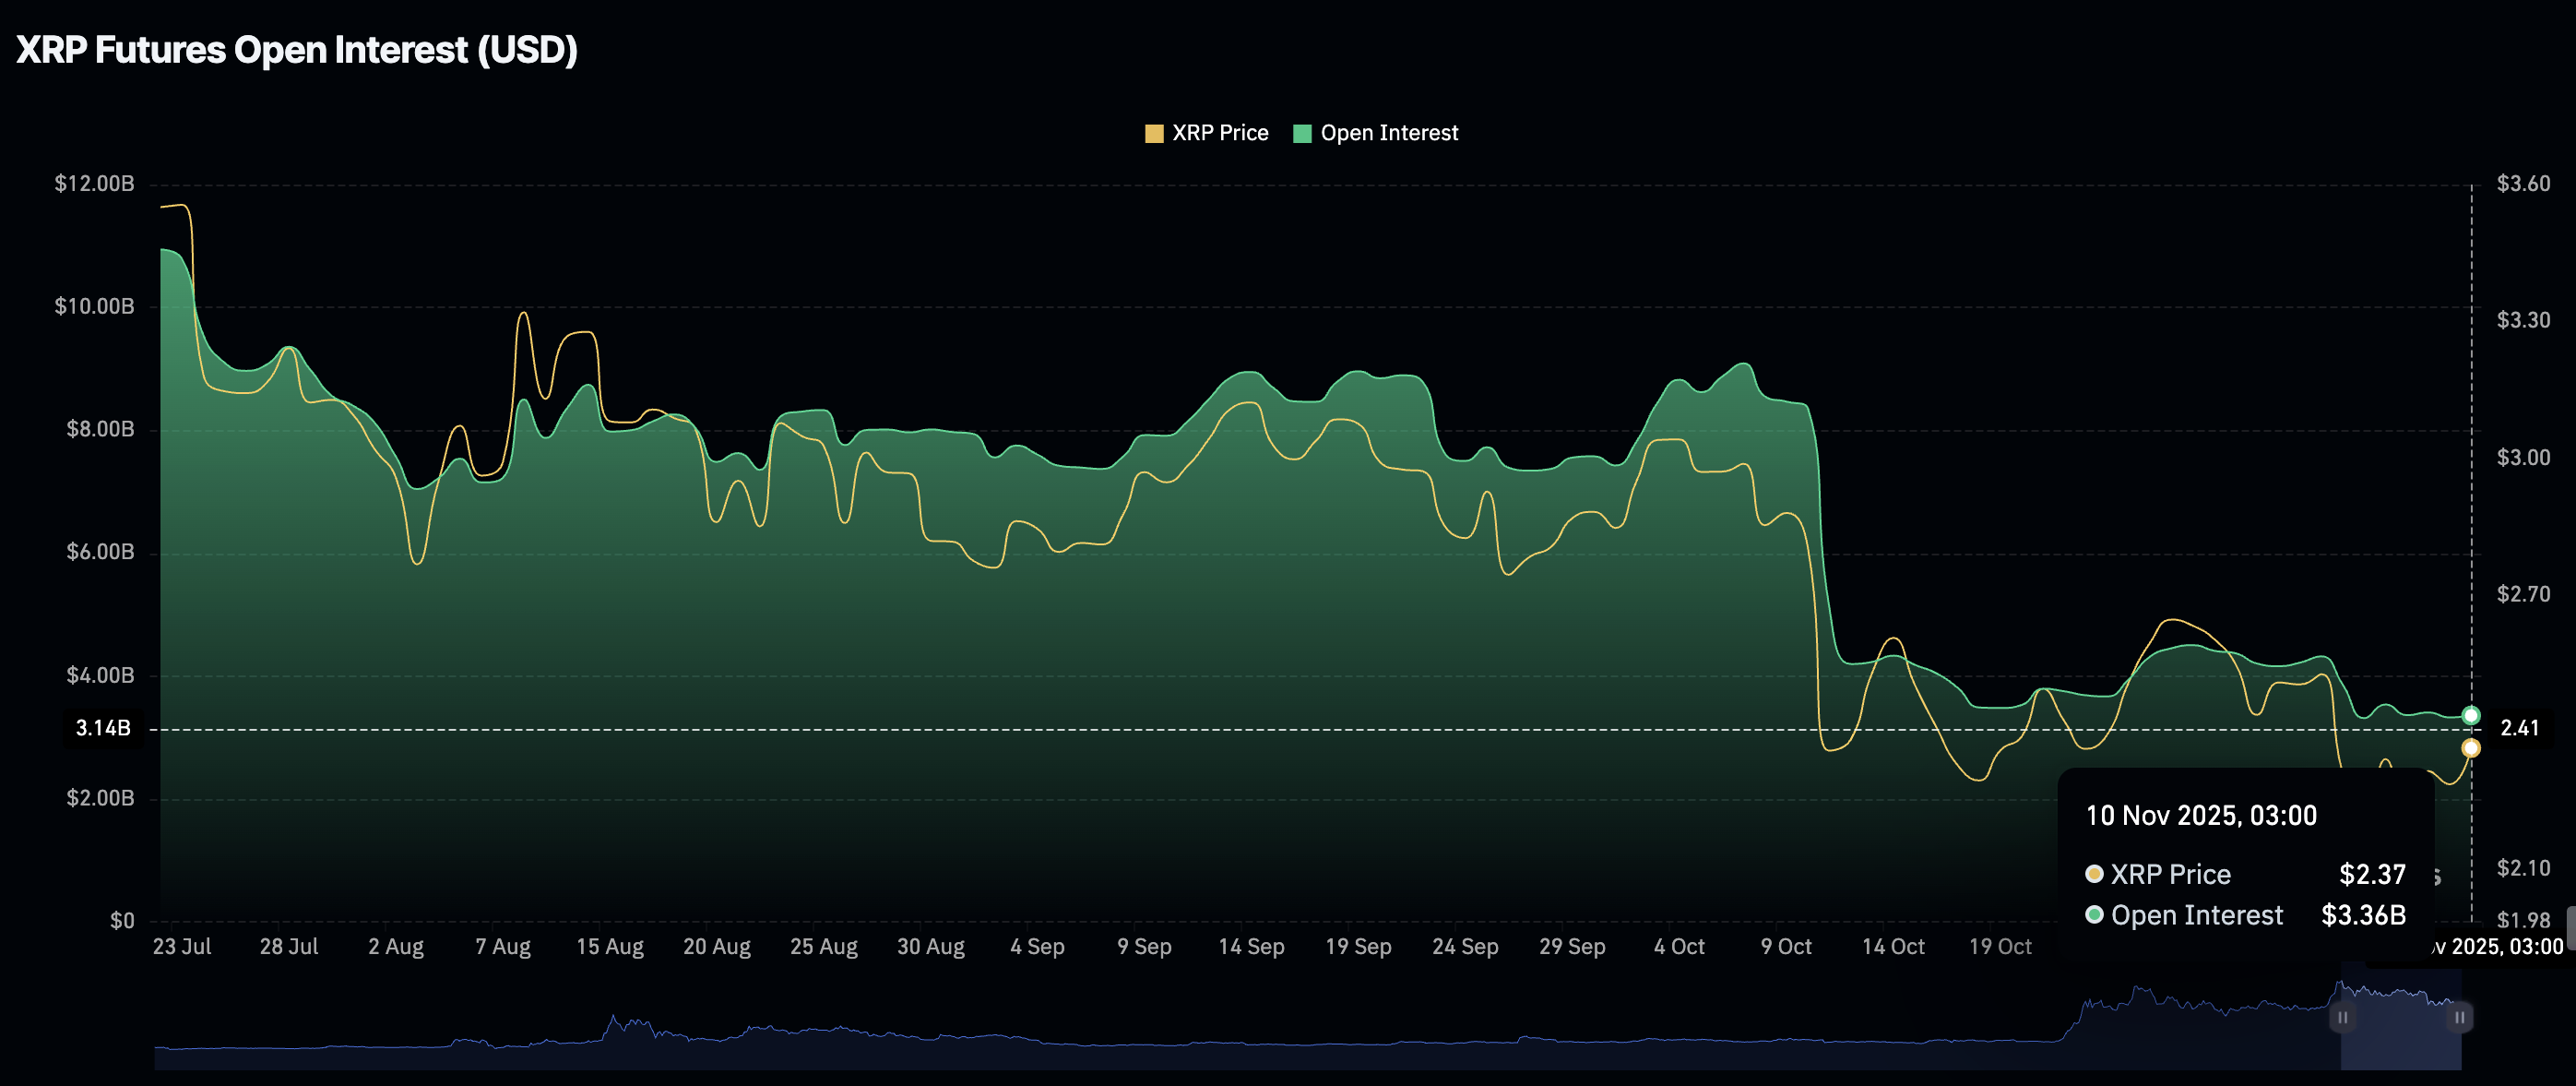
Meanwhile, retail demand for XRO remains relatively low, with the Open Interest (OI) averaging $3.36 billion on Monday compared to $4.17 billion on November 7 and $9 billion, the October peak level.
OI tracks the notional value of outstanding futures contracts, which can be used to gauge investor interest. To sustain the uptrend, more traders should increase their risk exposure. Otherwise, a suppressed OI suggests that traders are not convinced XRP can sustain the uptrend in the short to medium term.
Technical outlook: Evaluating XRP’s recovery potential
XRP is trading above $2.50 at the time of writing on Monday after its intraday uptrend was rejected at $2.57. The 200-period Exponential Moving Average (EMA) provides initial support at $2.49 on the 4-hour chart, which may come in handy if profit-taking continues to dampen recovery.
The Relative Strength Index (RSI) is at 68 on the same daily chart, down from slightly overbought conditions at 71. If the RSI declines further, it would indicate easing of bullish momentum.
Traders will watch for a daily close above the 50-day EMA to ascertain XRP’s bullish outlook, especially with the Moving Average Convergence Divergence (MACD) indicator upholding a buy signal on the daily chart since last Wednesday.
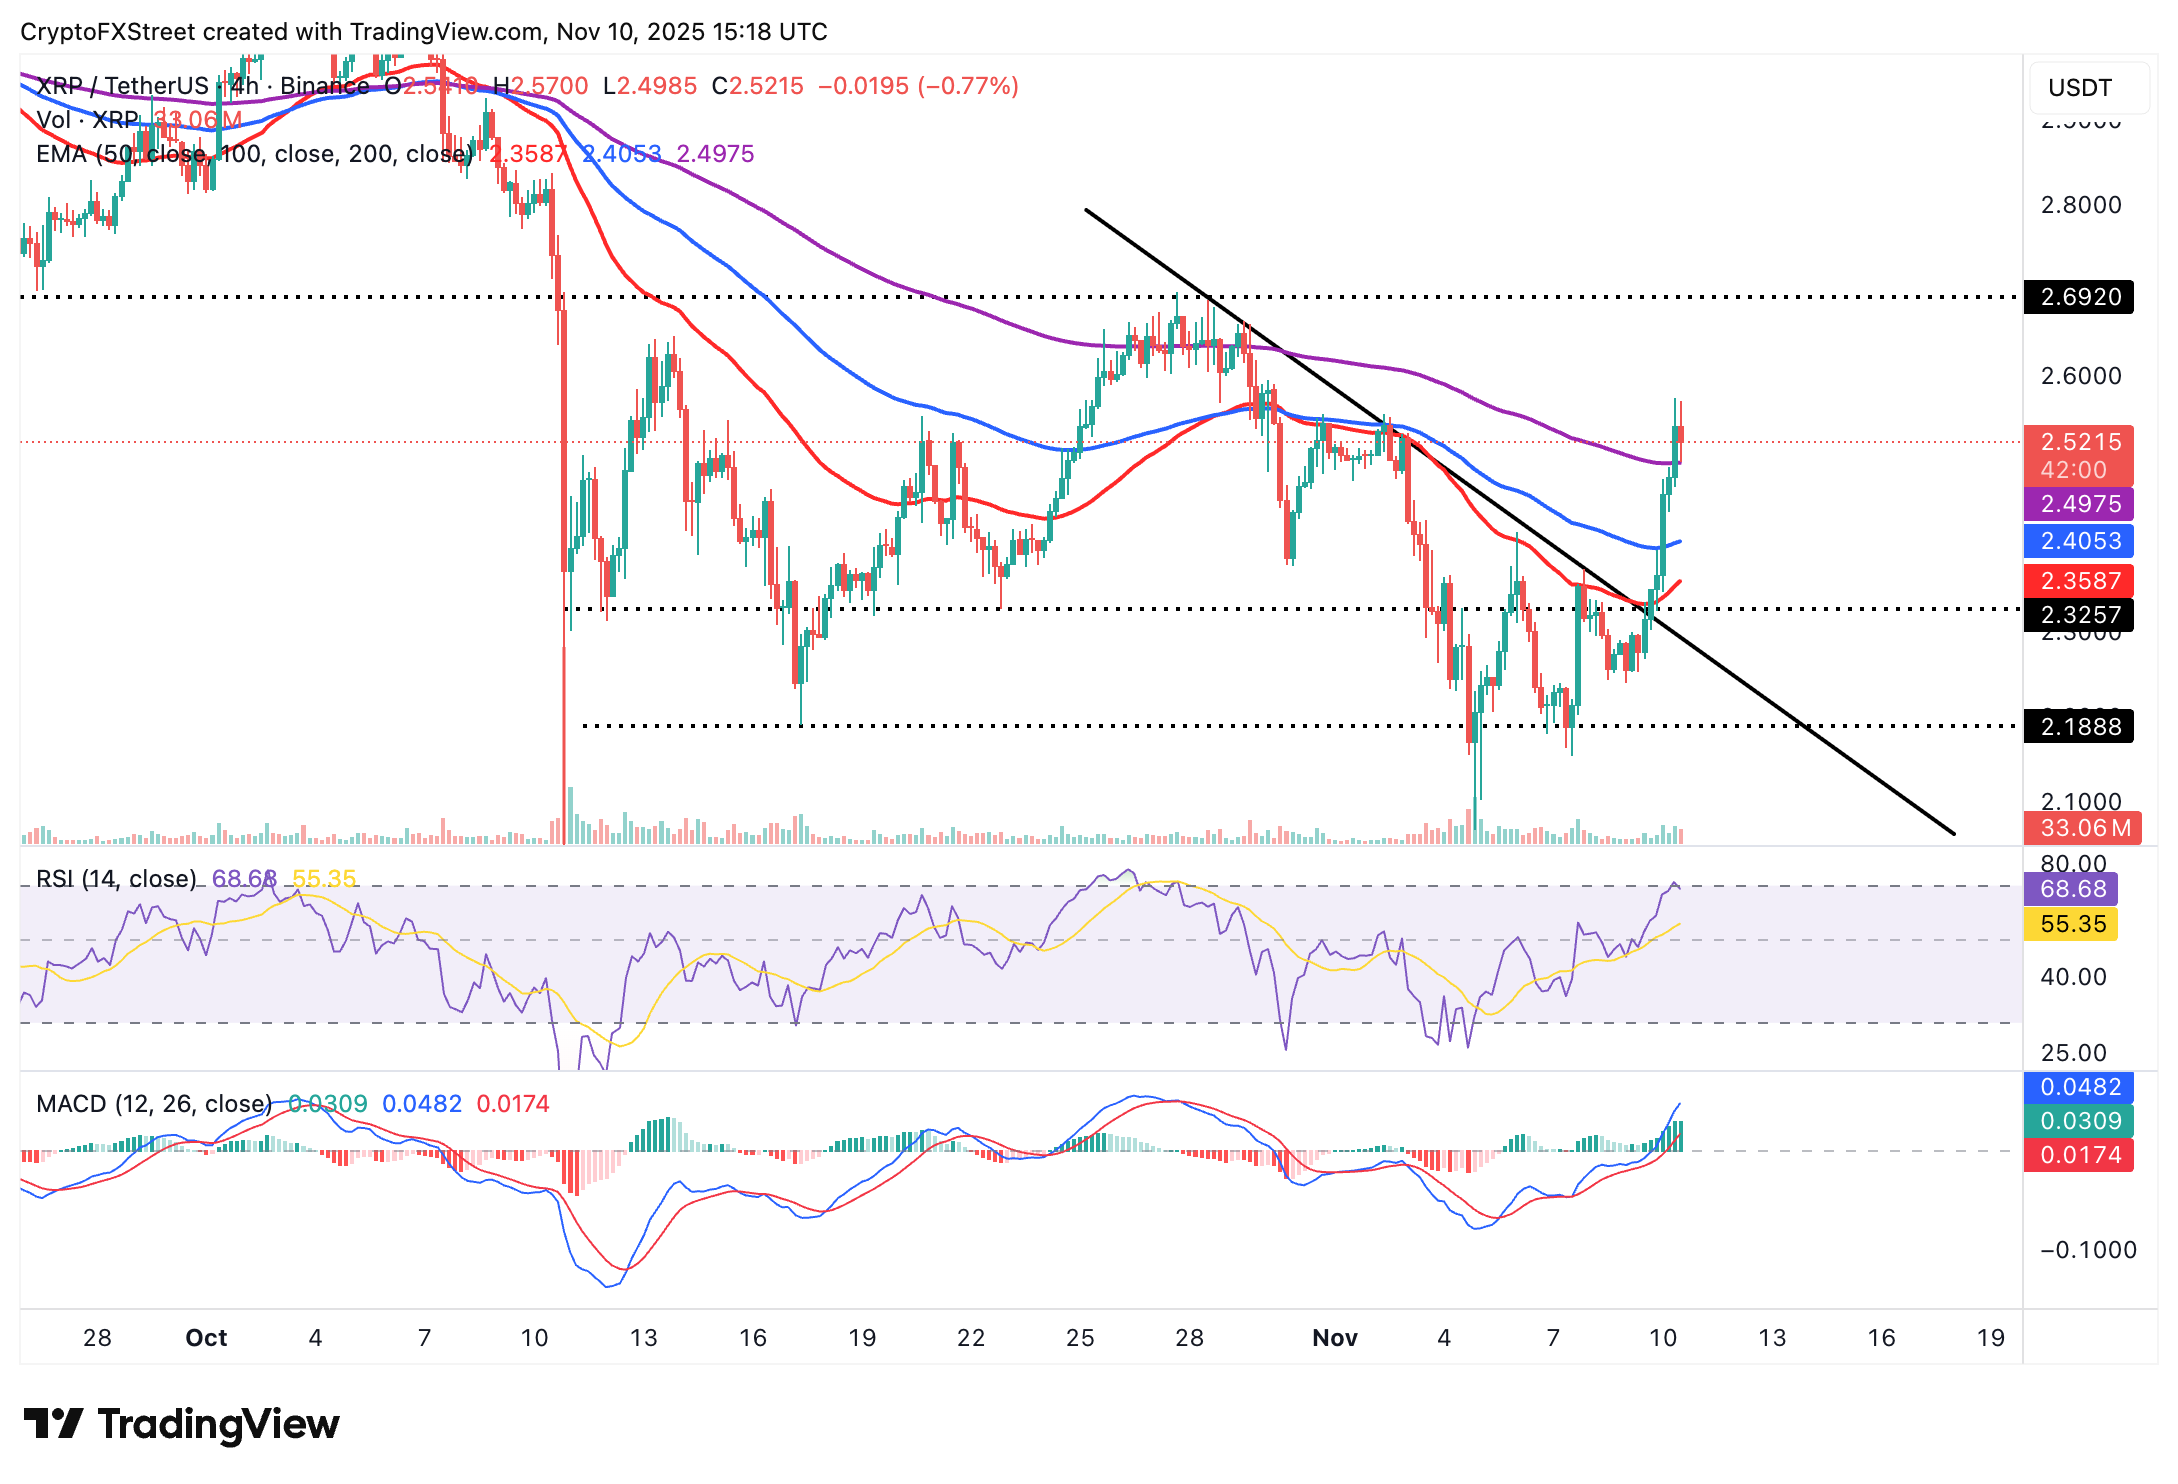
Still, if supply overwhelms demand due to low retail demand in the derivatives market and profit-taking in the spot market, XRP could extend the decline below the 200-period EMA toward the 100-period EMA at 2.40.
Open Interest, funding rate FAQs
Higher Open Interest is associated with higher liquidity and new capital inflow to the market. This is considered the equivalent of increase in efficiency and the ongoing trend continues. When Open Interest decreases, it is considered a sign of liquidation in the market, investors are leaving and the overall demand for an asset is on a decline, fueling a bearish sentiment among investors.
Funding fees bridge the difference between spot prices and prices of futures contracts of an asset by increasing liquidation risks faced by traders. A consistently high and positive funding rate implies there is a bullish sentiment among market participants and there is an expectation of a price hike. A consistently negative funding rate for an asset implies a bearish sentiment, indicating that traders expect the cryptocurrency’s price to fall and a bearish trend reversal is likely to occur.
บทความแนะนำ


