Aptos Price Forecast: APT steadies amid rising stablecoin supply and retail demand

แหล่งที่มา Fxstreet
  • Aptos holds steady after a 5% jump from the 200-day EMA on Sunday, extending the triangle breakout rally. 
  • The stablecoin supply on the Aptos network has increased by 500% over the last year. 
  • Record-high Open Interest signals a sharp increase in retail demand. 

Aptos (APT) price is down by almost 1% at the time of writing on Monday, following the 5% gains from the previous day. The Parallel execution blockchain token is poised for further growth, driven by a breakout of the descending triangle pattern, elevated retail demand, and the rising issuance of stablecoins on the network. 

Stablecoins move to the Aptos network

Aptos posted on Monday, sharing the increasing availability of stablecoins on the network. Typically, a rise in stablecoin market capitalization on a network refers to increased liquidity, supporting further Decentralized Finance (DeFi) activities. 

Over the last 24 hours, Aptos has seen a stablecoin inflow of over $110 million, representing a 500% year-over-year (YoY) increase, which supports the above thesis. Out of the total increase, the 8x rise in USDT supply and the 2x rise in USDC sustain the duopoly.

https://x.com/Aptos/status/1974928842684060002

Retail demand is on the rise for Aptos

A steady rise in retail interest remains a key driver of the Aptos rally. Derivative traders are acquiring long positions on Aptos, based on CoinGlass data showing futures Open Interest (OI) reaching a record high of $522.23 million, up from $492.57 million on Sunday. This increase in capital inflow in the Aptos futures reflects a risk-on sentiment among traders. 

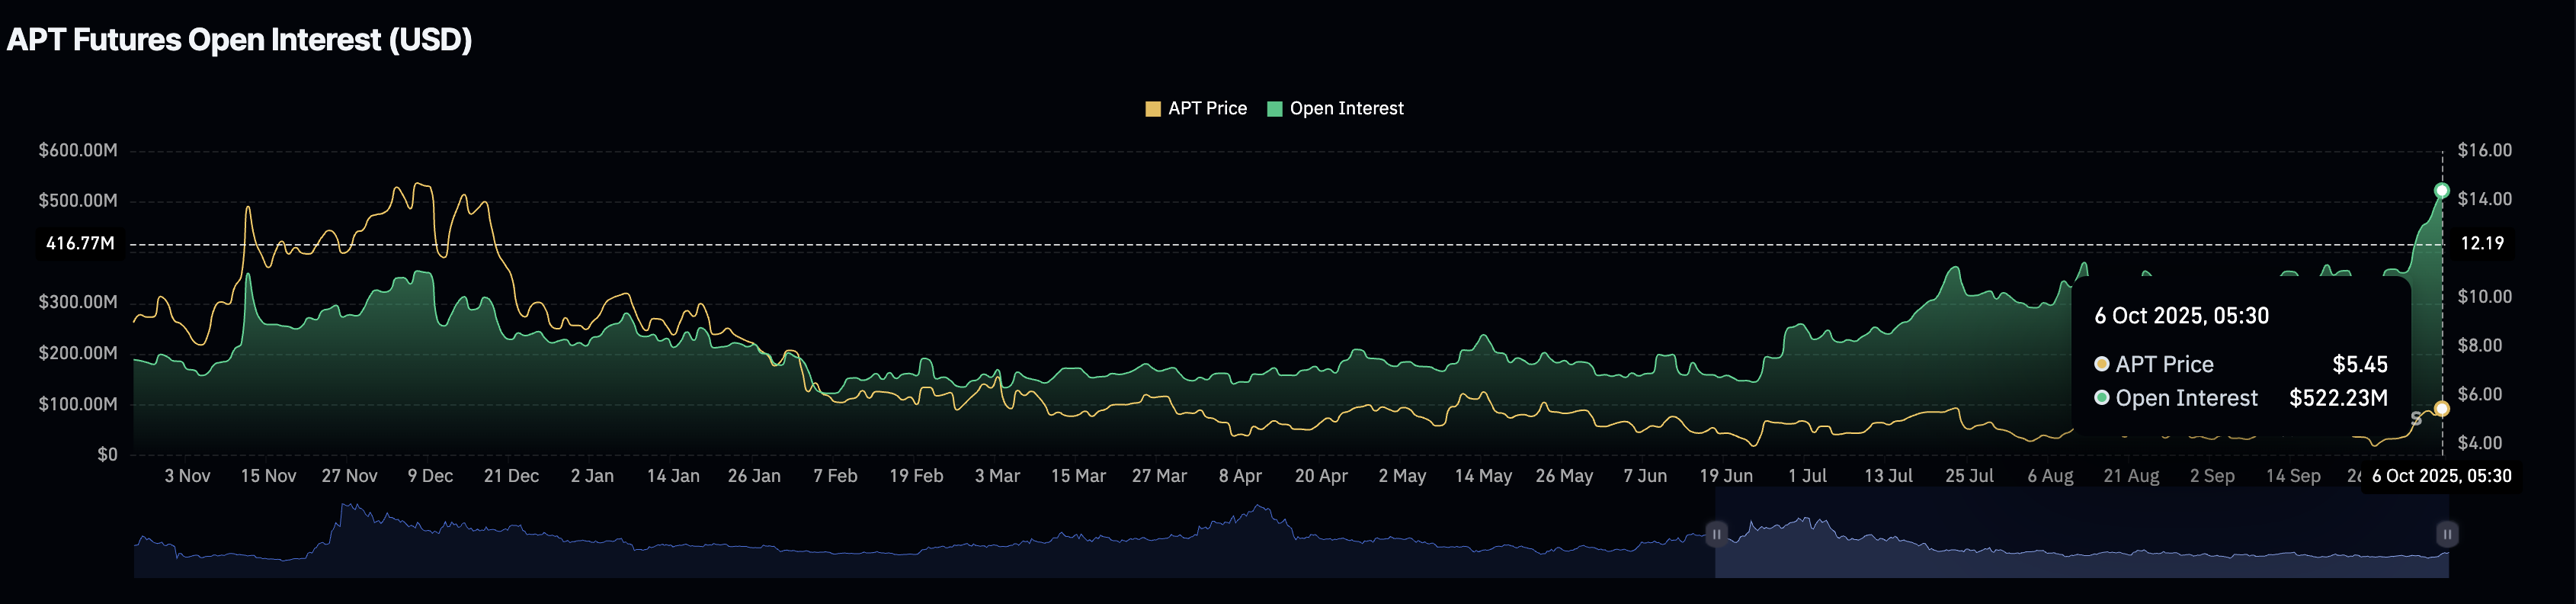
Aptos Open Interest. Source: CoinGlass

Aptos eyes further gains amid an impending bullish cross

Aptos trades above the 200-day Exponential Moving Average (EMA) at $5.166 as the uptrending 50-day and 100-day EMA prepare for a bullish cross. This indicates that the short-term recovery is gaining strength, outpacing the prevailing trend. 

Additionally, the momentum indicators on the daily chart maintain a bullish tilt as the Relative Strength Index (RSI) reads 68, close to the overbought zone, signaling heightened buying pressure. Meanwhile, the Moving Average Convergence Divergence (MACD) indicator displays a steady uptrend in the MACD line, indicating a rise in bullish momentum. 

If the APT rally holds momentum, it could surpass the overhead R3 resistance pivot level at $5.703, targeting the R4 level at $6.166.

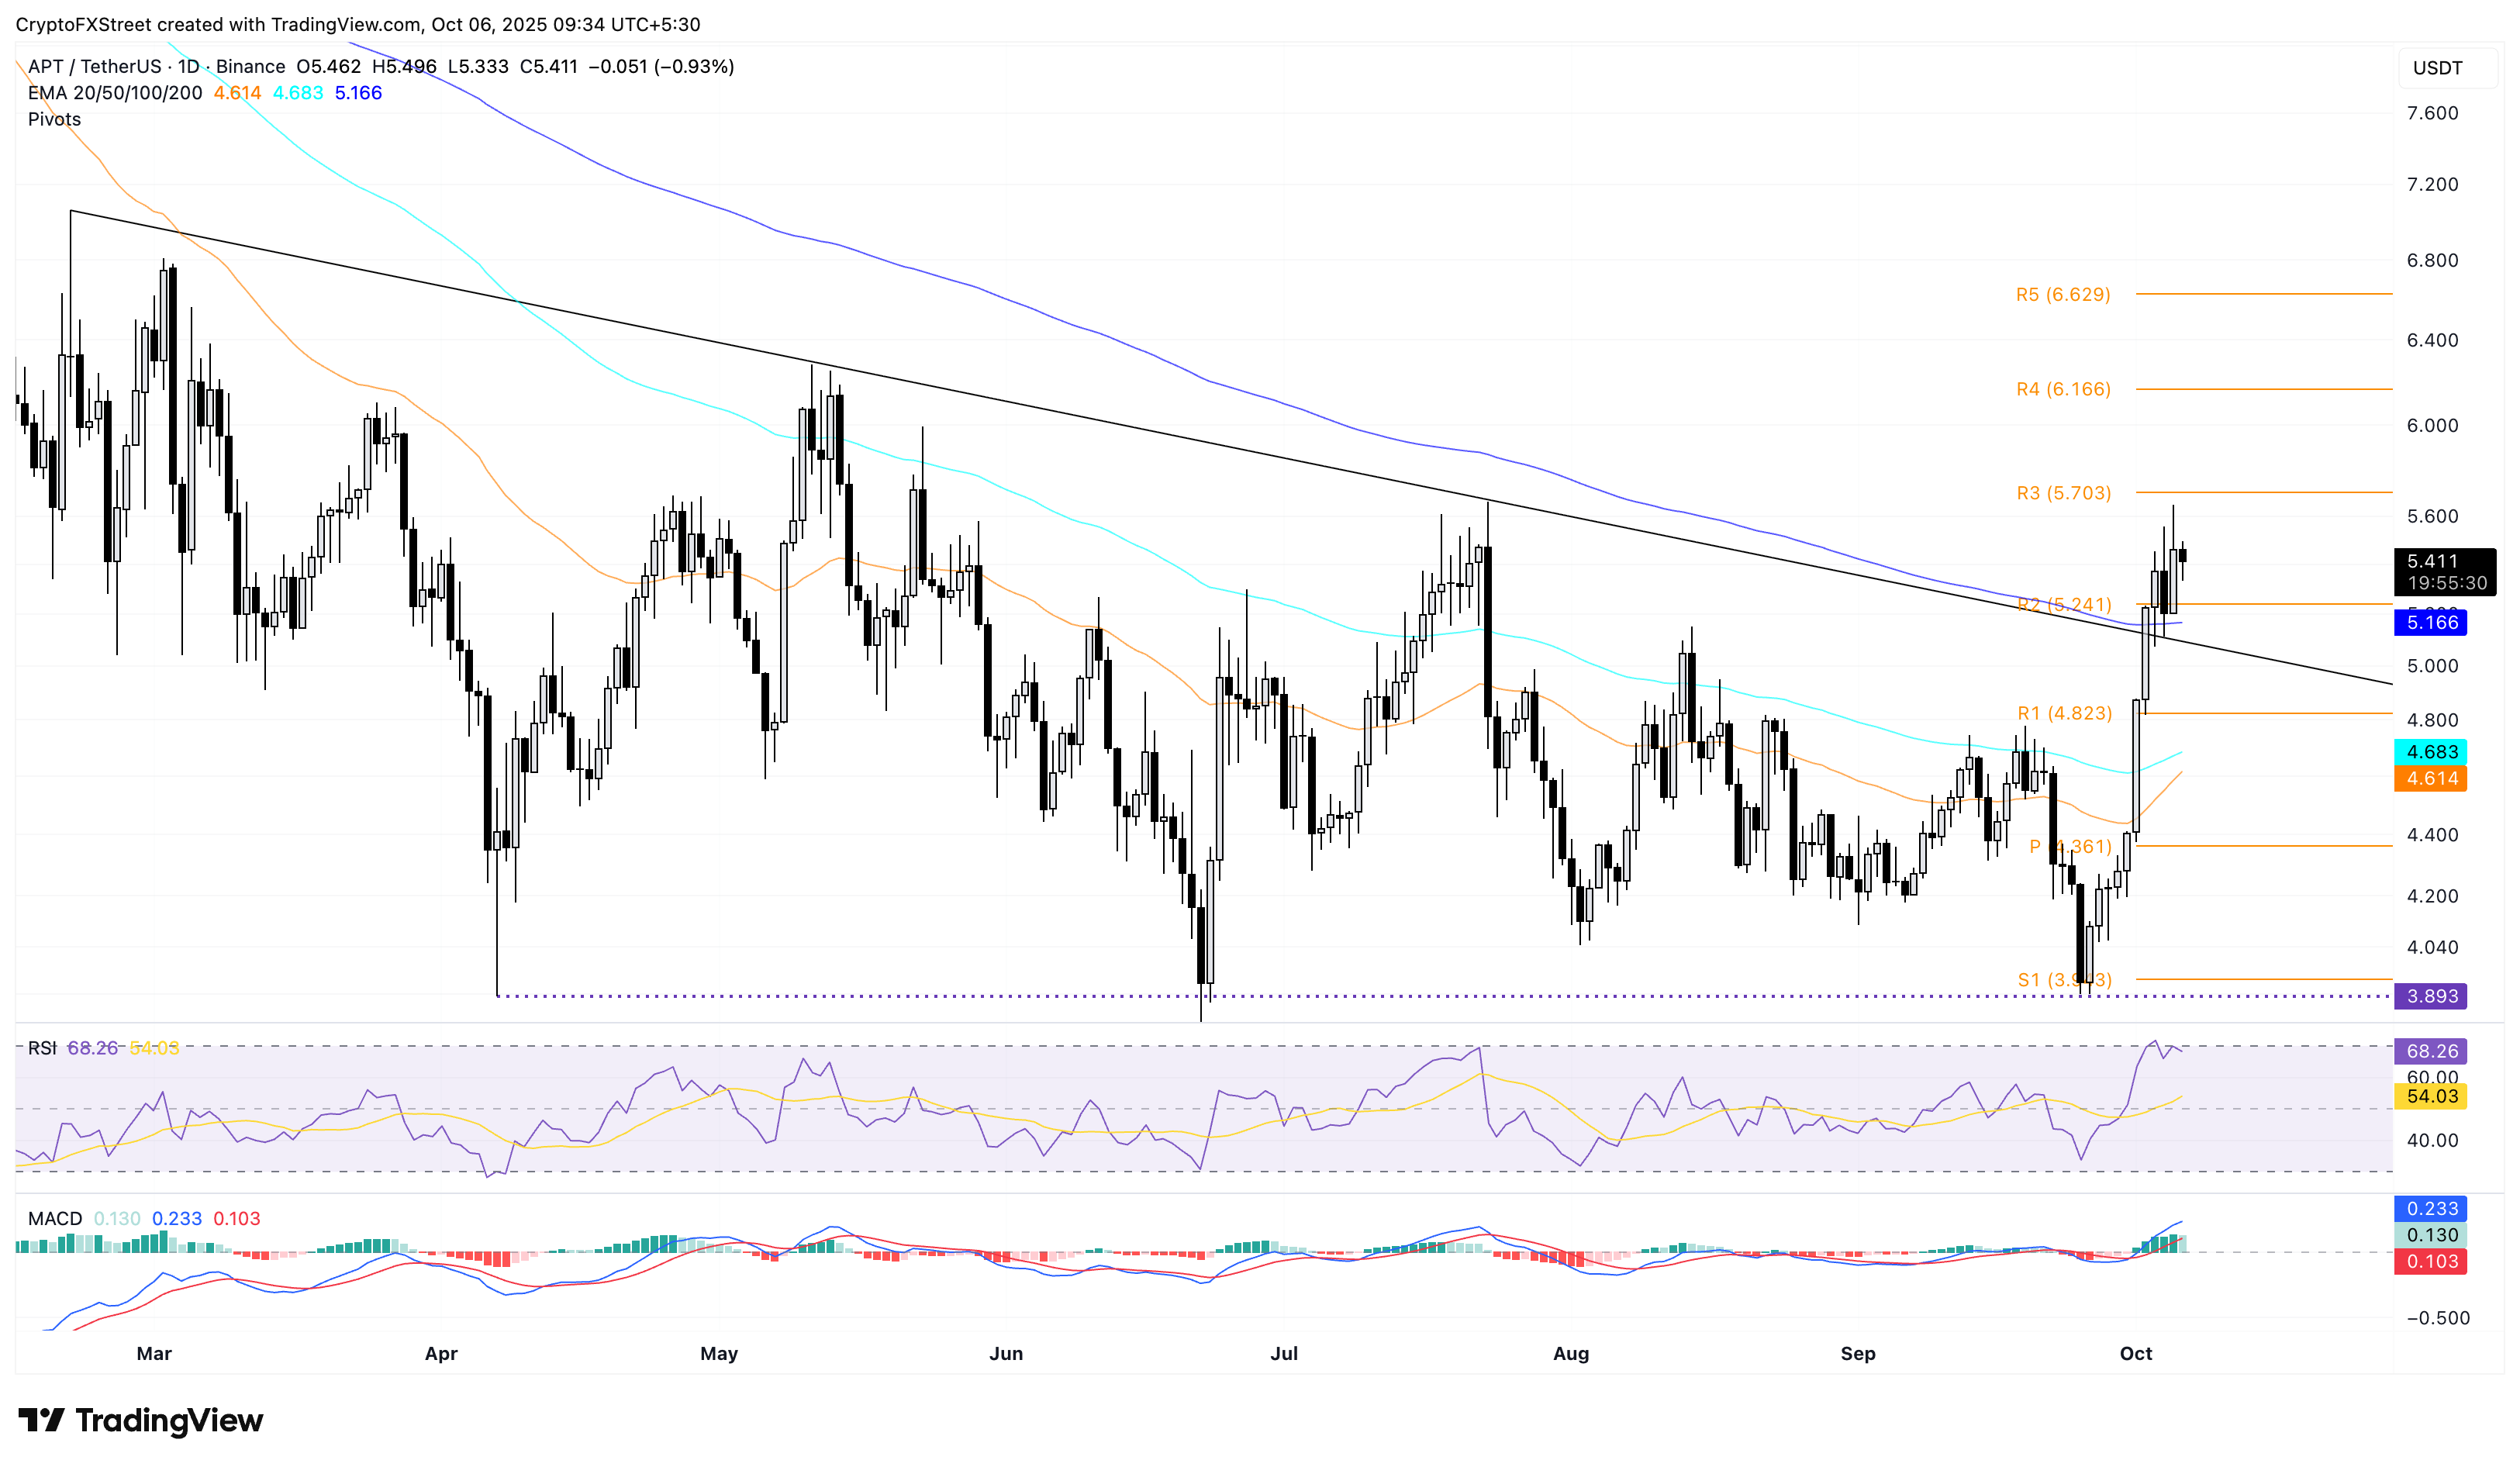
APT/USDT daily price chart.

Looking down, the 200-day EMA at $5.166, moving close to the broken trendline of the descending triangle pattern, remains a crucial support.

ข้อจำกัดความรับผิดชอบ: เพื่อการอ้างอิงเท่านั้น ผลการดำเนินงานในอดีตไม่ได้บ่งบอกถึงผลลัพธ์ในอนาคต
placeholder
เงินเยนดีดตัวขึ้น 1.8% จะอยู่ได้นานแค่ไหน?ดัชนีดอลลาร์สหรัฐร่วงลง 0.13% และราคาสกุลเงินที่ไม่ใช่ดอลลาร์สหรัฐขึ้นลงแบบไม่สม่ำเสมอ ในหมู่สกุลเงินเหล่านี้ เงินเยนเพิ่มขึ้น 1.8% และเงินยูโรลดลง 0.5%
ผู้เขียน  Mitrade
วันที่ 07 ธ.ค. 2023
ดัชนีดอลลาร์สหรัฐร่วงลง 0.13% และราคาสกุลเงินที่ไม่ใช่ดอลลาร์สหรัฐขึ้นลงแบบไม่สม่ำเสมอ ในหมู่สกุลเงินเหล่านี้ เงินเยนเพิ่มขึ้น 1.8% และเงินยูโรลดลง 0.5%
placeholder
คาดการณ์ราคาของ EUR/USD: รวมตัวอยู่รอบระดับ 1.1700 ก่อนการลงมติความเชื่อมั่นในฝรั่งเศสในช่วงท้ายของตลาดลงทุนเอเชียวันจันทร์ คู่ EURUSD เคลื่อนไหวในกรอบแคบๆ ประมาณ 1.1710 คู่เงินหลักนี้ปรับฐานในขณะที่นักลงทุนรอการลงมติความเชื่อมั่นของฝรั่งเศส ซึ่งมีกำหนดในช่วงเวลาการซื้อขายในยุโรป
ผู้เขียน  FXStreet
9 เดือน 08 วัน จันทร์
ในช่วงท้ายของตลาดลงทุนเอเชียวันจันทร์ คู่ EURUSD เคลื่อนไหวในกรอบแคบๆ ประมาณ 1.1710 คู่เงินหลักนี้ปรับฐานในขณะที่นักลงทุนรอการลงมติความเชื่อมั่นของฝรั่งเศส ซึ่งมีกำหนดในช่วงเวลาการซื้อขายในยุโรป
placeholder
คาดการณ์ XAUUSD: ราคาทองคำปรับตัวลดลงต่ำกว่า $3,650 จากการทำกำไรราคาทองคำ (XAU/USD) ขยับลงมาอยู่ที่ประมาณ $3,630 ในช่วงเช้าของตลาดลงทุนเอเชียวันศุกร์ โลหะมีค่าถอยกลับจากระดับสูงสุดเป็นประวัติการณ์เนื่องจากการปิดออเดอร์เพื่อทำกำไร อย่างไรก็ตาม การเก็งการปรับลดอัตราดอกเบี้ยของธนาคารกลางสหรัฐฯ (เฟด) ที่เพิ่มขึ้นในการประชุมที่จะถึงนี้อาจจำกัดขาลงของราคาทองคำ
ผู้เขียน  FXStreet
9 เดือน 12 วัน ศุกร์
ราคาทองคำ (XAU/USD) ขยับลงมาอยู่ที่ประมาณ $3,630 ในช่วงเช้าของตลาดลงทุนเอเชียวันศุกร์ โลหะมีค่าถอยกลับจากระดับสูงสุดเป็นประวัติการณ์เนื่องจากการปิดออเดอร์เพื่อทำกำไร อย่างไรก็ตาม การเก็งการปรับลดอัตราดอกเบี้ยของธนาคารกลางสหรัฐฯ (เฟด) ที่เพิ่มขึ้นในการประชุมที่จะถึงนี้อาจจำกัดขาลงของราคาทองคำ
placeholder
คาดการณ์ XAUUSD: ราคาทองคำเคลื่อนตัวสูงขึ้นใกล้ $3,750 ท่ามกลางการเก็งการลดดอกเบี้ยและความเสี่ยงทางภูมิศาสตร์ในช่วงเช้าของตลาดลงทุนเอเชียวันพฤหัสบดี ราคาทองคํา (XAUUSD) เคลื่อนไหวในแดนบวกที่บริเวณ $3,750 ทองคำปรับตัวสูงขึ้นท่ามกลางความคาดหวังเกี่ยวกับการปรับลดอัตราดอกเบี้ยของสหรัฐฯ จากธนาคารกลางสหรัฐฯ (เฟด) ในปีนี้และความเสี่ยงทางภูมิรัฐศาสตร์ที่ยังคงมีอยู่
ผู้เขียน  FXStreet
9 เดือน 25 วัน พฤหัส
ในช่วงเช้าของตลาดลงทุนเอเชียวันพฤหัสบดี ราคาทองคํา (XAUUSD) เคลื่อนไหวในแดนบวกที่บริเวณ $3,750 ทองคำปรับตัวสูงขึ้นท่ามกลางความคาดหวังเกี่ยวกับการปรับลดอัตราดอกเบี้ยของสหรัฐฯ จากธนาคารกลางสหรัฐฯ (เฟด) ในปีนี้และความเสี่ยงทางภูมิรัฐศาสตร์ที่ยังคงมีอยู่
placeholder
การคาดการณ์ราคาเงิน: XAGUSD เคลื่อนไหวต่ำกว่า 47.00 ดอลลาร์ ใกล้ระดับสูงสุดตั้งแต่เดือนพฤษภาคม 2011โลหะเงิน (XAG/USD) ยังคงถูกจำกัดอยู่ในกรอบราคาใกล้ระดับสูงสุดนับตั้งแต่เดือนพฤษภาคมปี 2011 ที่แตะไปเมื่อวันก่อน และซื้อขายอยู่ต่ำกว่าระดับ $47.00 ในช่วงเซสชั่นเอเชียวันอังคาร
ผู้เขียน  FXStreet
9 เดือน 30 วัน อังคาร
โลหะเงิน (XAG/USD) ยังคงถูกจำกัดอยู่ในกรอบราคาใกล้ระดับสูงสุดนับตั้งแต่เดือนพฤษภาคมปี 2011 ที่แตะไปเมื่อวันก่อน และซื้อขายอยู่ต่ำกว่าระดับ $47.00 ในช่วงเซสชั่นเอเชียวันอังคาร
goTop
quote