
Top Crypto Gainers: ETHFI, CAKE, SPX – DeFi tokens lead the rally
- Ether.fi leads the crypto market rally with a 17% rise in the last 24 hours.
- PancakeSwap's rally takes a breather, struggling at the crucial $3.165 resistance.
- SPX6900 records double-digit growth in the last 24 hours, facing a crucial resistance trendline.
Decentralized Finance (DeFi) tokens, such as Ether.fi (ETHFI) and PancakeSwap (CAKE) are leading the broader cryptocurrency market rally at the time of writing on Friday, with the meme coin SPX6900 (SPX) following suit.
Ether.fi spark cools down
Ether.fi is down 1% at the time of writing on Friday, following a 22% surge on Thursday. The DeFi token recovery exceeded the $1.631 resistance, making the $1.871 level as the immediate resistance, last tested on January 20.
The intraday pullback hints at the possibility of ETHFI retesting the $1.631 breakout level, signaling a breather phase.
Still, the technical indicators on the daily chart reflect an upcoming shift in trend momentum as the Moving Average Convergence Divergence (MACD) converges with its signal line. A potential crossover would indicate a rise in bullish momentum.
Additionally, the Relative Strength Index (RSI) at 62 displays a surge in buying pressure with room for further growth before reaching the overbought zone.
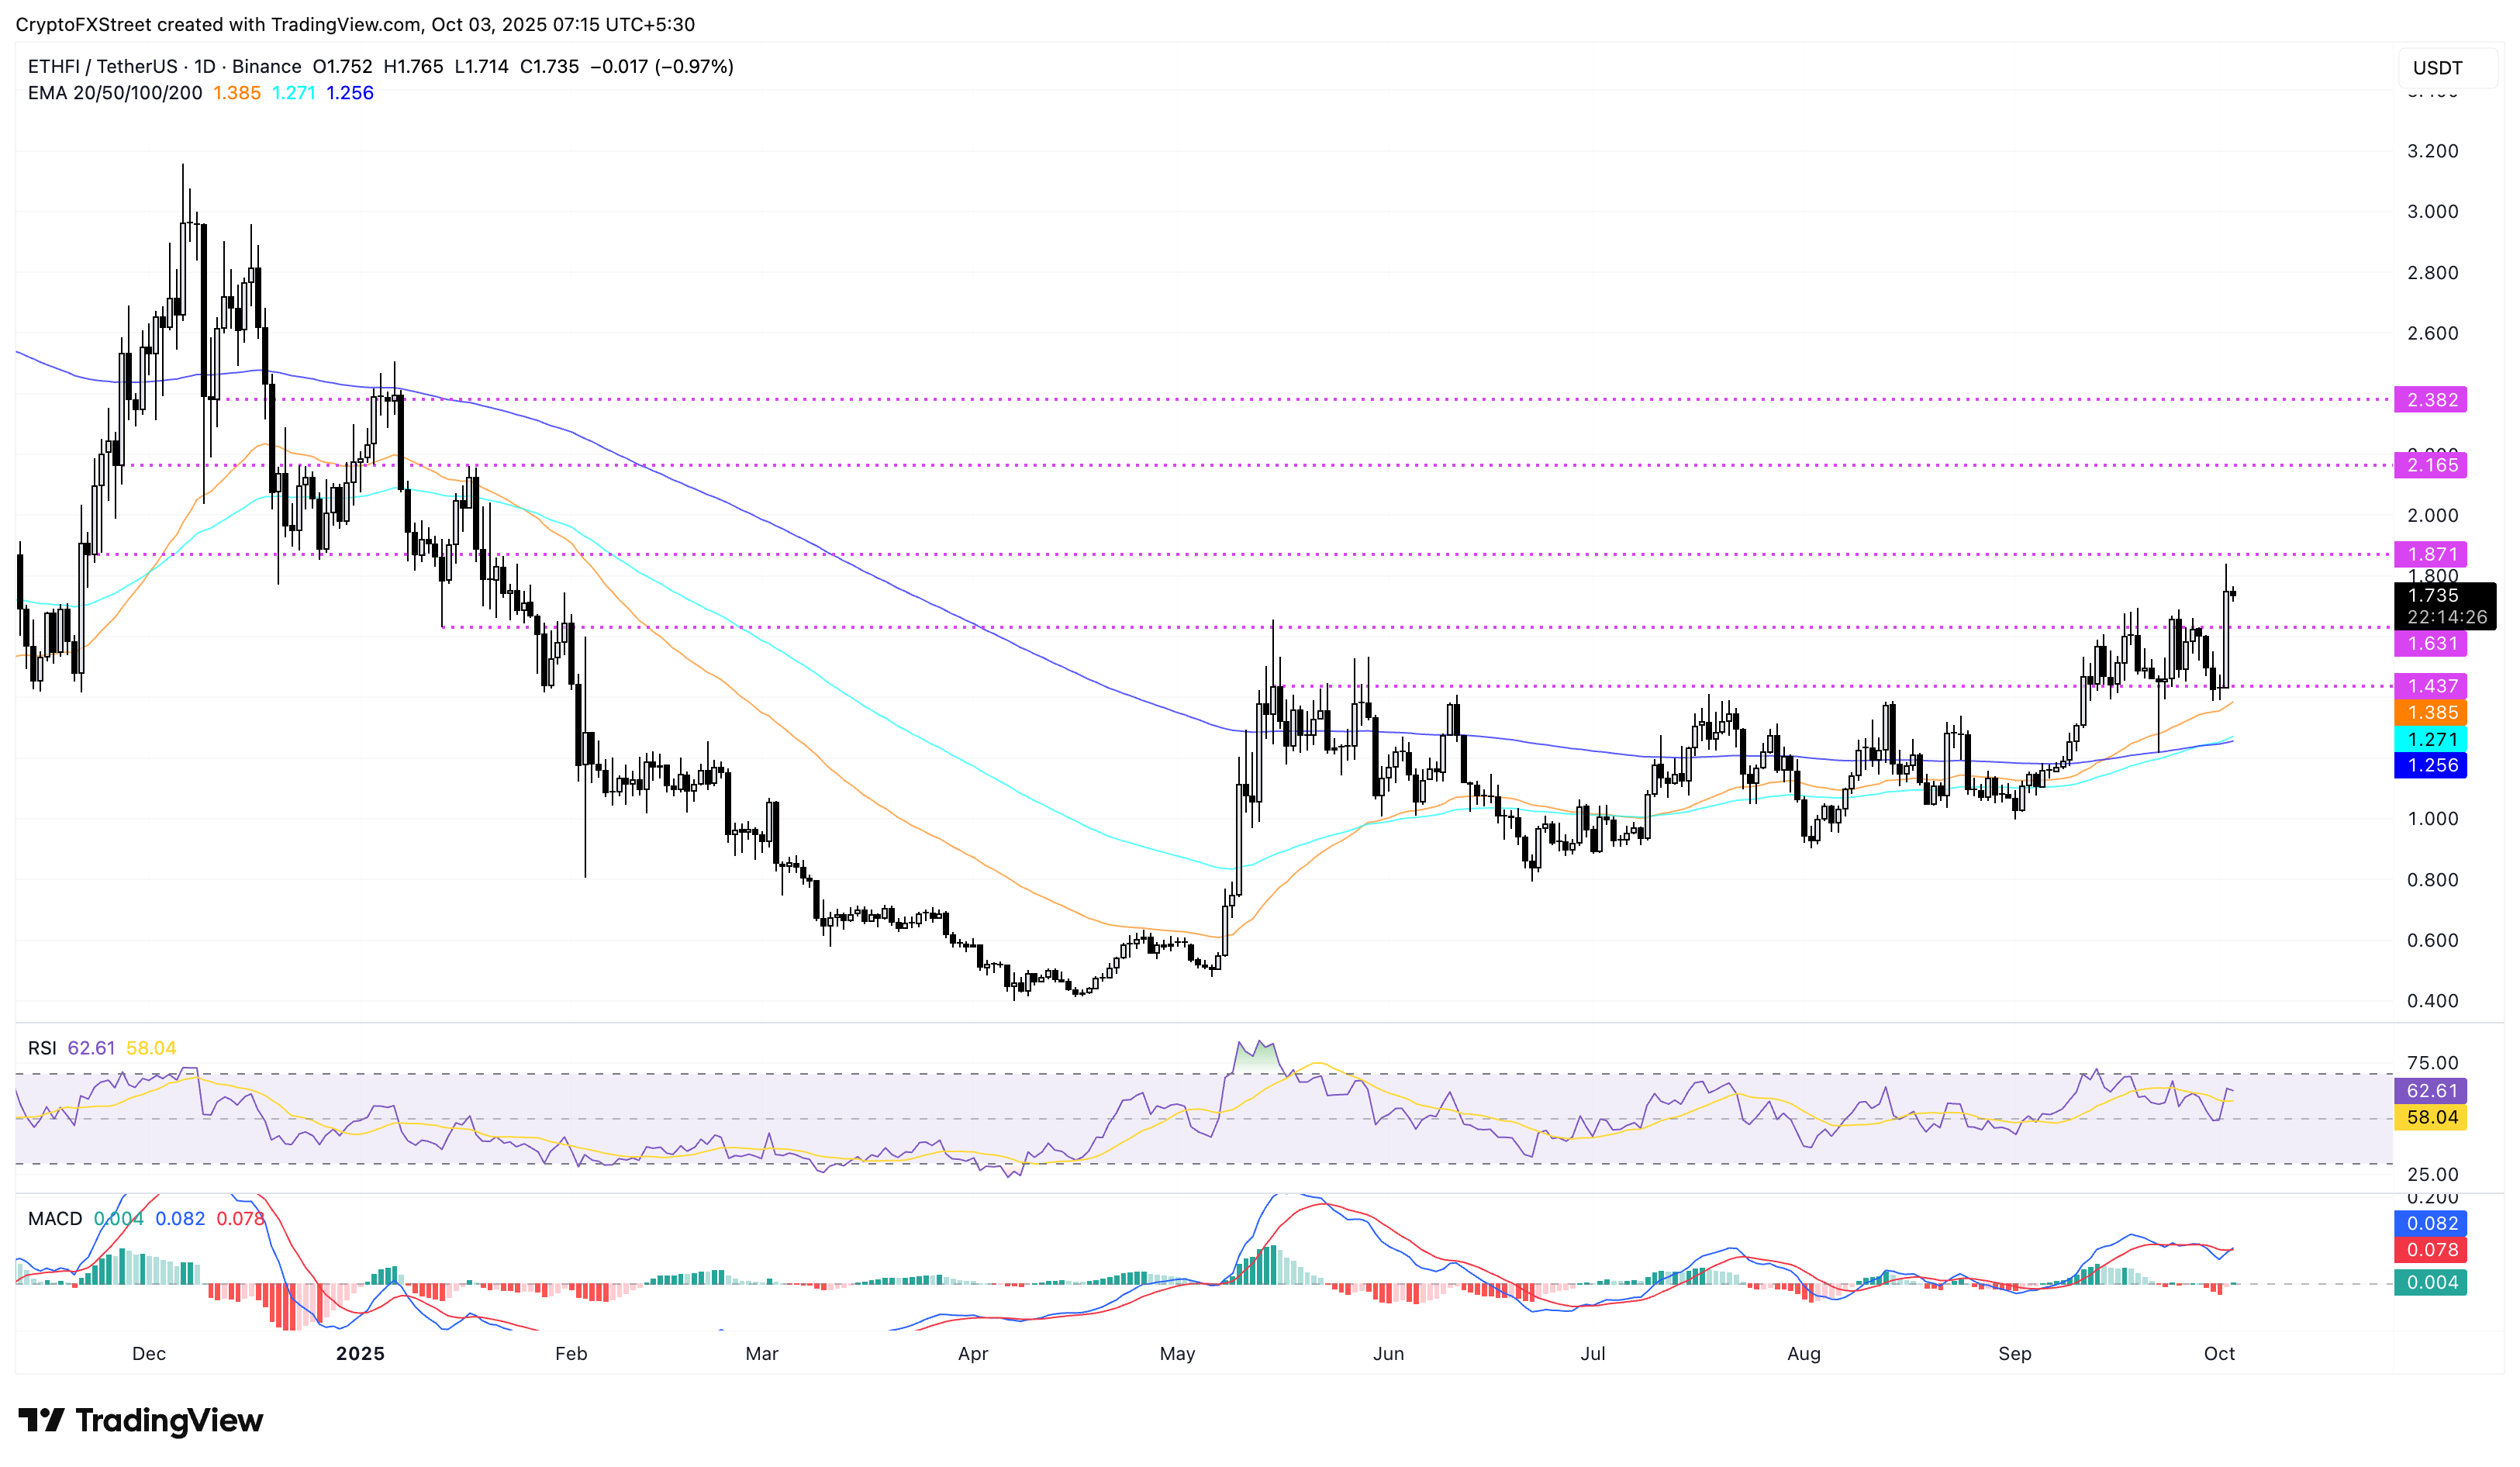
ETHFI/USDT daily price chart.
Looking down, a sweep below $1.631 would invalidate the DeFi token’s breakout run, which could test the $1.437 support level marked by multiple reversal points in September.
PancakeSwap rally faces a key hurdle at $3.165
PancakeSwap is gradually gaining demand, with its quarterly volume hitting a record high of $772 billion. At the time of writing, CAKE is up over 15% in the last 24 hours, holding above the $3.00 mark.
Still, the recovery run faces overhead pressure at the $3.165 resistance level, which has remained intact since February 13. A decisive close above this level could unleash the trapped momentum for a rally to the $3.535 or $4.194 level, last tested on December 13 and December 9, respectively.
The RSI on the daily chart shows a surge to 63, indicating a rise in buying activity. Meanwhile, the MACD extends the uptrend after crossing above its signal line on Thursday, marking the start of a bullish trend.
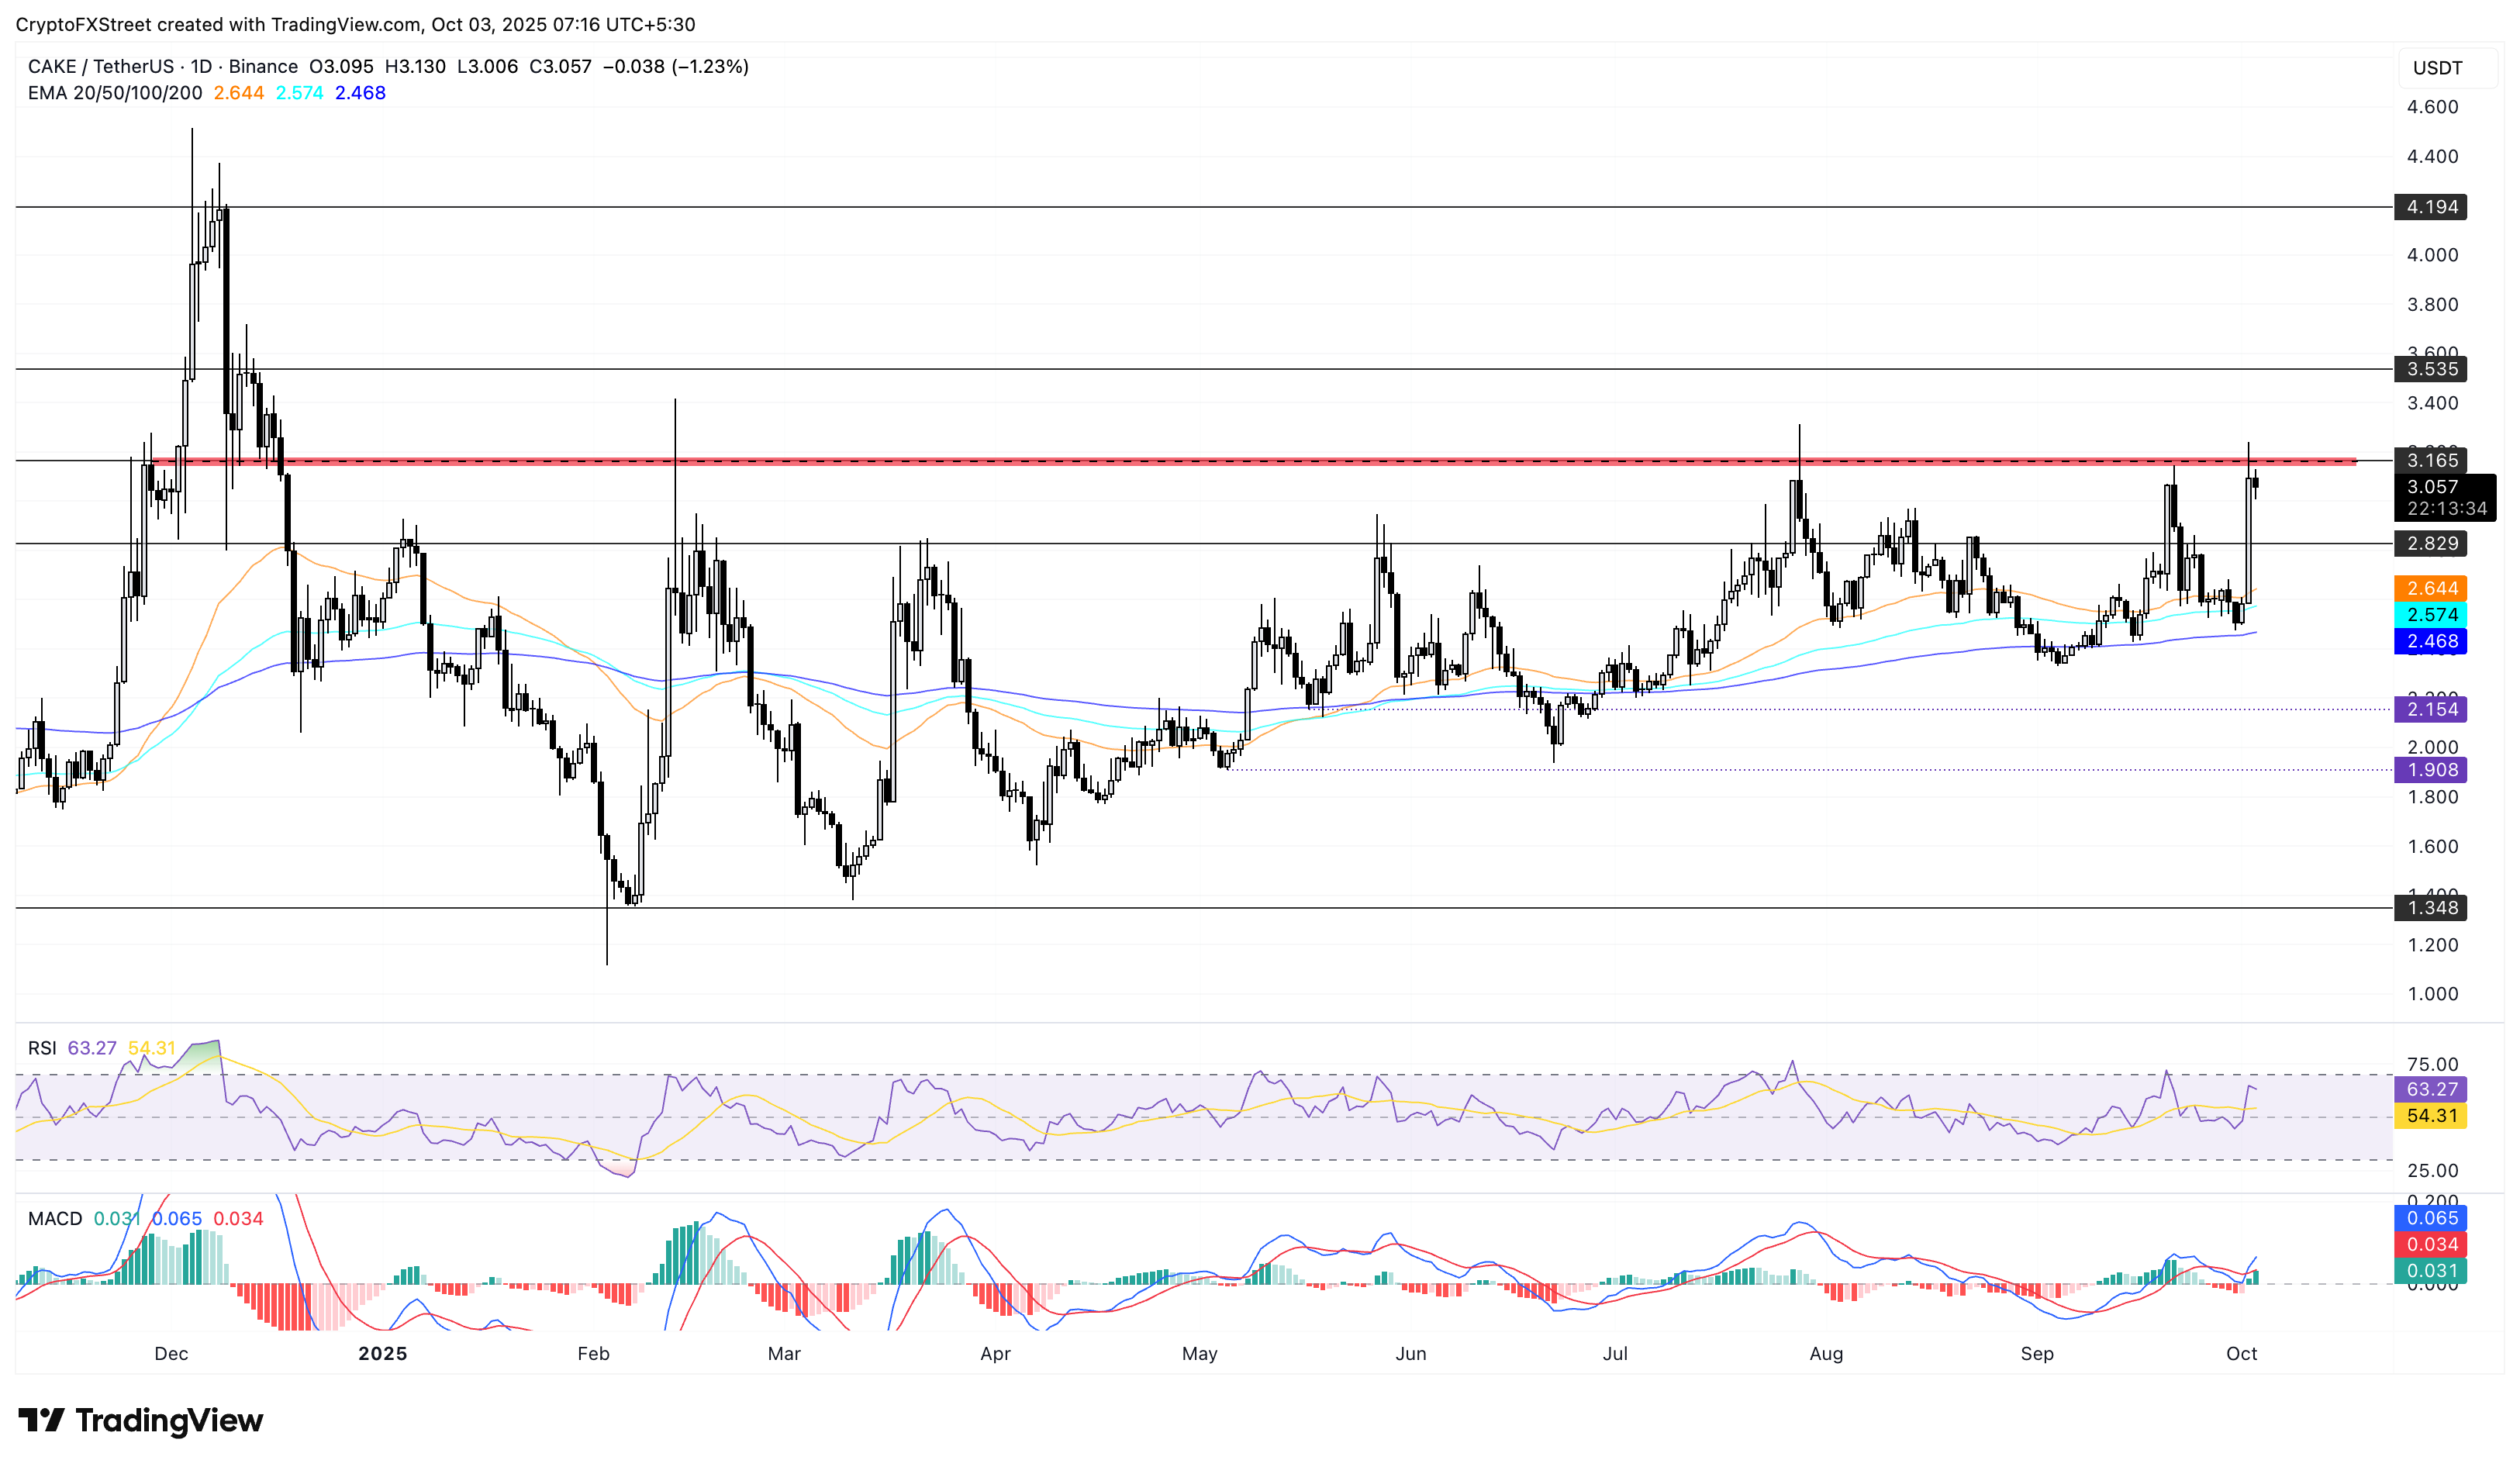
CAKE/USDT daily price chart.
However, a reversal from $3.165 could reverse the trend, potentially resulting in a decline to the $2.829 support, which had previously acted as key resistance earlier this year.
SPX eyes to extend gains with channel breakout
SPX6900 meme coin holds steady above its 100-day Exponential Moving Average (EMA) at $1.2845 by press time on Friday. The meme coin recovery challenges the overhead trendline of a falling channel pattern, hinting at a potential breakout.
A decisive close above this trendline at $1.3300 would confirm the pattern breakout, which could result in a new uptrend. The key resistance levels for SPX lie at the $1.4805 peak from September 17, followed by the $1.6384 mark, aligning with the 1.272 Fibonacci extension level retraced from $1.4805 to the $0.9001 low from Tuesday.
Validating a bullish shift, the MACD continues to rise steadily following the crossover on Thursday. Additionally, the RSI at 56 holds above the halfway line, indicating a bullish incline in trend momentum.
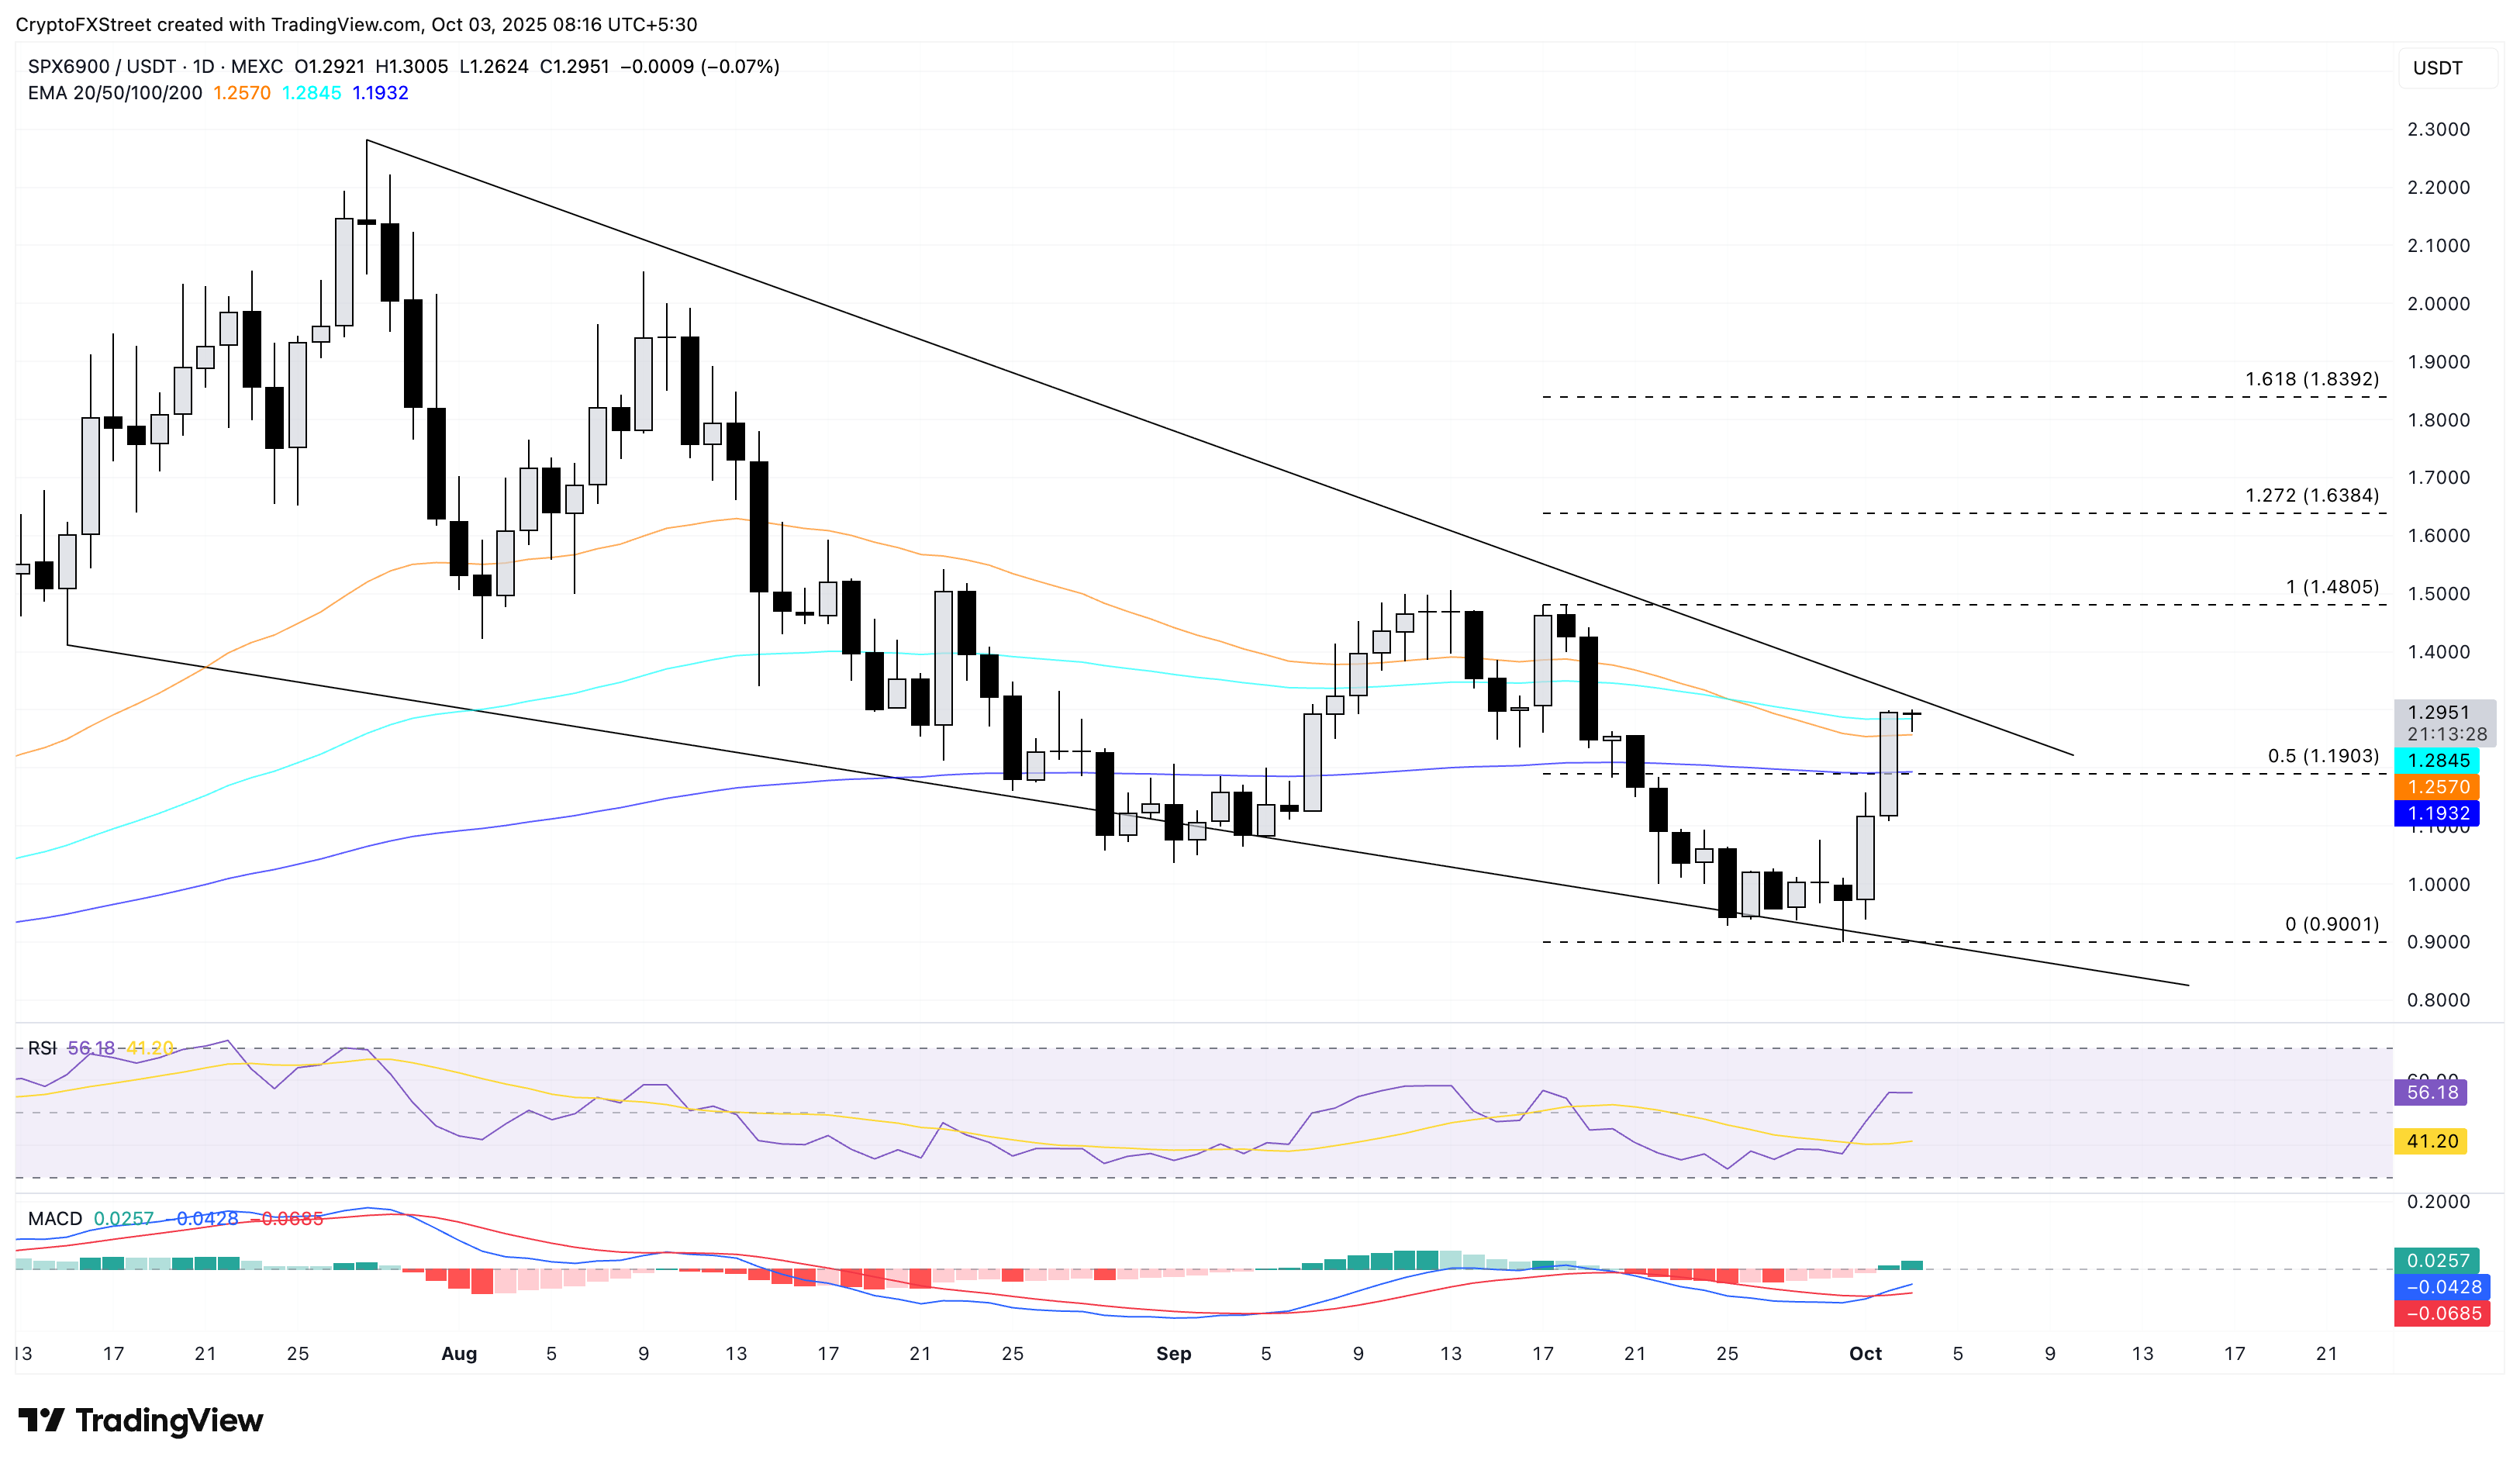
SPX/USDT daily price chart.
Still, a reversal from the overhead trendline would invalidate the breakout thesis. In such a case, the 50-day EMA at $1.2576 and the 200-day EMA at $1.1934 could act as dynamic support levels.
บทความแนะนำ


